1.2.5a Price elasticity of supply: concept and calculation
Price elasticity of supply
Price elasticity of supply (PES): a measure of how responsive quantity supplied is to a change in the good's own price, found as the percentage change in quantity supplied divided by the percentage change in price.
- Positive by construction: because the supply curve slopes upward, price and quantity supplied move in the same direction, so PES normally carries a + sign.
- Each percentage change divides the change by its original value and × 100, so dividing the two percentages cancels the units and leaves PES as a pure number you can compare across markets.
- A craft brewery raises its price from £4.00 to £4.40 a bottle (a 10% rise); over the next quarter output climbs from 20,000 to 21,000 bottles (a 5% rise).
- PES is +0.5, between 0 and 1, so supply is relatively inelastic: output responds proportionately less than price, as expected when a brewer cannot brew and mature extra beer quickly.
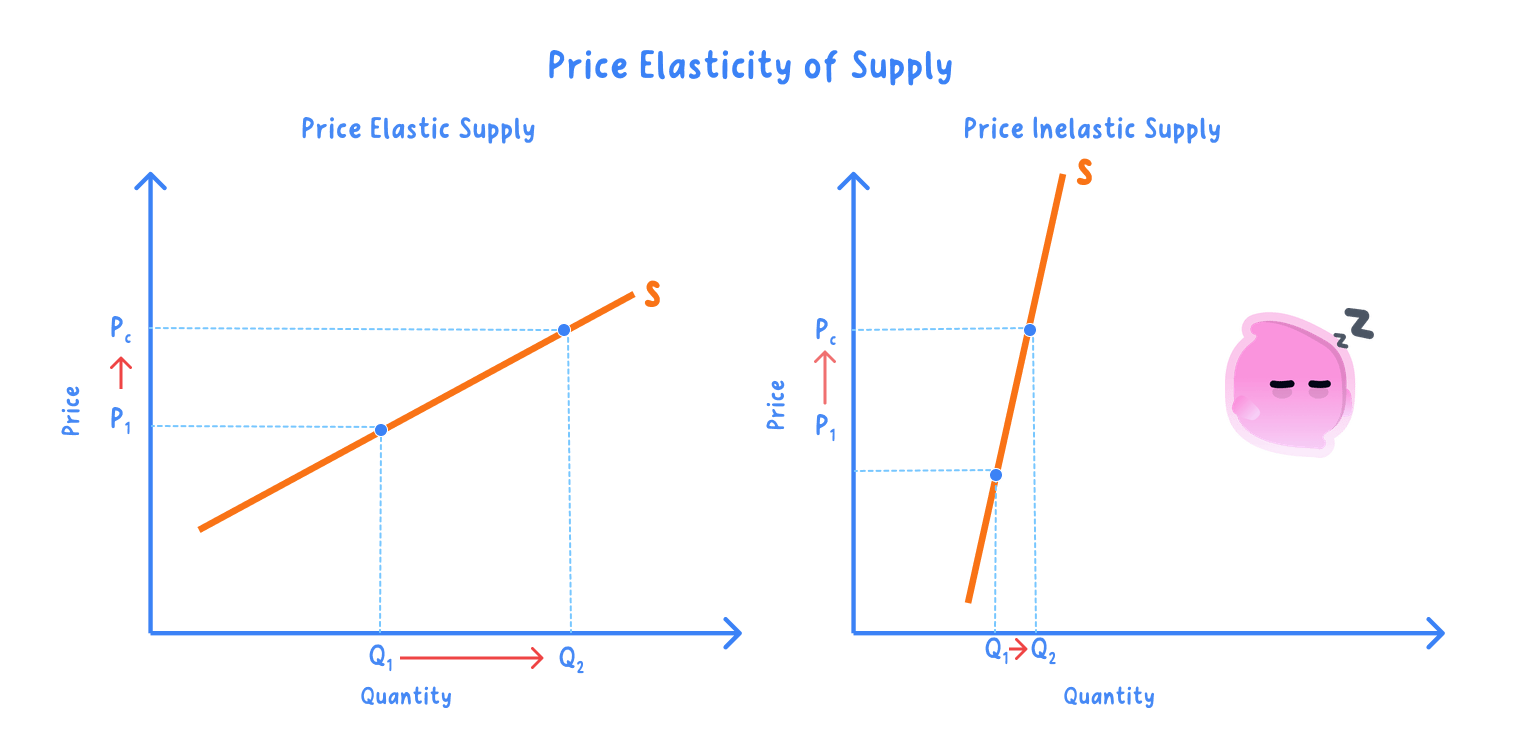
Inelastic supply
Relatively inelastic supply: PES between 0 and 1, so quantity supplied changes proportionately less than price.
Perfectly inelastic supply: PES of 0, so quantity supplied is fixed whatever the price, drawn as a vertical supply curve.
- Why supply is often inelastic: when firms have little spare capacity or hold few stocks, a higher price cannot quickly draw out extra output, so quantity supplied barely moves and PES stays below 1.
- At the vertical extreme the quantity is fixed in the moment, for example seats at tonight's concert, so no price can raise quantity supplied and PES = 0.
Elastic supply
Relatively elastic supply: PES greater than 1, so quantity supplied changes proportionately more than price.
Perfectly elastic supply: infinite PES, drawn as a horizontal line at one price.
Unit elastic supply: PES of exactly 1, the boundary between elastic and inelastic supply.
- Why supply can be elastic: when firms hold spare capacity or plentiful stocks, or can switch production easily, a small price rise draws out a large rise in output, so PES exceeds 1.
- Any straight supply line drawn through the origin is unit elastic at every point, a quick geometric check in the exam.
- A vertical supply curve is like strawberries already picked that day: no more can be supplied whatever the price, so PES is 0.
- A near-horizontal curve is like a factory with spare capacity that can flood the market at one price, so PES is very high.
- State the formula and show both percentage changes before dividing.
- Keep PES positive for a normal upward-sloping supply curve.
- Interpret the coefficient as elastic or inelastic, not just the number.
- Do not invert the formula: PES is the % change in quantity supplied over the % change in price, not the other way round.
- Do not expect a negative PES in normal cases, since supply slopes upward.
- What does PES measure and what is its formula?
- Calculate PES if a 10% price rise raises quantity supplied by 5%.
- What PES value is perfectly inelastic, and how is it drawn?
- What PES value is perfectly elastic, and how is it drawn?
1.2.5b Factors influencing supply elasticity; time
Determinants of PES
Spare capacity: unused machines or labour that a firm can bring into production quickly.
Factor mobility: the ease with which factors of production can be obtained and switched between uses.
Stocks (inventories): finished goods held back that can be released without any new production.
- Spare capacity: idle machines and labour let a firm lift output almost at once, so a higher price is met with more supply and PES is high.
- Factor mobility: inputs that are easy to obtain and switch let firms expand faster, raising PES, whereas specialised, immobile inputs hold it down.
- Stocks: goods that store well can be released straight from the warehouse without new production, raising PES, while perishables cannot, keeping PES low.
- A bakery with spare ovens can raise output within hours, giving a high PES.
- Fresh bread cannot be stored for long, so supply cannot be built up in advance and PES stays low.
Short and long run
Short run: the period when at least one factor of production is fixed, so output can only vary within existing capacity.
Long run: the period when all factors of production are variable, so firms can change capacity and enter or leave the market.
- Time ties the other factors together: the longer the period, the more these constraints ease, so PES rises with the time horizon.
- In the immediate run output is effectively fixed, so supply is perfectly or highly inelastic.
- Supply is therefore least elastic in the immediate run, more elastic in the short run and most elastic in the long run.
- After a surge in UK housing demand, builders cannot raise supply quickly because planning and construction take years, so short-run PES is low.
- Over the long run new estates are completed, capacity rises and supply becomes far more elastic.
Significance of time
- Why the time dimension matters: a low short-run PES lets shortages and price spikes persist, while a higher long-run PES lets output catch up and prices settle back.
- After a demand surge a firm may sell from stock at once, add shifts within months and build a new plant over years.
- Organise the determinants of PES around the time period, contrasting the immediate, short and long run.
- Define the short run as having at least one fixed factor and the long run as having all factors variable.
- Add spare capacity, factor mobility and stocks as supporting factors.
- Do not treat PES as a single fixed value, because it rises as the time horizon lengthens.
- Do not confuse the short run with a set number of months; it is defined by having at least one fixed factor, not a fixed length of time.
- Name four factors that influence the price elasticity of supply.
- How does spare capacity affect PES?
- What is the difference between the short run and the long run in economics?
- Why is supply more elastic in the long run than in the immediate run?
