Skip to content
MathsGenie logo
Quick links
Open app

Course home

  1. A Level
  2. Economics Edexcel A
  3. Question bank

1.1 Nature of economics

EasyMediumHard
12345678910111213141516171819202122232425262728293031323334353637383940414243444546474849505152535455565758596061626364656667
Question 66

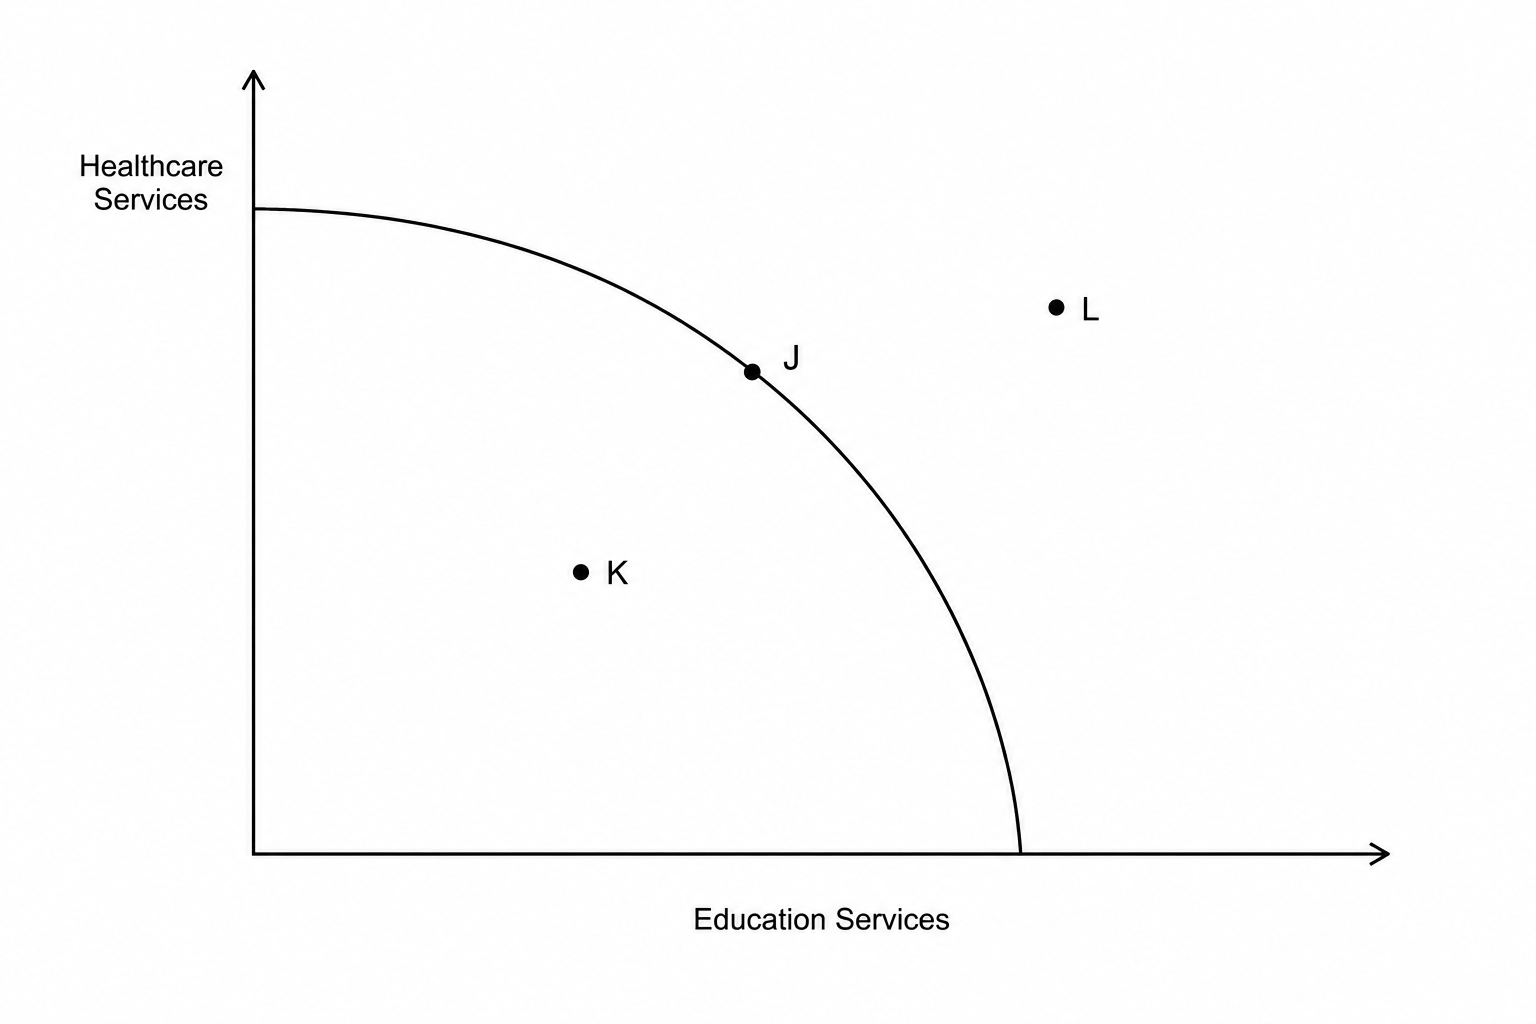
Using the diagram below, explain the impact on economic efficiency of producing at point K.

A Production Possibility Frontier (PPF) graph. The y-axis is labeled 'Healthcare Services' and the x-axis is labeled 'Education Services'. A downward-sloping, concave PPF curve shows the boundary of maximum production capacity. Point J lies directly on the curve, Point K lies inside (underneath) the PPF curve, and Point L lies outside (to the right of) the PPF curve.

[2]

1.1 Nature of economics Questions

  1. A Level
  2. /Economics
  3. /1.1 Nature of economics