2.1.2a Measuring inflation
Inflation and deflation
Inflation: a sustained rise in the general price level.
Deflation: a sustained fall in the general price level.
Disinflation: a fall in the rate of inflation, so prices still rise but more slowly.
Purchasing power: the quantity of goods and services a unit of money can buy.
- Inflation erodes the purchasing power of money: at 5% inflation, £100 buys only what about £95 bought a year earlier.
- Deflation is rarer but damaging: Japan suffered mild but persistent deflation from the late 1990s, and falling prices led households to delay spending, which held back demand and growth.
- Disinflation is like a car still speeding up but less fiercely, so prices keep rising more slowly.
- Deflation is like the car going into reverse, with the price level actually falling.
The CPI basket
Consumer Prices Index (CPI): the UK's main measure of inflation, tracking the price of a representative basket of household goods and services.
Weights: the share of typical household spending each item takes, so bigger spending categories move the index more.
- The ONS collects around 180,000 prices each month for a basket of roughly 700 goods and services.
- Each item is weighted by its share of spending, and the basket is revised annually so it stays representative as habits change.
Index numbers
Index number: a figure that expresses a value relative to a base, making changes over time easy to compare.
Base year: the reference year whose index is set to 100.
- The rate of inflation is the percentage change in the index over twelve months.
- An index of 103 means prices are 3% above the base year, not that the basket costs £103.
- The CPI rises from 100 to 102 over a year.
- That 2% matches the target the Bank of England is set for CPI inflation.
- At its 2022 peak, UK CPI inflation reached about 11.1%, far above target, as energy and food prices surged.
CPI limitations and RPI
Retail Prices Index (RPI): an older, alternative measure of inflation that includes some housing costs the CPI leaves out and uses a different calculation method.
- The basket can lag changes in spending habits, and it is hard to adjust fully for improvements in quality.
- A single national index does not fit every household, because spending patterns differ across income groups and regions.
- The RPI includes mortgage interest and other housing costs, so it usually reads a little higher than the CPI.
- Keep inflation, deflation and disinflation distinct, stressing that disinflation still means rising prices.
- Read an index number against the base year of 100 and find inflation as the percentage change.
- Do not confuse deflation, which is falling prices, with disinflation, which is slower inflation.
- Do not read an index number as a price in pounds, since it is relative to the base year.
- Define inflation, deflation and disinflation.
- How is the UK rate of inflation calculated using the CPI?
- Give two limitations of the CPI.
- How does the RPI differ from the CPI?
2.1.2b Causes and effects of inflation
Causes of inflation
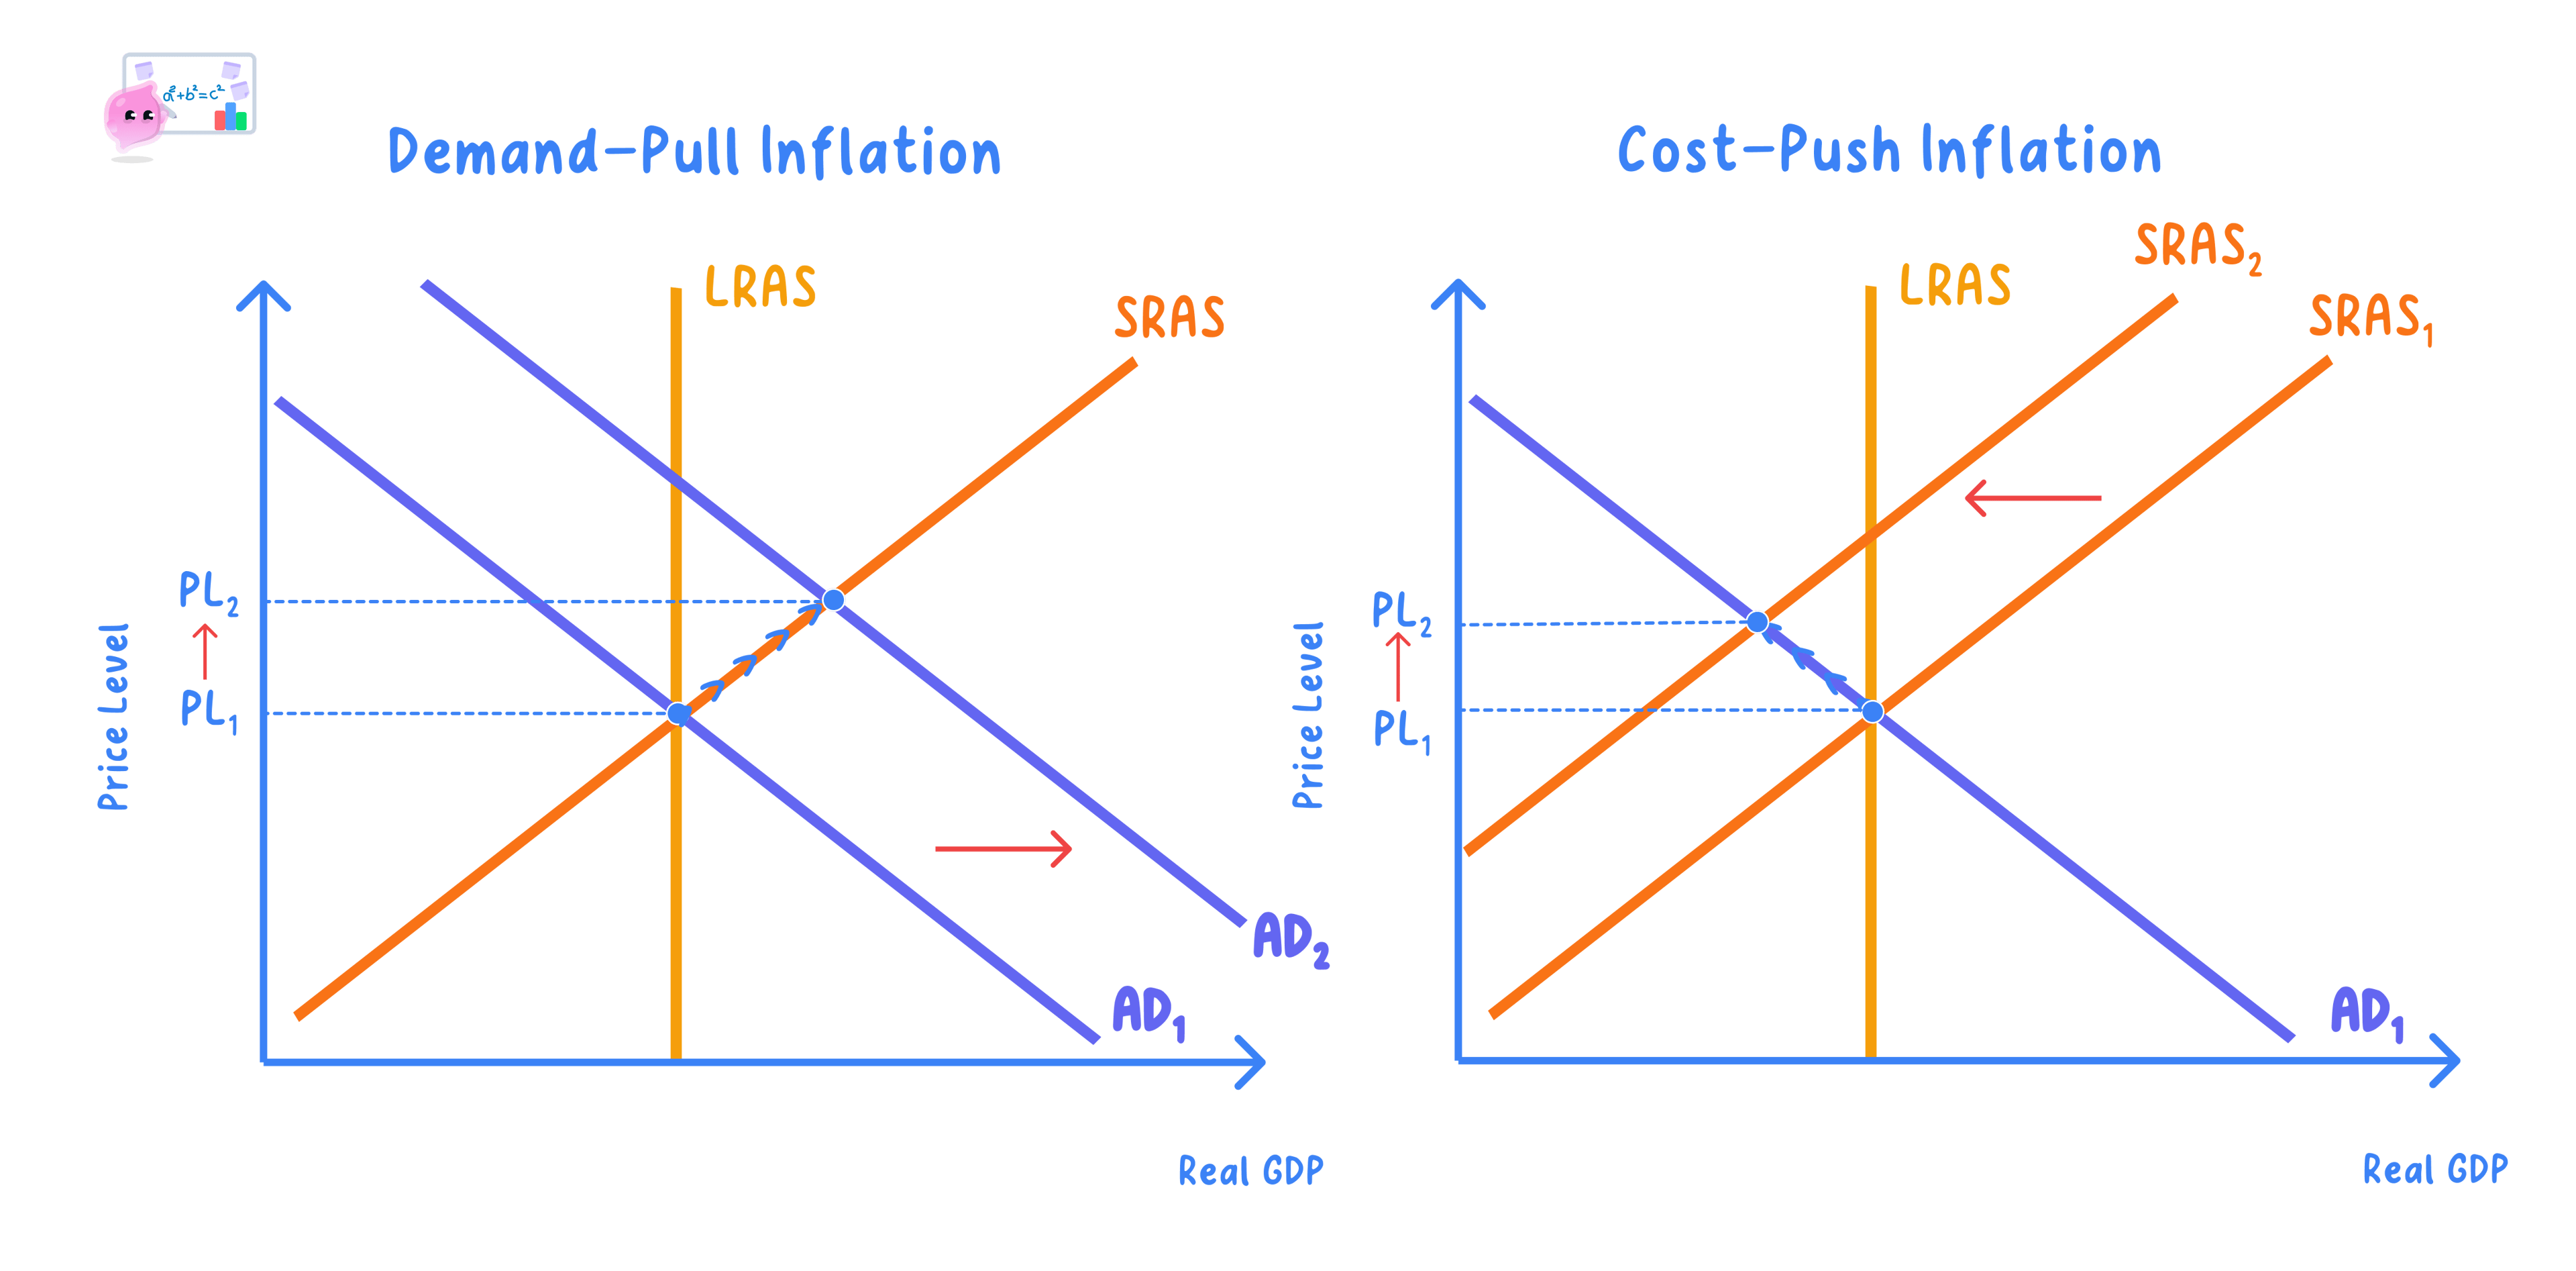
Demand-pull inflation: inflation caused by excess aggregate demand pulling prices up as the economy nears full capacity.
Cost-push inflation: inflation caused by rising costs of production pushing prices up.
- On an AD/AS diagram, demand-pull is a rightward shift of aggregate demand that raises the average price level.
- Cost-push is a leftward shift of short-run aggregate supply, driven by higher wages or imported costs such as energy.
- A consumer boom when the economy is near full capacity can drive demand-pull inflation.
- A sharp rise in world energy prices, as after Russia's 2022 invasion of Ukraine, can drive cost-push inflation.
Monetary causes
Money supply: the total stock of money circulating in the economy; excessive growth in it can fuel inflation.
- When the money supply grows faster than output can, spending outstrips the goods available and prices are bid up.
- Expectations of higher prices feed through into wage demands and can become self-fulfilling.
Effects of inflation
- Inflation erodes the real value of money and redistributes income between economic agents.
- Consumers lose purchasing power if their incomes rise more slowly than prices.
- Workers press for higher wages to protect their real pay, which can add to cost-push pressure.
- In extreme cases the costs become catastrophic: in Zimbabwe in 2008 and in Weimar Germany in 1923, hyperinflation running into millions of percent destroyed the value of money so fast that it stopped working as a store of value or medium of exchange.
- In 2022 UK CPI inflation reached around 11%, driven largely by higher energy and food prices.
- Households on fixed incomes lost purchasing power, while borrowers on fixed-rate debt saw its real value fall.
Winners and losers
Fiscal drag: inflation pushing incomes into higher tax bands when thresholds are frozen, raising government revenue.
Menu costs: the cost to firms of repricing goods and updating price lists as inflation rises.
- Firms face menu costs and greater uncertainty, which can deter investment and weaken international competitiveness.
- The government gains revenue through fiscal drag but pays more on index-linked benefits and debt.
- Savers and lenders lose as the real value of money falls, whereas borrowers gain as the real value of their debt shrinks.
- The scale of these effects depends on whether the inflation is anticipated and on how high the rate is:
Is inflation always harmful?
- It holds because high or accelerating inflation erodes purchasing power and creates uncertainty that deters investment and worsens competitiveness, hurting most agents.
- But low, stable and anticipated inflation around the 2% target does little damage and is preferred to deflation, which can trap an economy in falling demand and delayed spending.
- But the effects are uneven: borrowers and the government can gain while savers and those on fixed incomes lose, so inflation redistributes rather than simply destroying value.
- On balance, whether inflation is harmful depends on its rate, whether it is anticipated, and how quickly wages and interest rates adjust.
- Show demand-pull as a rightward AD shift and cost-push as a leftward AS shift, with average price level and real output on the axes.
- Split the effects by group: consumers, workers, firms and the government.
- Do not treat all inflation as equally harmful, since low and stable inflation differs from high or accelerating inflation.
- Do not assume everyone loses, because borrowers gain as the real value of debt falls.
- Name the three main causes of inflation.
- How is demand-pull inflation shown on an AD/AS diagram?
- How does inflation affect consumers and workers?
- Why do borrowers gain from unanticipated inflation?
