Skip to content
MathsGenie logo
Quick links
Open app

Course home

  1. A Level
  2. Economics Edexcel A
  3. Question bank

1.2.9 Indirect taxes and subsidies

EasyMediumHard
1234567891011121314151617181920212223
Question 22

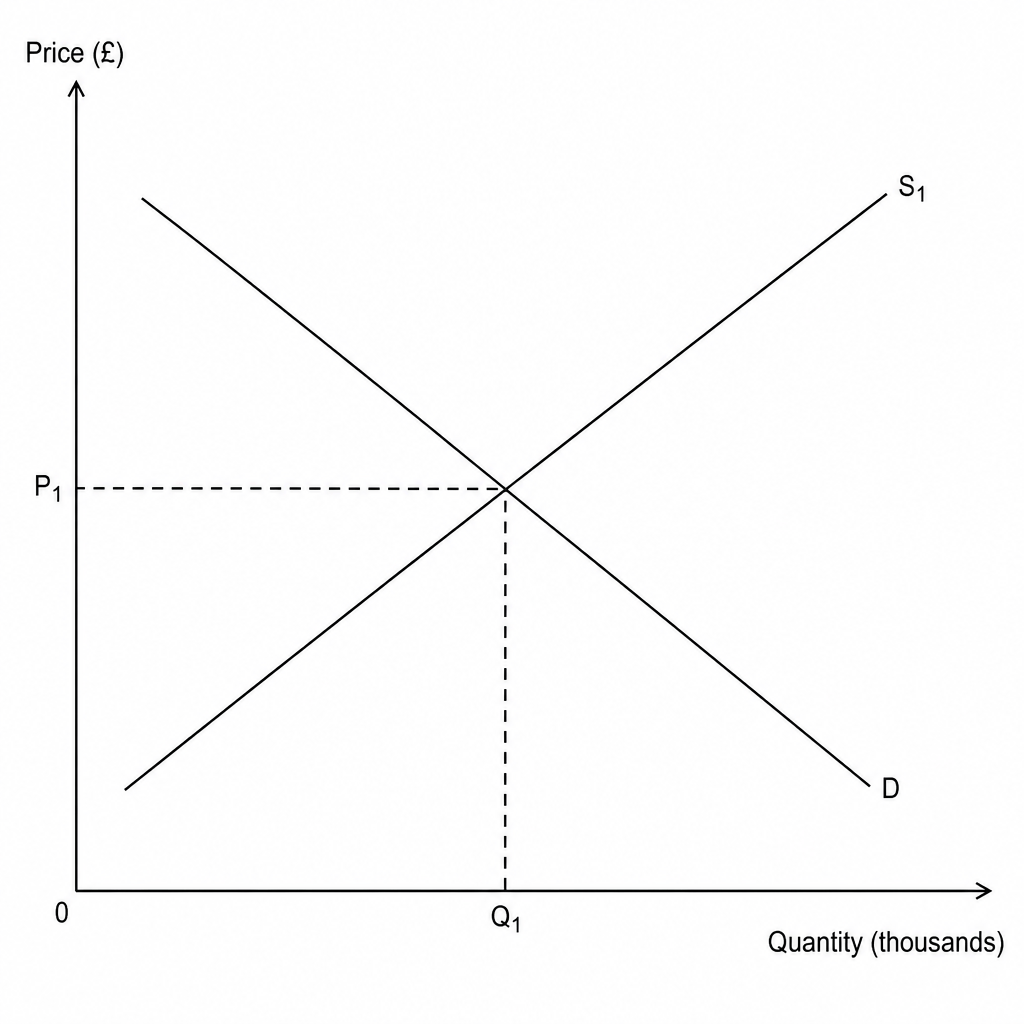
On the diagram below, annotate the effect of the introduction of a government unit subsidy on the market for residential heat pumps.

A demand and supply diagram for residential heat pumps. The vertical axis is labeled 'Price (£)' and has a price point 'P1' marked. The horizontal axis is labeled 'Quantity (thousands)' and has a quantity 'Q1' marked. There is a downward-sloping demand curve labeled 'D' and an upward-sloping supply curve labeled 'S1'. Dashed projection lines connect P1 and Q1 to the initial equilibrium point where D and S1 intersect. The origin is marked '0'.

[2]

1.2.9 Indirect taxes and subsidies Questions

  1. A Level
  2. /Economics
  3. /1.2.9 Indirect taxes and subsidies