Economies of Scale
Economies of scale: the cost advantages a firm gains as its scale of output rises in the long run, which lower long-run average cost (LRAC).
Diseconomies of scale: the cost disadvantages a firm faces when it grows too large, which raise long-run average cost.
- They can arise only in the long run, when every factor of production is variable and the firm can change the scale of its whole plant.
- Economies of scale reflect increasing returns to scale: output rises more than proportionately to inputs, so a given total cost is spread over more units and average cost falls.
- This is why cost per unit can fall even while total cost is rising, because output is rising faster than cost.
Internal economies of scale
Internal economies of scale: cost advantages that arise from the growth of the individual firm itself, so they depend on the firm's own size.
- Technical economies: larger, more productive machinery is spread over far more output, so its cost per unit falls.
- A large manufacturer such as Nissan at Sunderland runs an automated assembly line whose huge fixed cost is spread over hundreds of thousands of cars a year, cutting cost per unit well below that of a small-volume rival.
- Purchasing economies: buying inputs in bulk earns discounts that small rivals cannot obtain.
- A supermarket chain such as Tesco buys stock in bulk far more cheaply per item than a corner shop.
- Managerial economies: a larger firm can employ specialist managers whose expertise raises efficiency, and their salary is spread over more output.
- Financial economies: large firms are seen as lower risk, so they borrow more cheaply and can access more sources of finance.
- Marketing economies: the cost of one advertising campaign is spread over far more units of output.
- A car maker spreads the cost of a single national campaign over millions of vehicles.
- Risk-bearing economies: a larger firm can diversify across more products and markets, so a downturn in one area does less damage.
External economies of scale
External economies of scale: cost advantages that arise from the growth of the whole industry rather than the individual firm, so every firm in the industry benefits.
- When firms cluster together they gain a shared pool of skilled labour, specialist local suppliers and better dedicated infrastructure, each of which lowers costs for all of them.
- Financial firms clustered in the City of London draw on nearby legal, accounting and IT expertise; tech firms clustered near Cambridge share a local pool of engineers.
Diseconomies of scale
Internal diseconomies: rising average costs caused by the firm's own excessive size.
External diseconomies: rising average costs caused by the whole industry becoming too large.
- Internal diseconomies come from poor communication, harder coordination and weaker worker motivation, all of which reduce efficiency and so raise average cost.
- Managers in a very large firm can lose touch with the front line, slowing decisions and letting costs drift upward.
- External diseconomies come from industry over-expansion, as clustered firms bid up local wages and land prices and clog local transport, raising costs for everyone.
The long-run average cost curve
Long-run average cost (LRAC): the lowest cost per unit achievable at each level of output once every factor, including plant size, can be varied.
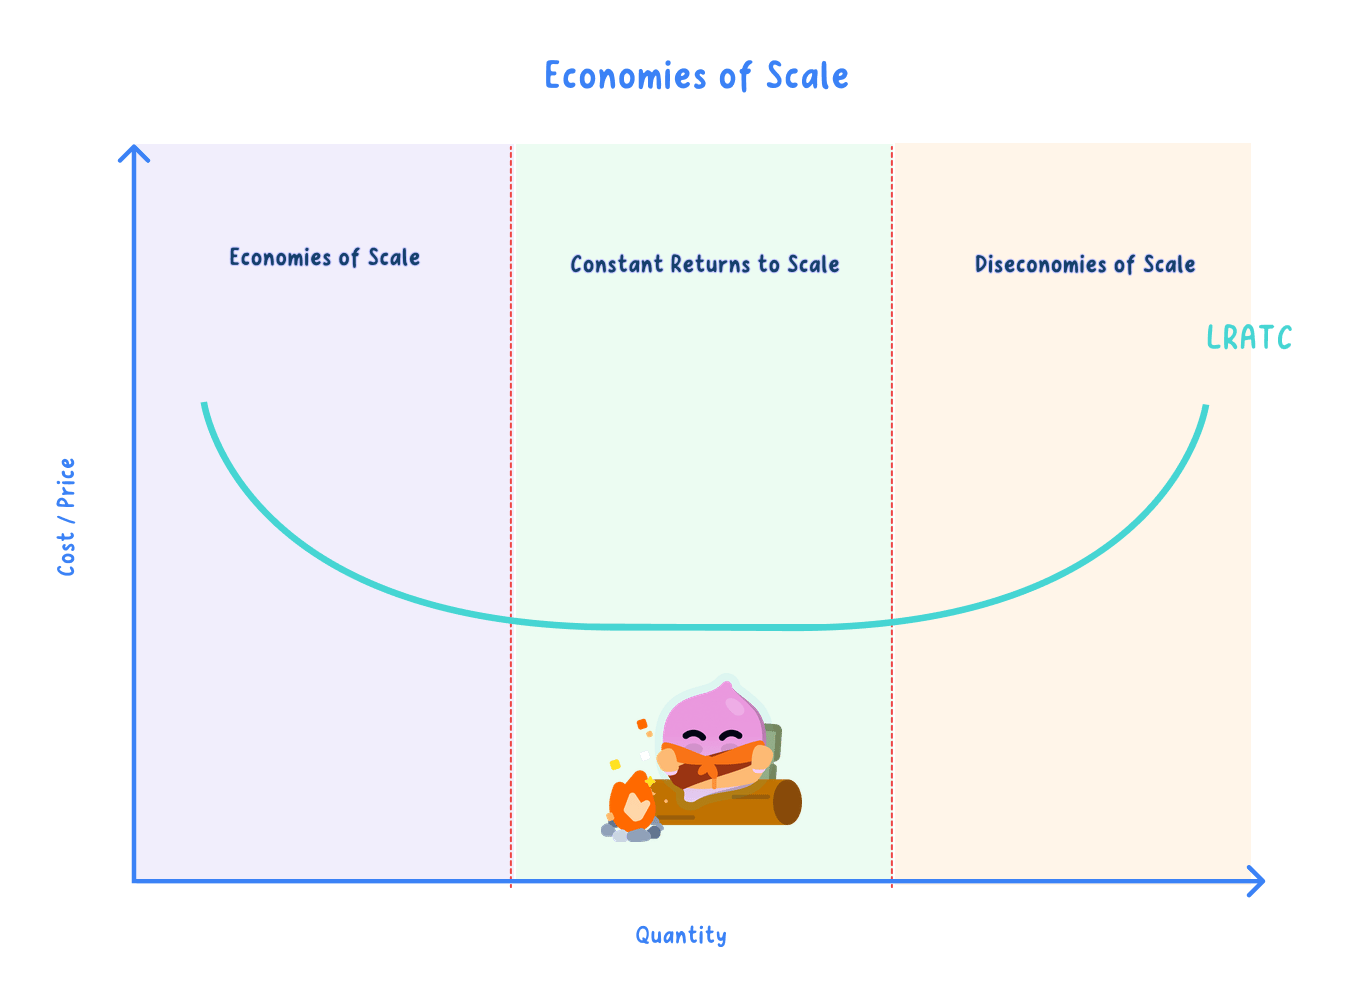
- On the diagram output is measured on the horizontal axis and cost per unit on the vertical axis.
- The curve slopes downward at first as economies of scale lower average cost, reaches a minimum, then may slope upward as diseconomies raise it, giving a U-shape.
- Many industries instead show an L-shaped curve, where average cost falls and then stays roughly constant because diseconomies are rare.
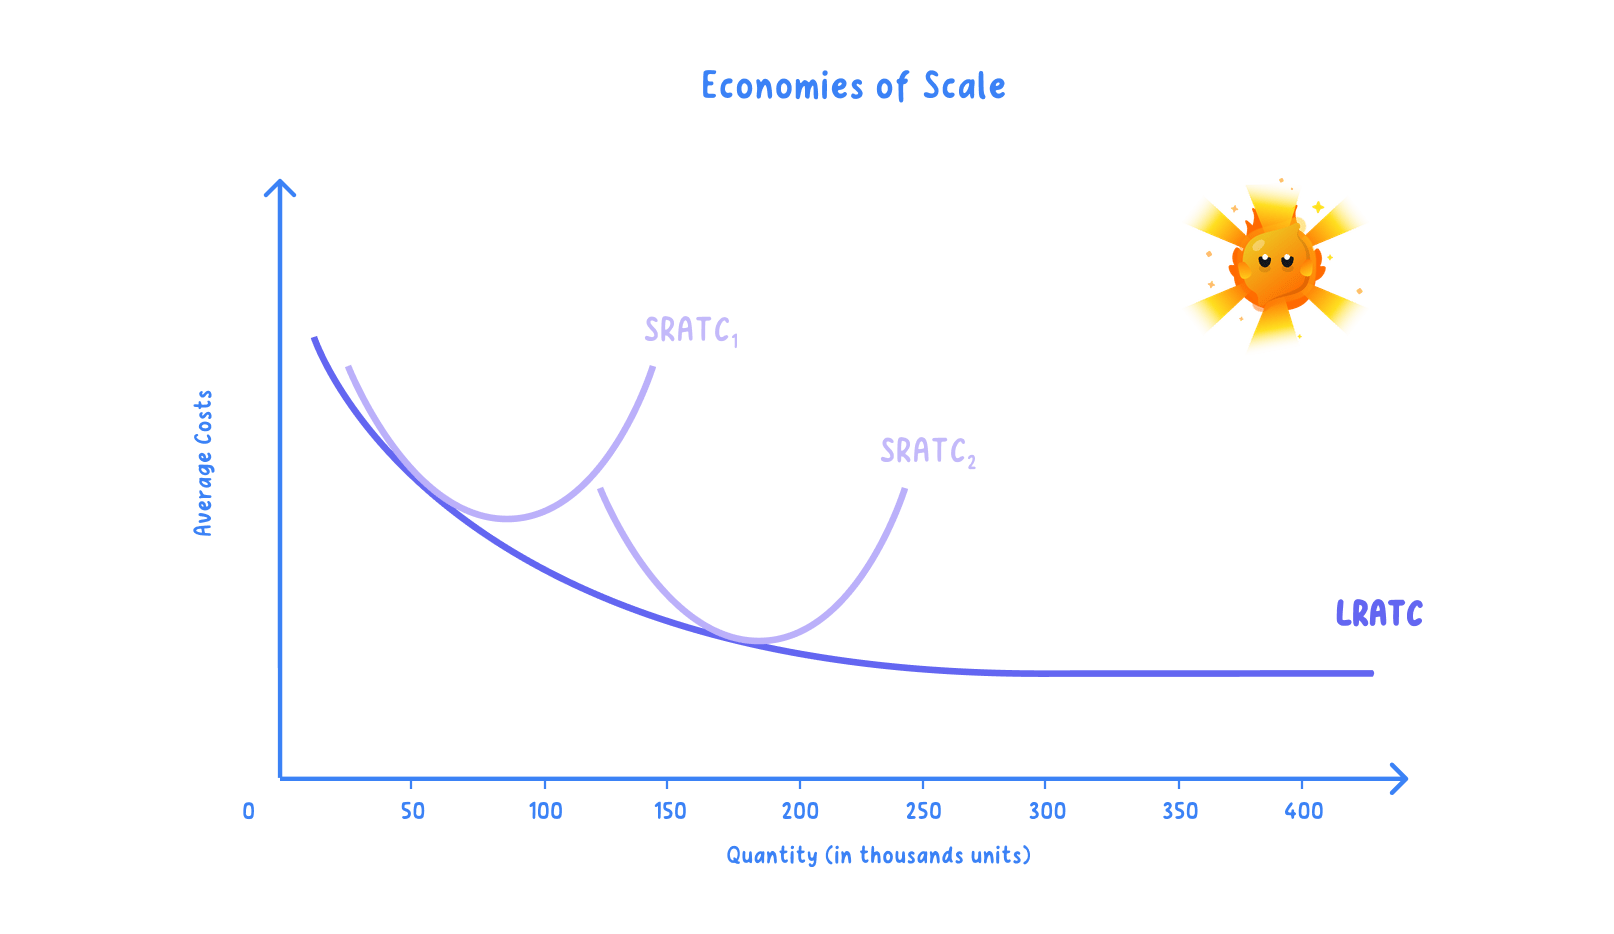
- The LRAC curve is the envelope of many short-run average cost (SRAC) curves, each drawn for one fixed plant size and just touching the LRAC.
- In the long run the firm can pick the plant size that puts it on the lowest possible SRAC for the output it wants.

Minimum efficient scale
Minimum efficient scale (MES): the lowest level of output at which a firm has exhausted its economies of scale and reaches its minimum long-run average cost.
- On the diagram it is the first output where LRAC reaches its minimum, or where an L-shaped curve first becomes constant.
- A firm producing below the MES pays higher average costs than larger rivals, so it is at a competitive disadvantage.
- Comparing the MES with total market demand explains how many firms a market can support.
- A low MES relative to demand allows many small firms, as in hairdressing.
- A high MES relative to demand supports only a few large firms, as in car manufacturing.
- A high MES therefore acts as a barrier to entry, because a new entrant must reach a large output just to match incumbents' costs.
Are economies of scale always beneficial?
- They can be a powerful advantage: moving down the LRAC lowers unit costs, which can fund lower prices, higher profit or more investment.
- But growth can go too far, because beyond the MES a firm risks diseconomies of scale, so bigger is not always cheaper.
- And the savings may not reach consumers, because a dominant firm can keep them as supernormal profit rather than cutting price.
- On balance it depends on how far below the MES the firm is, how competitive the market is, and whether the firm can manage its size without losing control.
- State whether an economy is internal or external before naming its source.
- Link each source to the falling or rising section of the LRAC curve.
- Compare the MES with total market demand to judge how many firms a market can support.
- Do not confuse diseconomies of scale, which are long-run, with short-run diminishing returns.
- Do not confuse economies of scale with a fall in total cost, as they lower cost per unit.
- Do not assume a larger firm always means lower prices, as savings may be kept as profit.
- Distinguish internal from external economies of scale.
- Name three internal economies of scale.
- What causes diseconomies of scale?
- Define minimum efficient scale.
- How does the LRAC curve relate to short-run cost curves?
