With reference to Figure 2 and Extract A, explain two likely reasons why the growth of Canada's real GDP per capita at PPPs was slower than that of Australia after 2015.
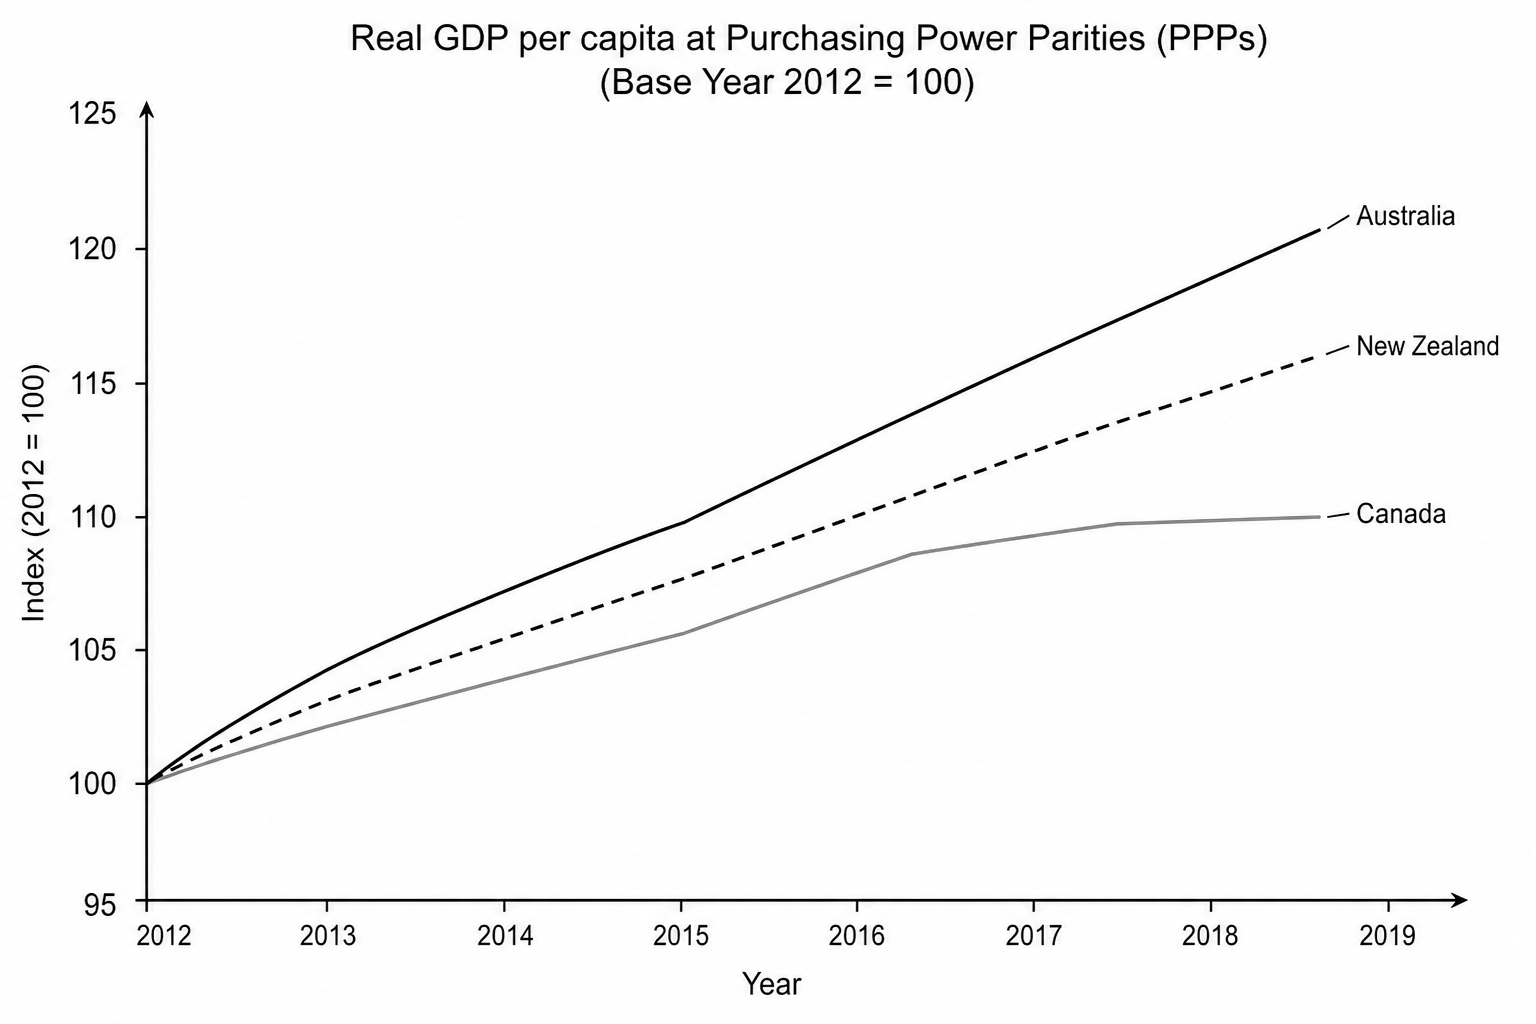
| Year | New Zealand (Dashed) | Australia (Solid Black) | Canada (Solid Grey) |
|---|---|---|---|
| 2012 | 100 | 100 | 100 |
| 2013 | 102 | 103 | 102 |
| 2014 | 105 | 106 | 104 |
| 2015 | 107 | 109 | 105 |
| 2016 | 110 | 112 | 106 |
| 2017 | 112 | 115 | 108 |
| 2018 | 114 | 118 | 109 |
| 2019 | 116 | 121 | 110 |
In late 2018, the Department of Finance noted that while Canada's overall GDP growth had rebounded, underlying structural issues remained.
While absolute GDP growth has occasionally shown resilience, underlying performance per capita has been disappointing. Unemployment rates dropped to historic lows, but business productivity and private capital investment failed to follow.
Several macroeconomic concerns persist. The current account balance remains deeply in deficit, driven by a structural decline in national resource competitiveness and weak non-resource export growth. In 2015, the federal government set an ambitious target to expand non-resource high-tech and service exports by 6% annually. However, actual export growth has struggled at just 2.1% per year. The manufacturing sector in the eastern provinces has also failed to recover, with total output remaining 5.2% below its pre-2014 resource peak.
Furthermore, high domestic household debt is a growing risk. The household debt-to-income ratio is projected to rise by 18 percentage points over the medium term, driven by high mortgage values in metropolitan regions. This high debt burden risks dragging down consumer spending in the long run.
Crucial to Canada's slower growth trajectory is its persistent productivity gap. In 2018, Canada’s labour productivity remained nearly 15 percentage points below the average of other leading resource-rich economies like Australia. Addressing this will require structural policy shifts: streamlining inter-provincial trade corridors, reforming capital depreciation taxes to encourage business R&D, and implementing aggressive skills retraining programs in technical and manufacturing fields.

