A Minimum Wage Is a Price Floor Above the Equilibrium Wage
Definition
National Minimum Wage: a legally enforced minimum hourly wage rate that employers must pay, set above the market equilibrium wage in order to raise the pay of low-paid workers.
- A national minimum wage is a price floor set above the equilibrium wage.
- In a competitive market, a binding floor can create excess supply of labour.
- In a monopsony, it can raise both the wage and employment.
Note
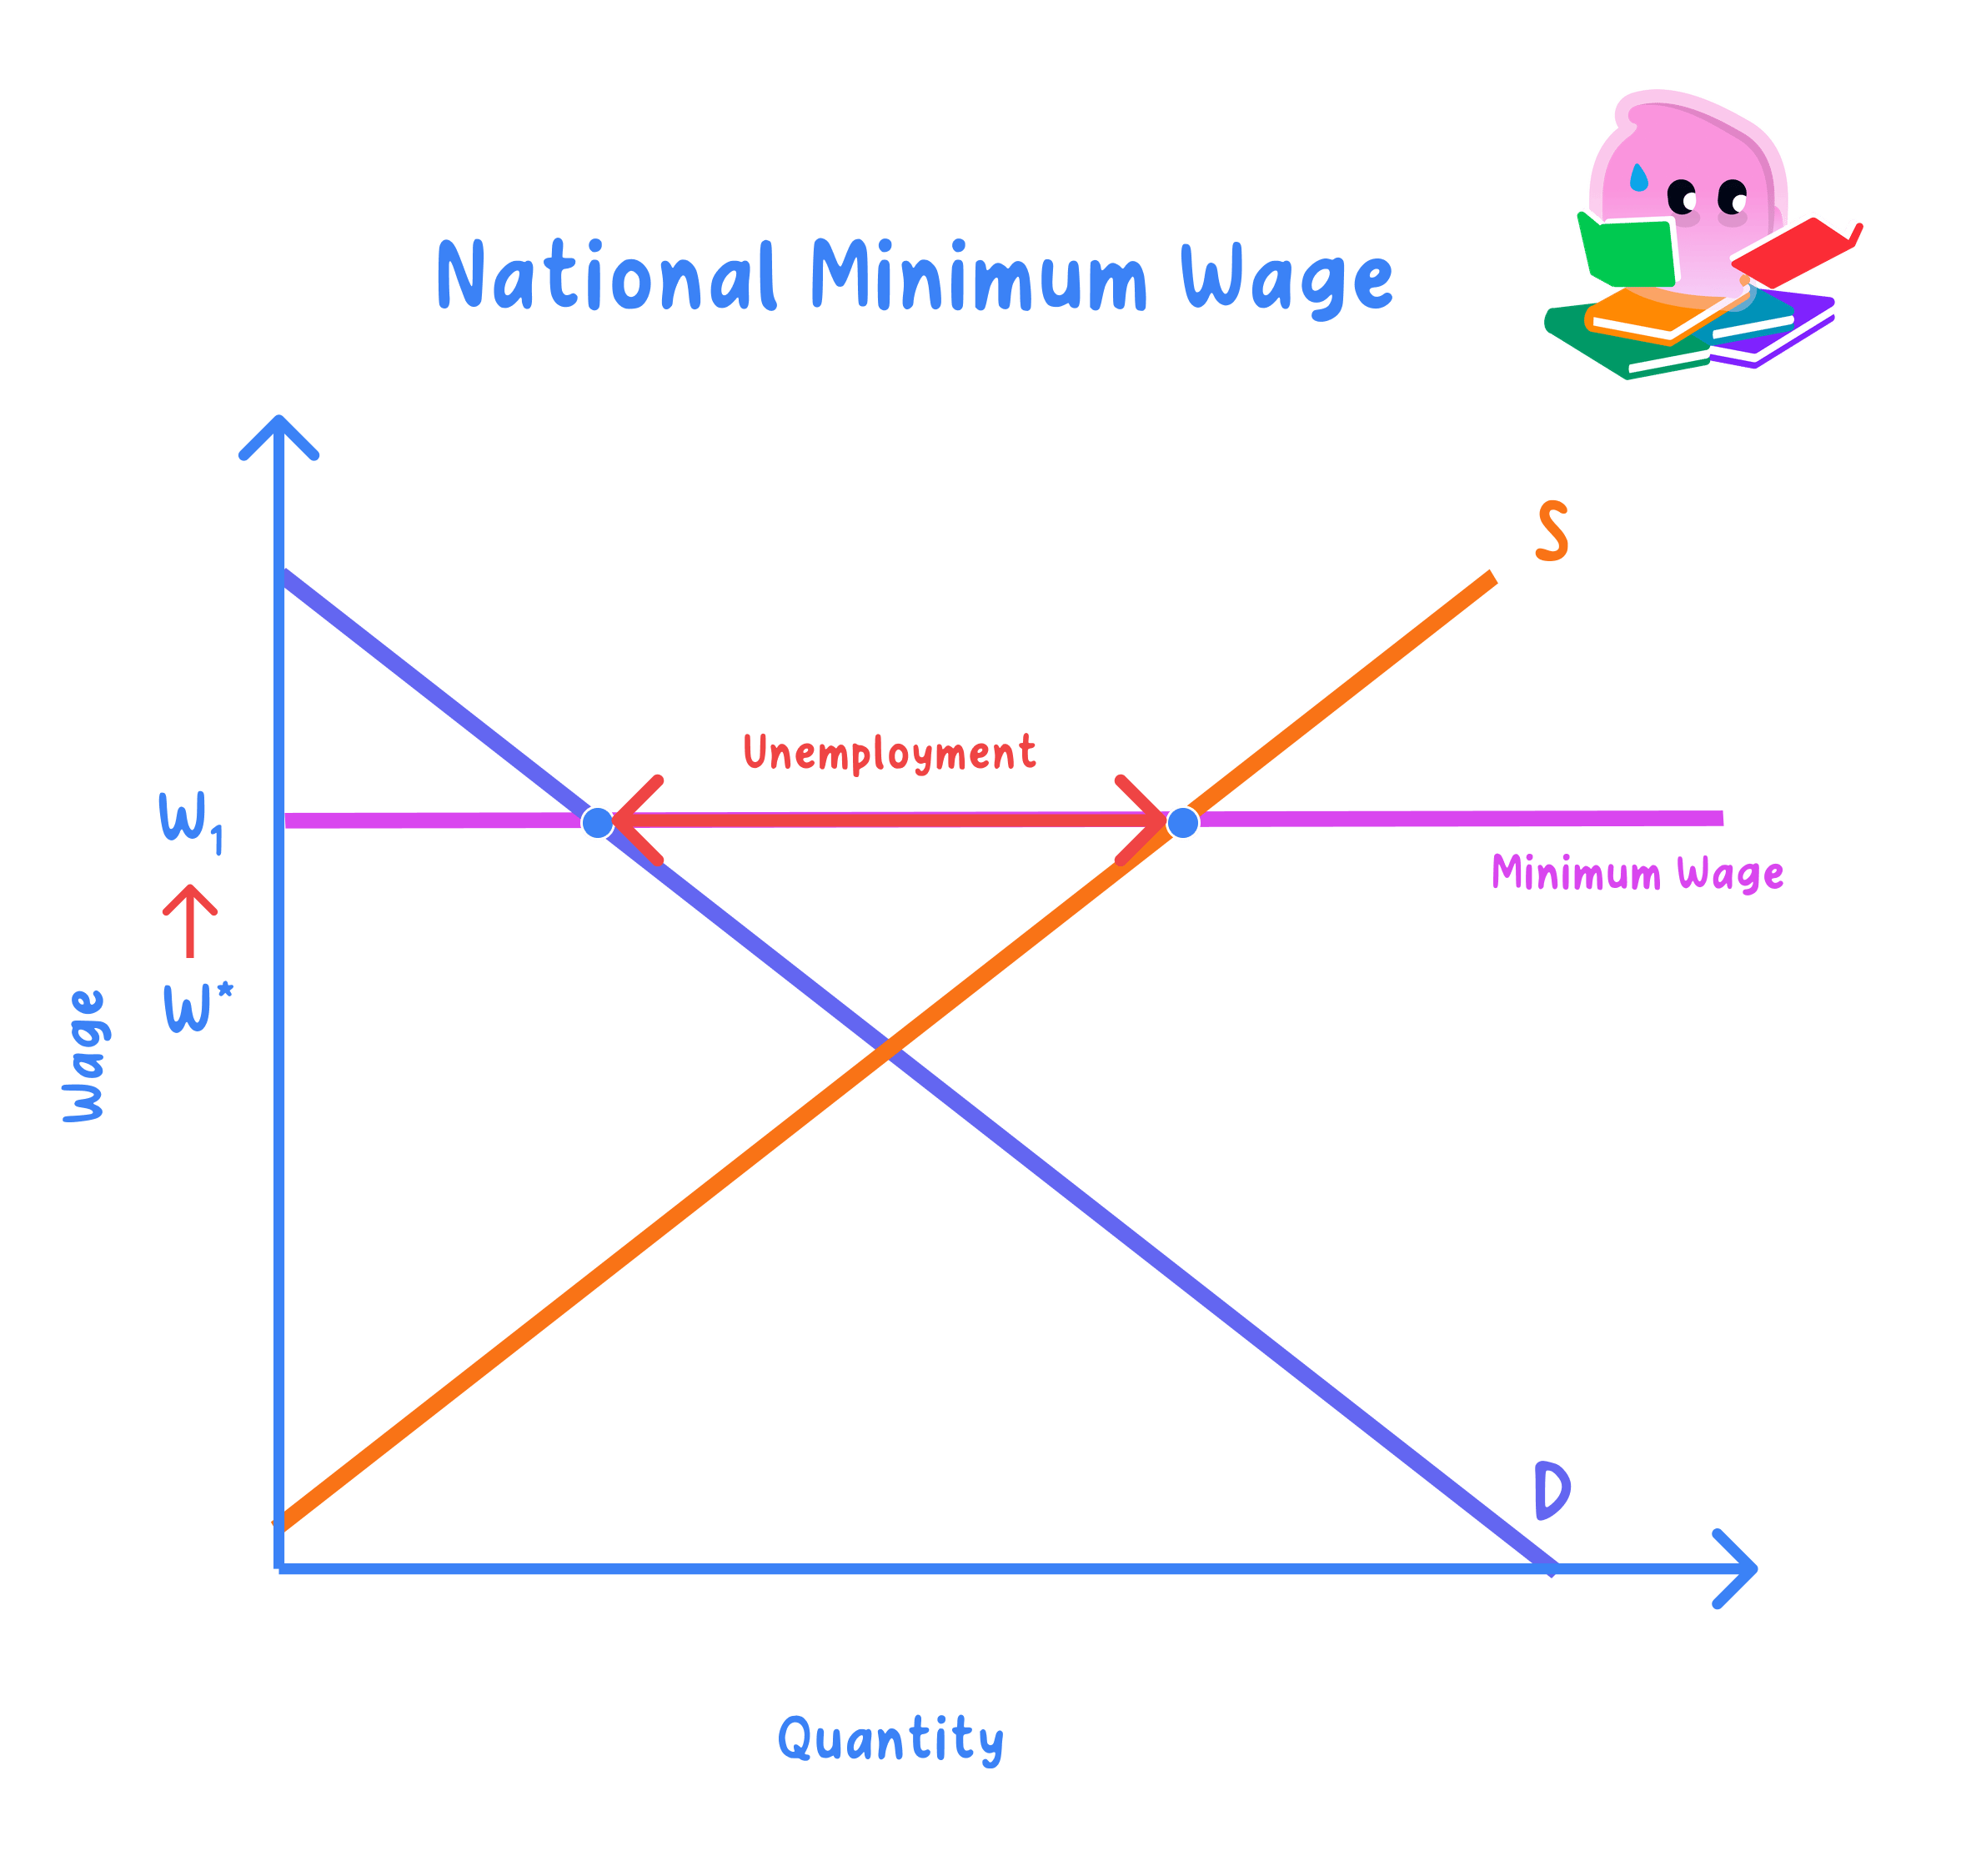
- In competition, a wage above equilibrium can cause unemployment.
- In monopsony, a minimum wage can lift the wage and employment together.
The Effect Differs in Competitive and Monopsony Markets
- In a competitive market, the floor leaves supply above demand, so jobs are lost.
- The size of any job loss depends on the elasticity of labour demand.
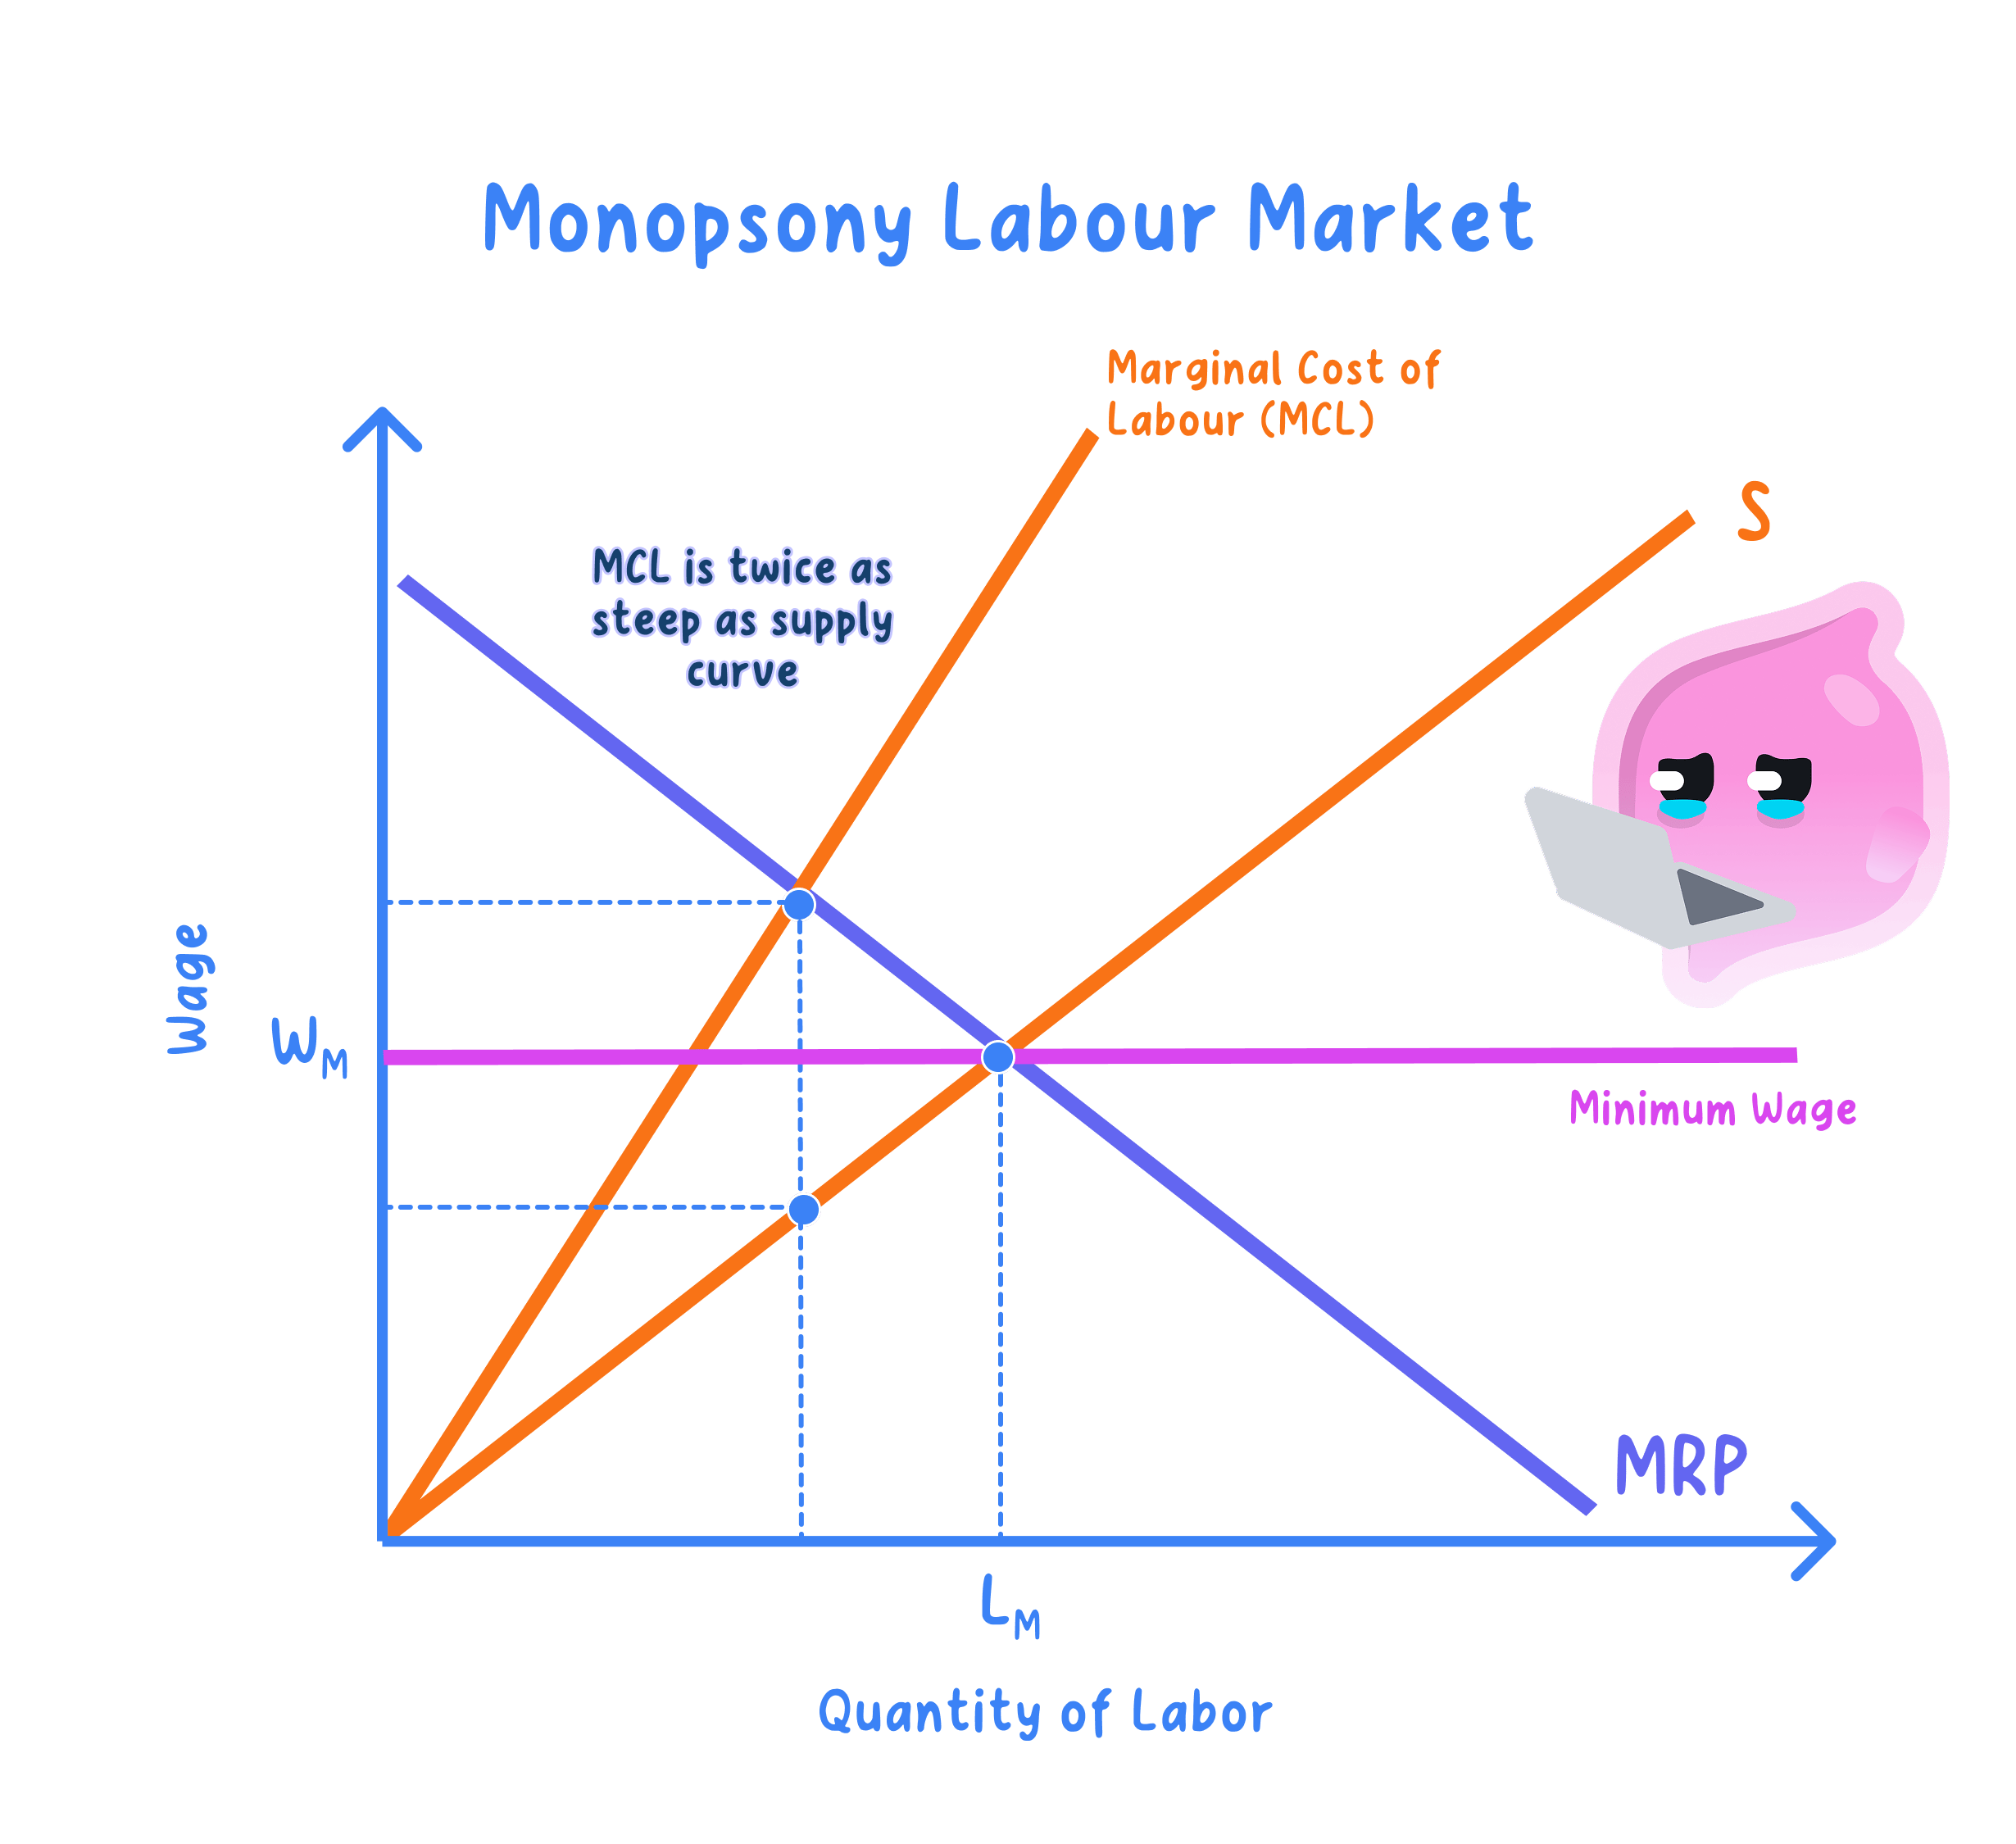
- In a monopsony, the floor can offset the employer's wage-cutting power.
Example
- The UK National Living Wage sets a legal floor on hourly pay.
- Where one employer dominates, that floor can raise both pay and jobs.
Whether a Minimum Wage Costs Jobs Depends on the Market
- For: it can cut poverty, sharpen incentives and raise productivity.
- Against: it may cost jobs, raise costs and add cost-push pressure.
- The employment effect turns on labour demand elasticity and market structure.
- On balance, a minimum wage need not raise unemployment, and its effect depends on elasticity and whether the market is competitive or monopsonistic.
Draw Both Market Types
Exam technique
- Show the competitive floor with excess supply, then the monopsony case.
- Tie the employment effect to labour demand elasticity.
Worked Example: A Minimum Wage in a Competitive Market
- In a competitive local market for cafe staff, the equilibrium wage is £9\pounds 9£9/hour with 10,00010{,}00010,000 workers employed.
- The government sets a minimum wage of £11\pounds 11£11/hour, above equilibrium.
- At £11\pounds 11£11/hour, cafes move up their demand curve and cut the quantity of labour demanded to 9,0009{,}0009,000, a loss of 1,0001{,}0001,000 jobs (10%10\%10%).
- At the same wage, more workers want jobs, so quantity supplied rises to 11,00011{,}00011,000.
- The excess supply of labour =11,000−9,000== 11{,}000 - 9{,}000 ==11,000−9,000= 2,0002{,}0002,000 workers who want a job at £11\pounds 11£11/hour but cannot find one, i.e. classical unemployment.
Worked Example: A Minimum Wage Against a Monopsony Employer
- A regional care home group is the dominant local employer of care workers, a monopsonist paying £9\pounds 9£9/hour and employing 8,0008{,}0008,000 staff.
- The competitive wage and employment level, where supply would meet demand in this market, is £11\pounds 11£11/hour and 9,5009{,}5009,500 staff.
- The government sets the minimum wage at £11\pounds 11£11/hour, matching the competitive rate.
- The employer must now pay £11\pounds 11£11/hour to hire any worker, so its incentive to restrict hiring in order to hold down the wage bill disappears; employment rises to 9,5009{,}5009,500 as it hires up to where the new horizontal wage floor meets MRP.
- Both the wage (£9→£11\pounds 9 \rightarrow \pounds 11£9→£11) and employment (8,000→9,5008{,}000 \rightarrow 9{,}5008,000→9,500) rise together, the opposite of the competitive-market result above.
Example
- If the government instead set the minimum wage at £13\pounds 13£13/hour, above the £11\pounds 11£11 competitive rate, the care home group would move up its MRP (demand) curve and cut employment back below 9,5009{,}5009,500, exactly as in the competitive case.
- So a minimum wage only raises both pay and jobs against a monopsonist up to the competitive wage; set higher, it costs jobs in either market structure.
Describing the Two Minimum Wage Diagrams
- Competitive market diagram: axes show the wage rate (W) vertically and quantity of labour (QL) horizontally; the downward-sloping demand curve (D) and upward-sloping supply curve (S) cross at the equilibrium wage We and quantity Qe.
- Draw a horizontal minimum wage line above We; where it crosses D gives the (lower) quantity demanded, and where it crosses S gives the (higher) quantity supplied.
- Shade or bracket the horizontal gap between these two points at the minimum wage line: this is the excess supply of labour, i.e. unemployment caused by the floor.
- Monopsony diagram: draw the upward-sloping supply curve (S), a steeper marginal cost of labour curve (MCL) above it, and the downward-sloping demand curve (D = MRP); without intervention, employment is where MCL meets MRP, with the wage read down to S, below the competitive wage.
- Add a horizontal minimum wage line at the competitive wage (where S would cross D): from the point it meets S, it becomes the new effective supply and MCL curve, and the original upward-sloping S and MCL resume only beyond that point.
- Employment rises to where this new horizontal segment meets MRP, at the competitive quantity; if the minimum wage line were drawn higher still, it would cross MRP further left, at a lower quantity, showing job losses even in monopsony once the floor is set too high.
Common Mistake
- Do not claim a minimum wage always raises unemployment.
- In a monopsony it can raise both the wage and employment.
Case study
- The UK's Low Pay Commission recommends annual National Living Wage and National Minimum Wage rates using exactly this evidence base, monitoring employment in low-paying sectors such as retail, hospitality and care.
- Since the National Minimum Wage began in 1999 and was extended into the higher National Living Wage from 2016, studies have generally found only small negative effects on employment, consistent with many low-paying UK employers (e.g. large care providers or dominant local employers) having some monopsony power rather than operating in a fully competitive market.
Self review
- What is a national minimum wage?
- Why can it cause unemployment in a competitive market?
- Why can it raise employment in a monopsony?
- What does the employment effect depend on, and what are its main advantages and disadvantages?
- In the cafe worked example, recalculate the excess supply of labour if quantity demanded fell to 9,2009{,}2009,200 and quantity supplied rose to 10,80010{,}80010,800 at the £11\pounds 11£11 floor.
- Using the care home worked example, explain why a £11\pounds 11£11 minimum wage raises both pay and jobs, but a £13\pounds 13£13 minimum wage would not.
- Describe, in words, how the minimum wage line changes the effective supply and MCL curves in the monopsony diagram, and how the competitive diagram shows the resulting excess supply.
