The Production Possibility Frontier: Mapping What an Economy Can Make
Definition
Production possibility frontier: a curve showing the maximum combinations of two goods or types of good that an economy can produce when all its resources are used fully and efficiently, given the existing state of technology.
- A production possibility frontier (PPF) shows the maximum combinations of two goods an economy can produce with its current resources and technology.
- It puts one good on each axis and draws the boundary of what is achievable.
- In a single diagram it captures scarcity, choice, opportunity cost and efficiency.
Note
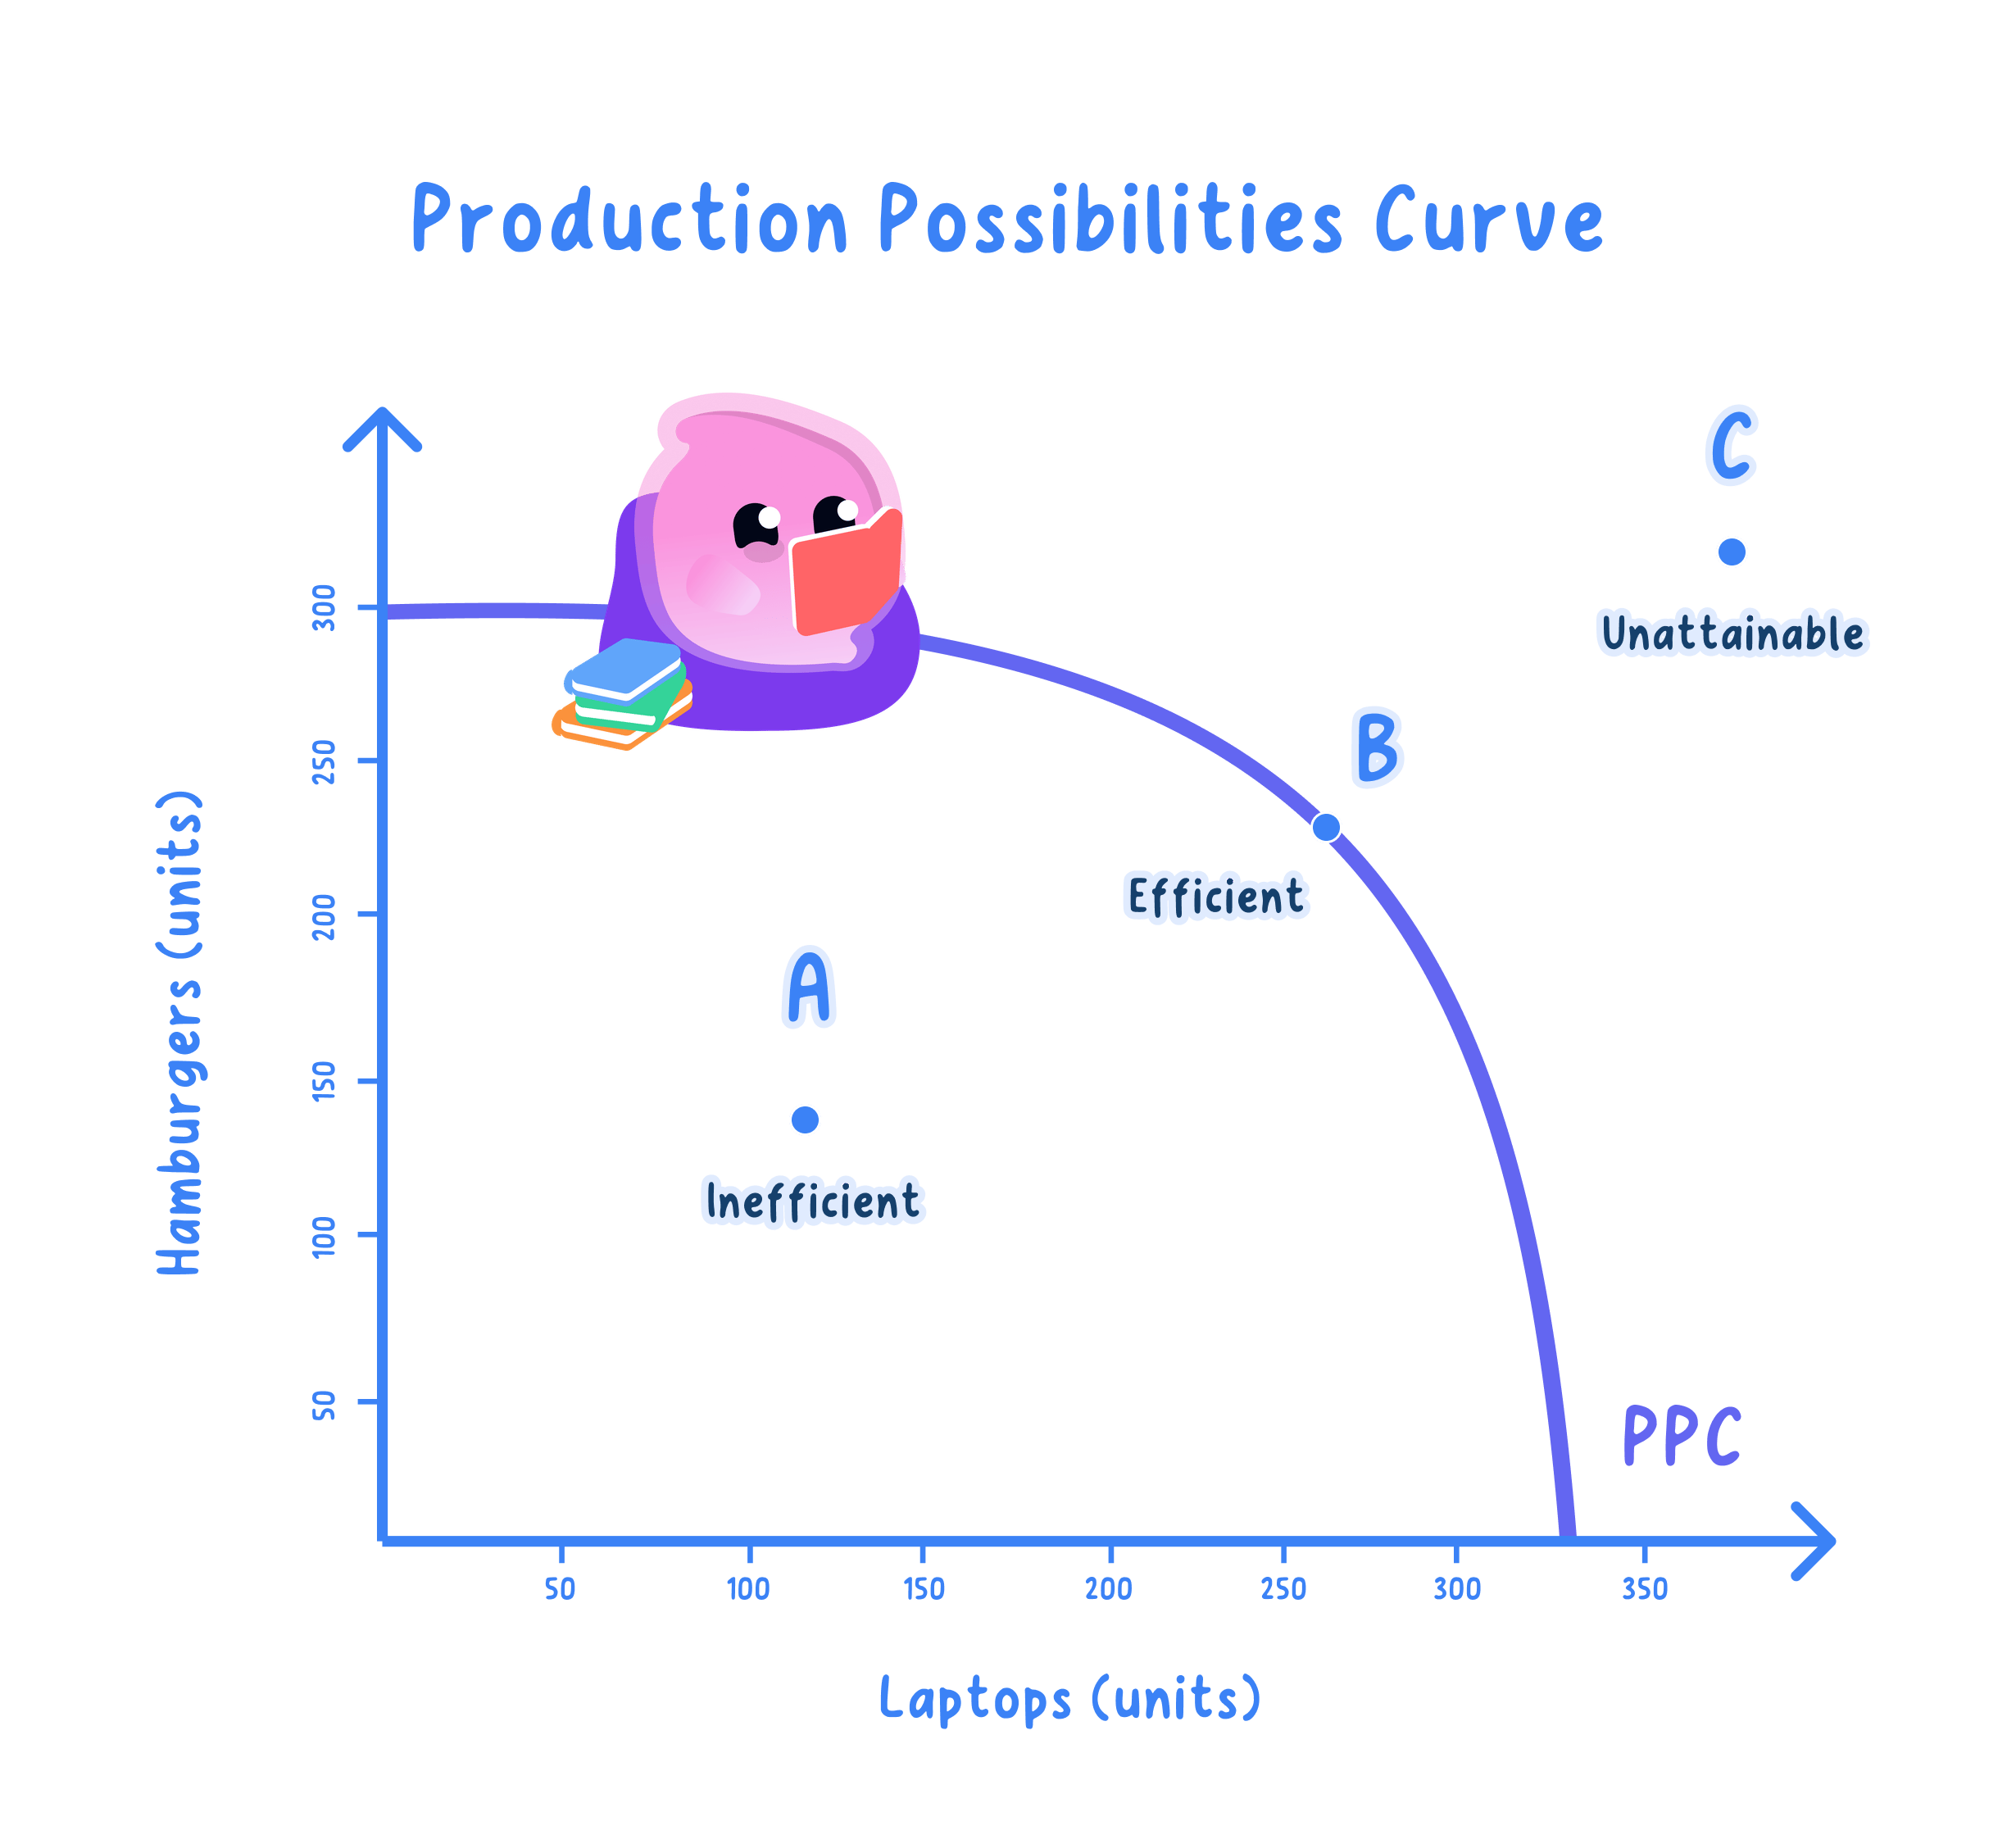
- Points on the frontier use all resources fully and are productively efficient.
- Points inside show unused or wasted resources, while points beyond are currently unattainable.
What the PPF Shows: Capacity, Cost and Efficiency
- Maximum potential output
- The frontier is the limit of what current resources and technology allow.
- Opportunity cost
- Moving along the curve to make more of one good means making less of the other.
- Efficiency and waste
- Producing on the curve is efficient, while producing inside it means spare capacity.
- A point beyond the frontier is not merely inefficient; it cannot be reached with today's resources.
Note
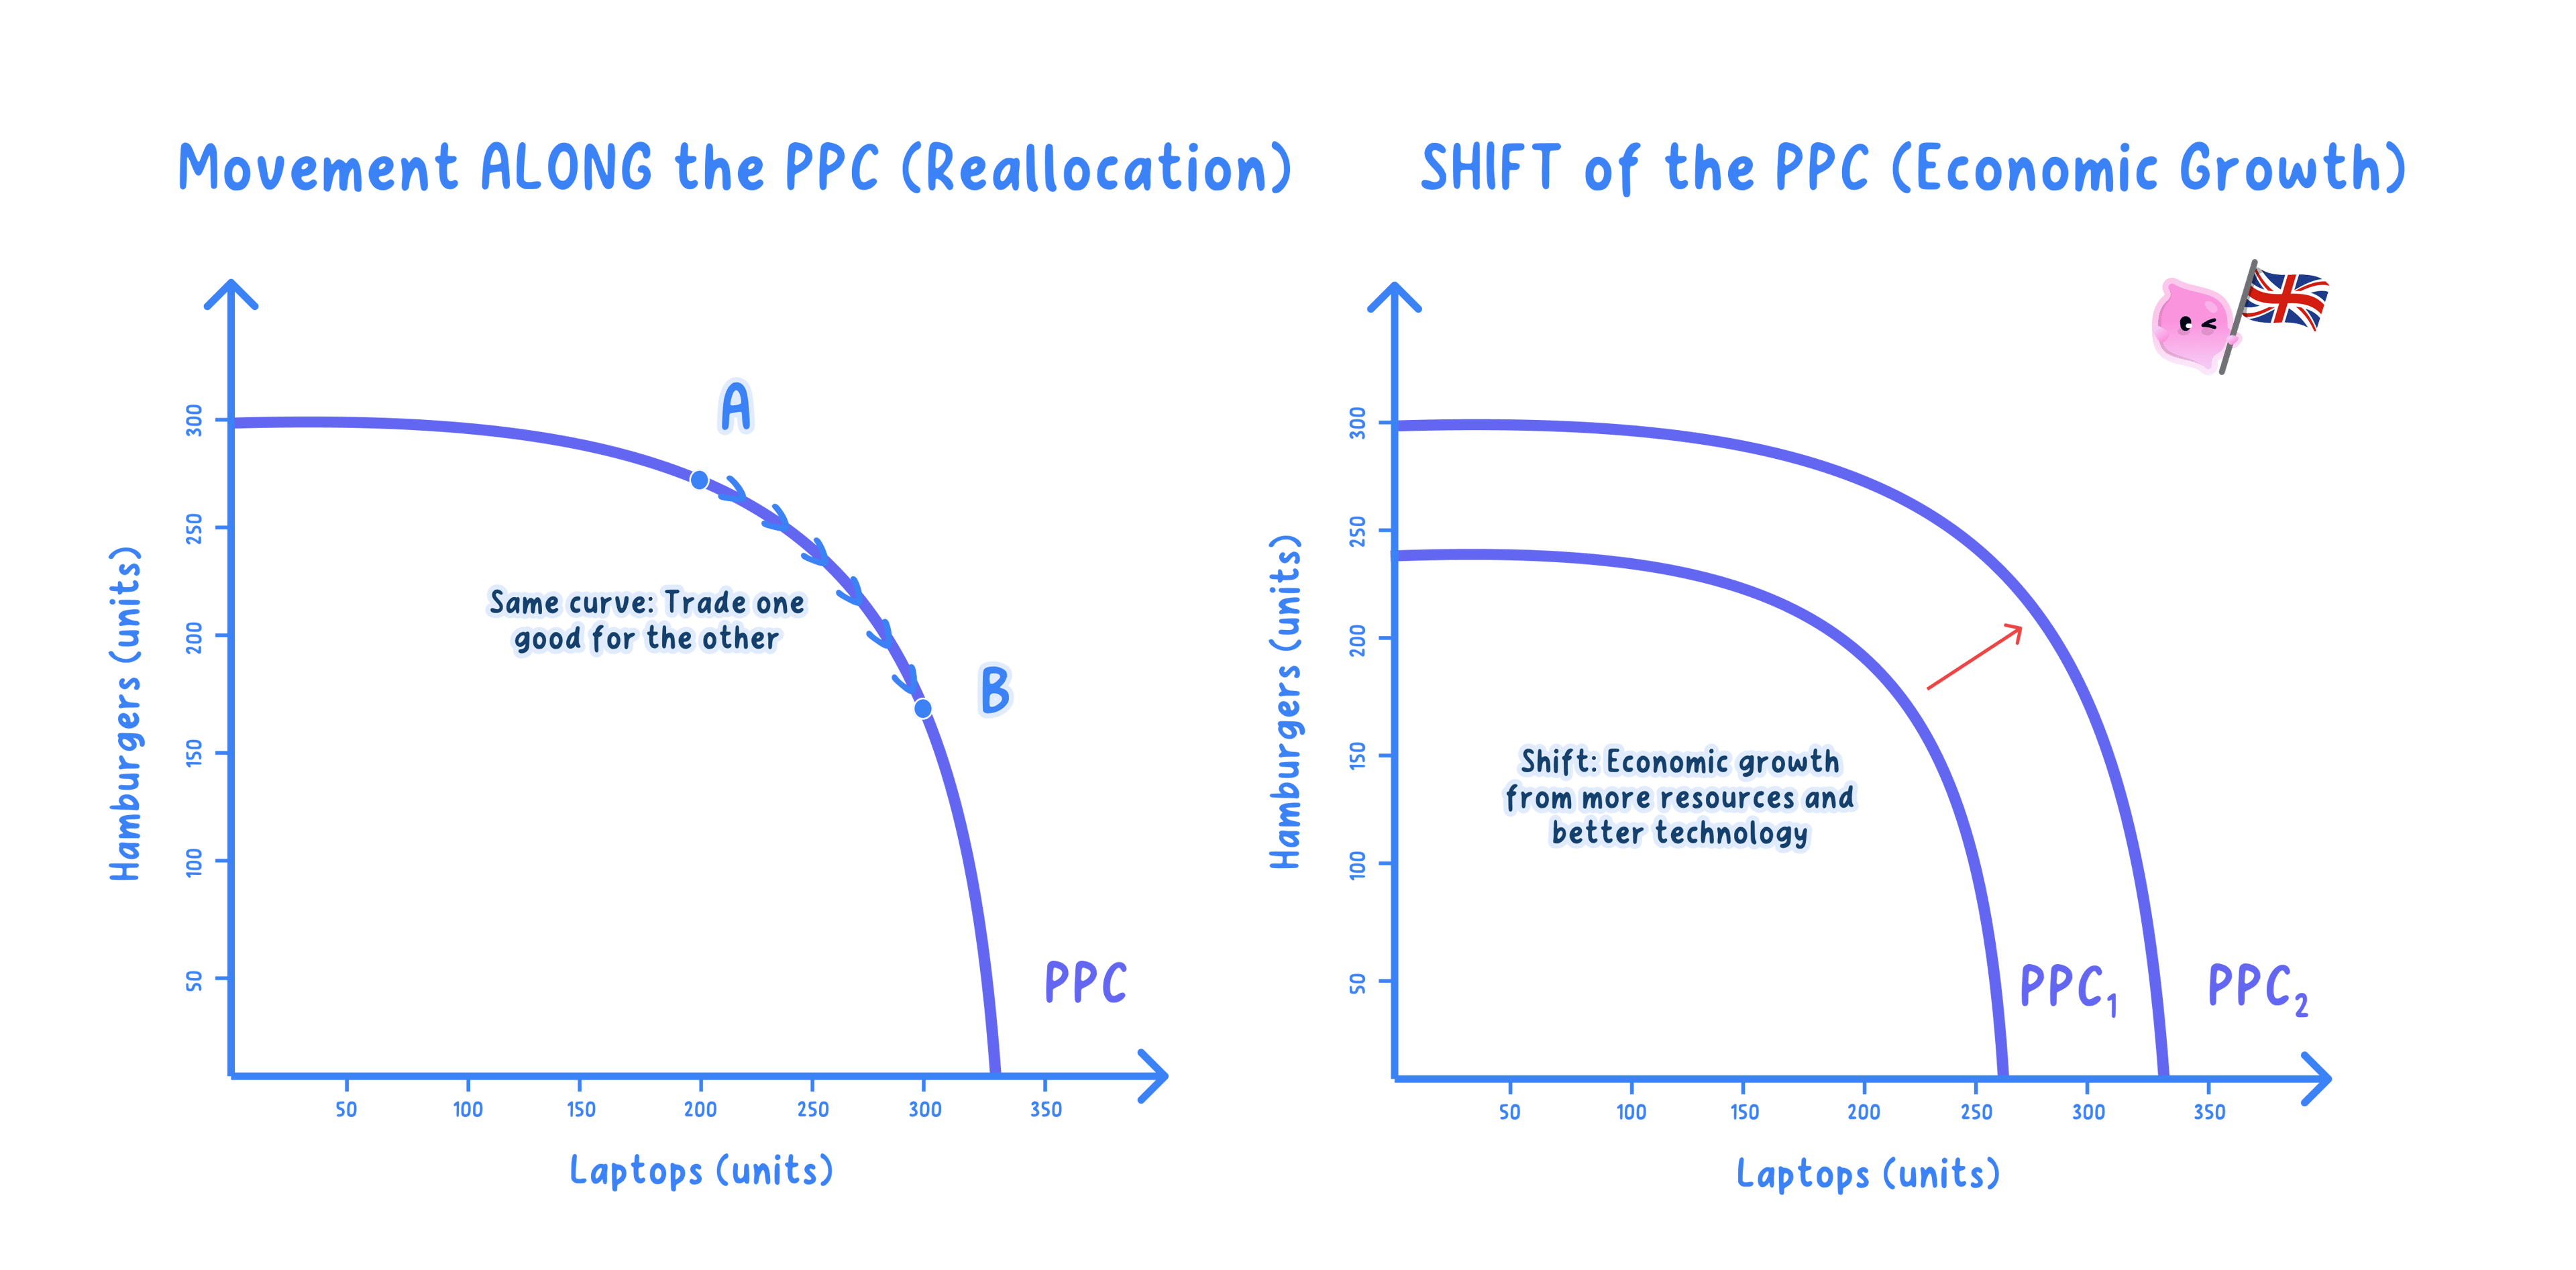
- Reaching it would require growth, which shifts the whole frontier outward.
Worked Example: Opportunity Cost Rises as You Move Along the PPF
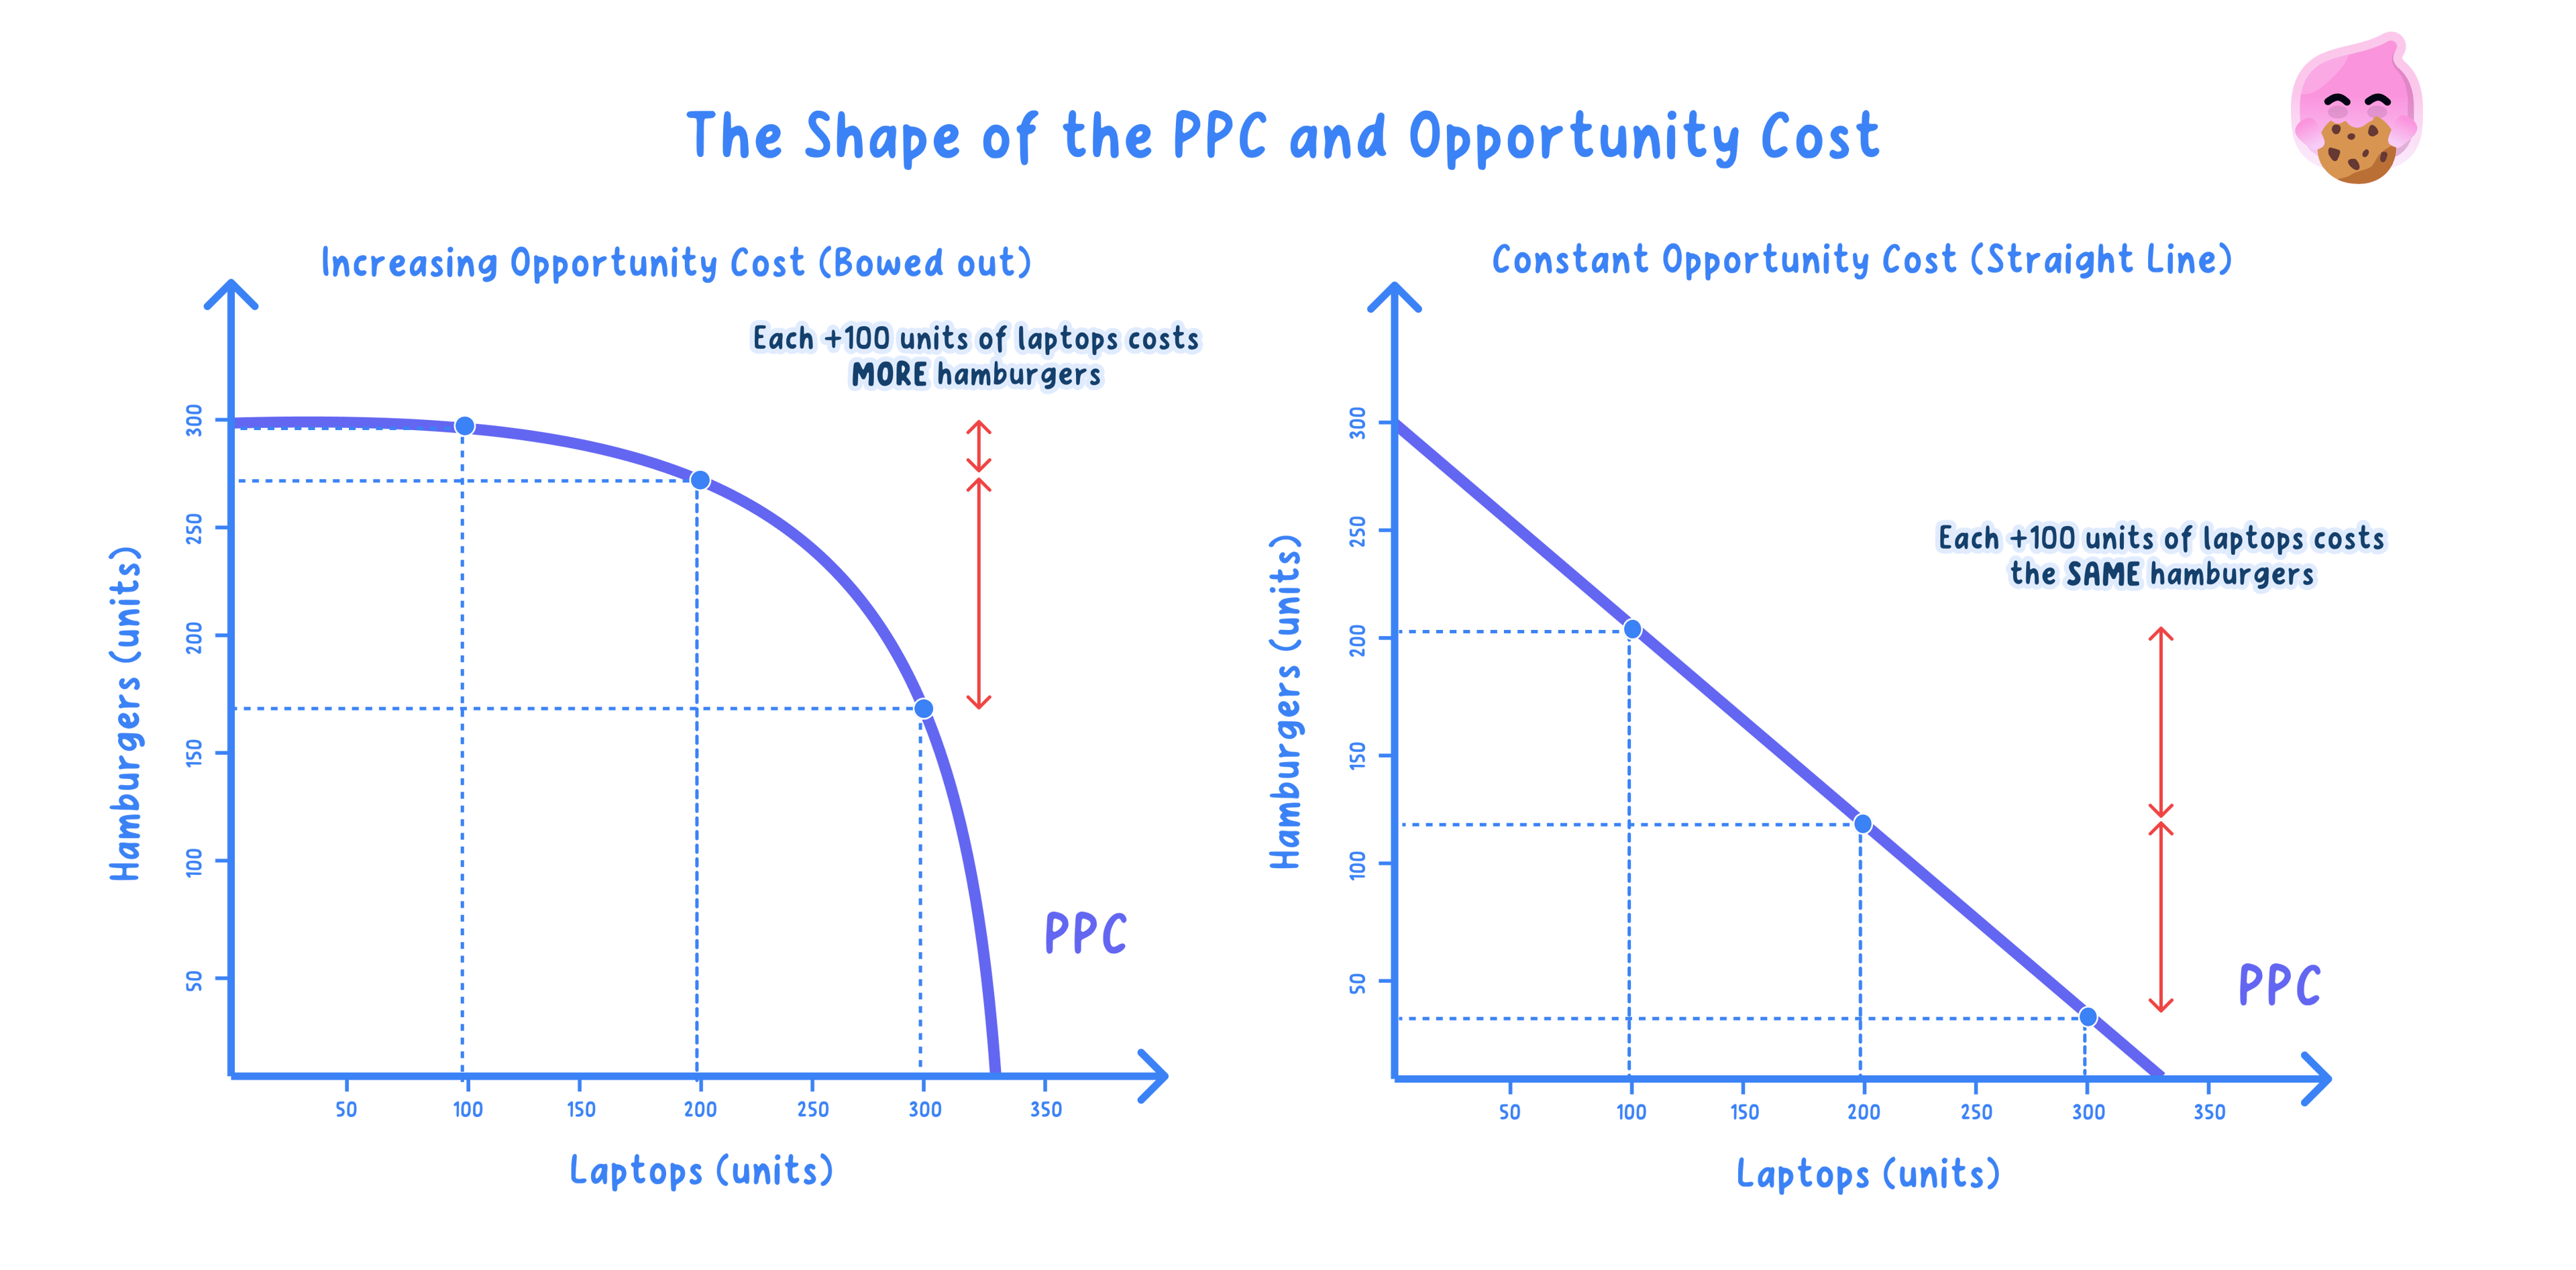
- As an economy shifts resources towards one good, the opportunity cost of each extra unit usually rises, which is what gives most PPFs their outward-bowed (concave) shape.
- This happens because factors of production are not equally suited to both goods, so expanding one forces the economy to switch over resources that were better at making the other.
Example
- An economy makes two goods, units of healthcare and units of education, and its PPF passes through five points.
- A: 0 healthcare and 100 education; B: 10 and 90; C: 20 and 70; D: 30 and 40; E: 40 and 0.
- Moving from A to B, the first 10 units of healthcare cost 10 units of education (100−90=10100 - 90 = 10100−90=10).
- Moving from C to D, the same extra 10 units of healthcare now cost 30 units of education (70−40=3070 - 40 = 3070−40=30).
- Because each extra 10 units of healthcare costs more education than the batch before, opportunity cost is increasing and the frontier bows outwards from the origin.
Why the PPF Is So Useful
- It shows the cost of any choice as the output of the other good given up.
- It distinguishes an economy running at capacity from one in recession with idle resources.
- It provides the base model for the ideas of efficiency and growth used later.
What the PPF Leaves Out
- It simplifies the whole economy down to just two goods.
- It shows productive potential but not whether the mix produced is what society actually wants.
- Even so, its power lies in making abstract ideas like opportunity cost visible in one diagram.
Exam technique
- Label the axes with the two goods, not price and quantity.
- State whether a point is on the frontier (efficient), inside (spare capacity) or beyond (unattainable).
- Use a movement along the curve to show opportunity cost.
Common Mistake
- Do not read a point beyond the frontier as merely inefficient.
- It is unattainable with current resources and technology.
- Do not confuse a movement along the PPF with a shift of it.
- Moving along reallocates resources, while a shift changes total capacity.
Efficiency on the Frontier: Making the Most of Scarce Resources
- The PPF is used to define two key types of efficiency.
- Productive efficiency is about producing as much as possible from given resources.
- Allocative efficiency is about producing the particular mix society most wants.
Note
- Productive efficiency is any point on the frontier, where no more of one good can be made without less of the other.
- Allocative efficiency is the single point on the frontier that matches society's preferences.
The Two Types of Efficiency
- Productive efficiency
- Reached anywhere on the boundary, since all resources are fully and well used.
- Allocative efficiency
- Reached only at the point where the mix of goods matches what society most values.
- Inefficiency
- Any point inside the boundary, where resources are unemployed or wasted.
- Every point on the frontier is productively efficient, but only one is also allocatively efficient.
Note
- So an economy can be productively efficient yet still make the wrong mix of goods.
Efficiency Has Two Dimensions, Not One
- It shows efficiency has two dimensions: how much is made, and whether it is the right thing.
- It sets up the efficiency concepts used later in market structures and market failure.
- It explains why a fully employed economy can still allocate resources badly.
Achieving Both Kinds of Efficiency Is Hard
- Reaching the frontier secures productive efficiency, which is demanding enough on its own.
- Hitting the exact allocatively efficient point is harder, since it depends on knowing what society wants.
- Markets can move towards allocative efficiency through the price mechanism, but market failure can block it.
Exam technique
- Define productive and allocative efficiency separately and precisely.
- Place productive efficiency anywhere on the frontier and allocative efficiency at one specific point.
- Use an inside point to illustrate productive inefficiency.
Common Mistake
- Do not treat all points on the frontier as allocatively efficient.
- Every point is productively efficient, but only one matches society's preferred mix.
- Do not confuse productive inefficiency with an inward shift.
- Inefficiency is a point inside the frontier, not a fall in the frontier itself.
Self review
- What does a PPF show, and what do points on, inside and beyond the frontier each represent?
- How does the PPF illustrate opportunity cost and trade-offs?
- How does a PPF illustrate the unemployment of resources and economic growth?
- Define productive efficiency and allocative efficiency.
- Why is every point on the frontier productively efficient but not necessarily allocatively efficient?
- Explain, with a numerical example, why opportunity cost typically rises as an economy moves along its PPF.
