1.3.2a Calculating elasticities of demand
Price Elasticity of Demand: Measuring How Buyers Respond
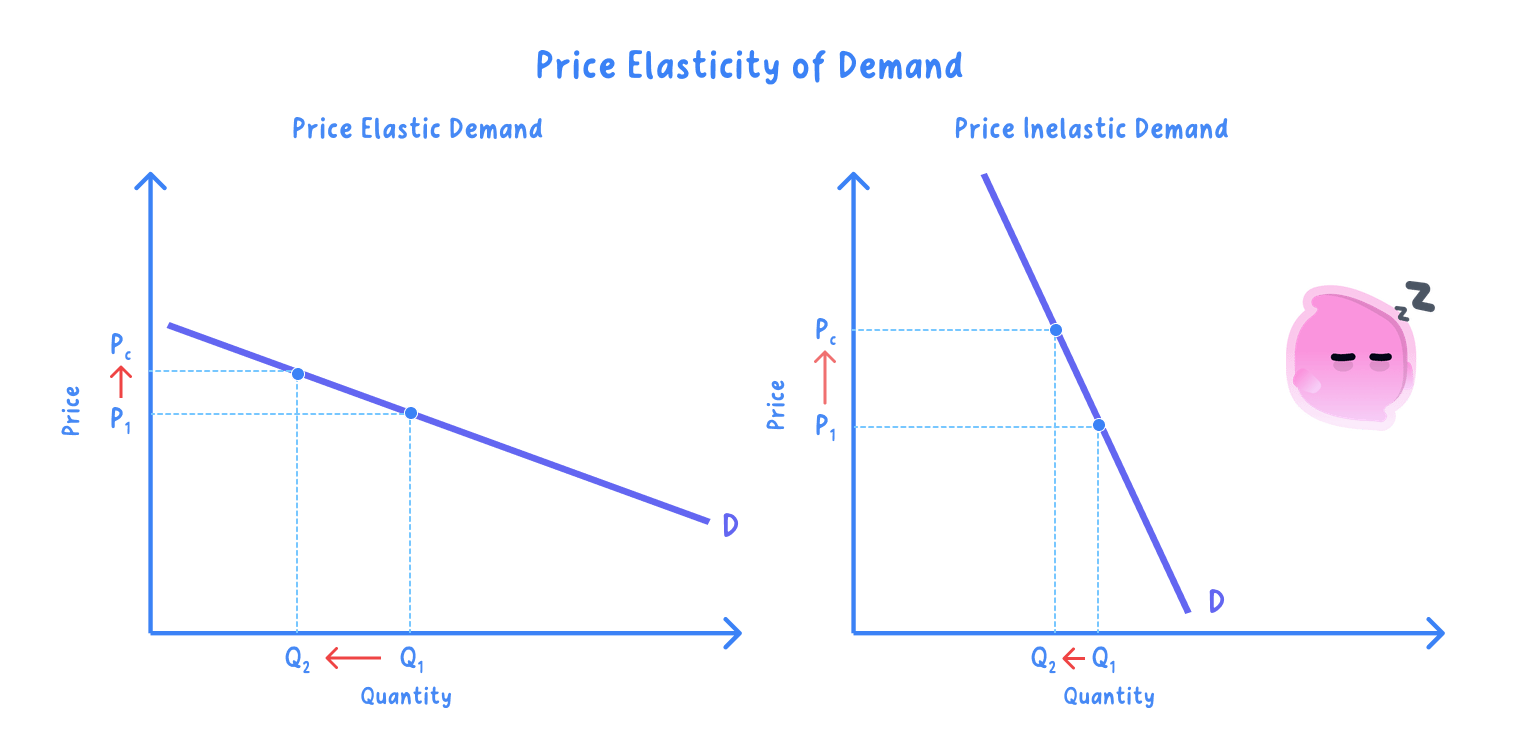
Price elasticity of demand: a measure of the responsiveness of quantity demanded to a change in a good's own price, calculated as the percentage change in quantity demanded divided by the percentage change in price.
- Price elasticity of demand (PED) measures how responsive quantity demanded is to a change in the good's own price.
- It is calculated as the percentage change in quantity demanded divided by the percentage change in price. Formally, PED=%ΔQd%ΔP\text{PED} = \dfrac{\%\Delta Q_d}{\%\Delta P}PED=%ΔP%ΔQd.
- Because price and quantity move in opposite directions, PED is normally negative.
- PED equals the percentage change in quantity demanded divided by the percentage change in price.
- The size of the coefficient, ignoring the sign, tells you how responsive demand is.
Interpreting the Coefficient: Elastic, Inelastic or Unit Elastic
- Elastic (greater than 1)
- Quantity responds more than proportionately to a price change, so a small price cut raises quantity demanded a lot; this is typical of goods with close substitutes, such as one brand of biscuit among many.
- Inelastic (between 0 and 1)
- Quantity responds less than proportionately, so even a large price change barely moves quantity demanded; this is typical of necessities and goods with few substitutes, such as petrol or cigarettes.
- Unit elastic (equal to 1)
- Quantity changes in exact proportion to price, so a 10 per cent price rise cuts quantity demanded by exactly 10 per cent and total revenue is unchanged.
- The extremes
- Perfectly inelastic demand is zero, so quantity does not change at all when price changes, while perfectly elastic demand is infinite, so buyers take everything at one price and nothing at all above it.
- For example, a PED of −0.4-0.4−0.4 means a 10 per cent price rise cuts quantity demanded by 4 per cent (−4%+10%=−0.4\dfrac{-4\%}{+10\%} = -0.4+10%−4%=−0.4), so demand is inelastic.
- The minus sign shows the inverse relationship and should not be dropped.
Income and Cross Elasticity Use the Same Percentage Method
- Income elasticity of demand (YED) measures how responsive quantity demanded is to a change in real income.
- YED equals the percentage change in quantity demanded divided by the percentage change in real income. Formally, YED=%ΔQd%ΔY\text{YED} = \dfrac{\%\Delta Q_d}{\%\Delta Y}YED=%ΔY%ΔQd.
- Cross elasticity of demand (XED) measures how responsive quantity demanded of one good is to a change in the price of another good.
- XED equals the percentage change in quantity demanded of the first good divided by the percentage change in the price of the second good. Formally, XED=%ΔQdA%ΔPB\text{XED} = \dfrac{\%\Delta Q_d^{A}}{\%\Delta P^{B}}XED=%ΔPB%ΔQdA.
- Each elasticity is a percentage change divided by a percentage change.
- The sign of a YED or XED coefficient is meaningful, showing the type of good or the relationship between the two goods.
- These relationships are explored in 1.3.2b.
Worked Examples: Calculating PED, YED and XED
- Every calculation follows the same routine: work out the percentage change on top, work out the percentage change on the bottom, divide, then interpret the sign and the size.
- PED: a cafe raises the price of a latte from £3.00 to £3.30, a 10 per cent rise, and weekly sales fall from 500 to 470, a fall of 30/500 = 6 per cent.
- PED=−6%+10%=−0.6\text{PED} = \dfrac{-6\%}{+10\%} = -0.6PED=+10%−6%=−0.6, so demand is price inelastic and the price rise will raise the cafe's total revenue.
- YED: real incomes rise by 4 per cent and a restaurant chain's number of covers rises by 8 per cent.
- YED=+8%+4%=+2\text{YED} = \dfrac{+8\%}{+4\%} = +2YED=+4%+8%=+2, a positive and income-elastic figure, so restaurant meals behave as a normal luxury good.
- XED: the price of Coca-Cola rises by 20 per cent and weekly demand for Pepsi rises by 10 per cent.
- XED=+10%+20%=+0.5\text{XED} = \dfrac{+10\%}{+20\%} = +0.5XED=+20%+10%=+0.5, a positive figure, which confirms the two drinks are substitutes.
PED Guides Pricing, Revenue and Tax Decisions
- It tells a firm how a price change will affect the quantity it sells.
- It underpins the link between price changes and total revenue.
- It helps governments predict how a tax will affect consumption.
Evaluation: How Precise Is PED?
- It gives a clear numerical guide to responsiveness.
- But it assumes other things stay equal, which rarely holds exactly.
- Measured values can also change over time as substitutes emerge.
Keep the Sign and Read the Size
- Use the formula and keep the negative sign for PED.
- Judge elastic versus inelastic by whether the size exceeds one.
- Interpret what the coefficient means in words, not just numbers.
- Do not drop the negative sign of PED.
- It shows the inverse relationship between price and quantity demanded.
- Do not confuse elastic with inelastic.
- Elastic means a coefficient greater than one, while inelastic means between zero and one.
- Define price elasticity of demand.
- State the formula for PED.
- Why is PED normally negative?
- What does a coefficient of minus 0.4 tell you?
- What is the difference between elastic and inelastic demand?
- State the formulas for income and cross elasticity of demand.
- If price rises 20% and quantity demanded falls 10%, calculate PED and say whether demand is elastic or inelastic.
1.3.2b Income and cross elasticity relationships
Income Elasticity of Demand: How Demand Tracks Incomes
Income elasticity of demand: a measure of the responsiveness of quantity demanded to a change in real income, calculated as the percentage change in quantity demanded divided by the percentage change in income.
Cross elasticity of demand: a measure of the responsiveness of quantity demanded of one good to a change in the price of another good, calculated as the percentage change in quantity demanded of the first good divided by the percentage change in the price of the second.
- Income elasticity of demand (YED) measures how responsive quantity demanded is to a change in real income.
- It is calculated as the percentage change in quantity demanded divided by the percentage change in income: YED=%ΔQd%ΔY\text{YED} = \dfrac{\%\Delta Q_d}{\%\Delta Y}YED=%ΔY%ΔQd.
- The sign and size of YED classify the type of good.
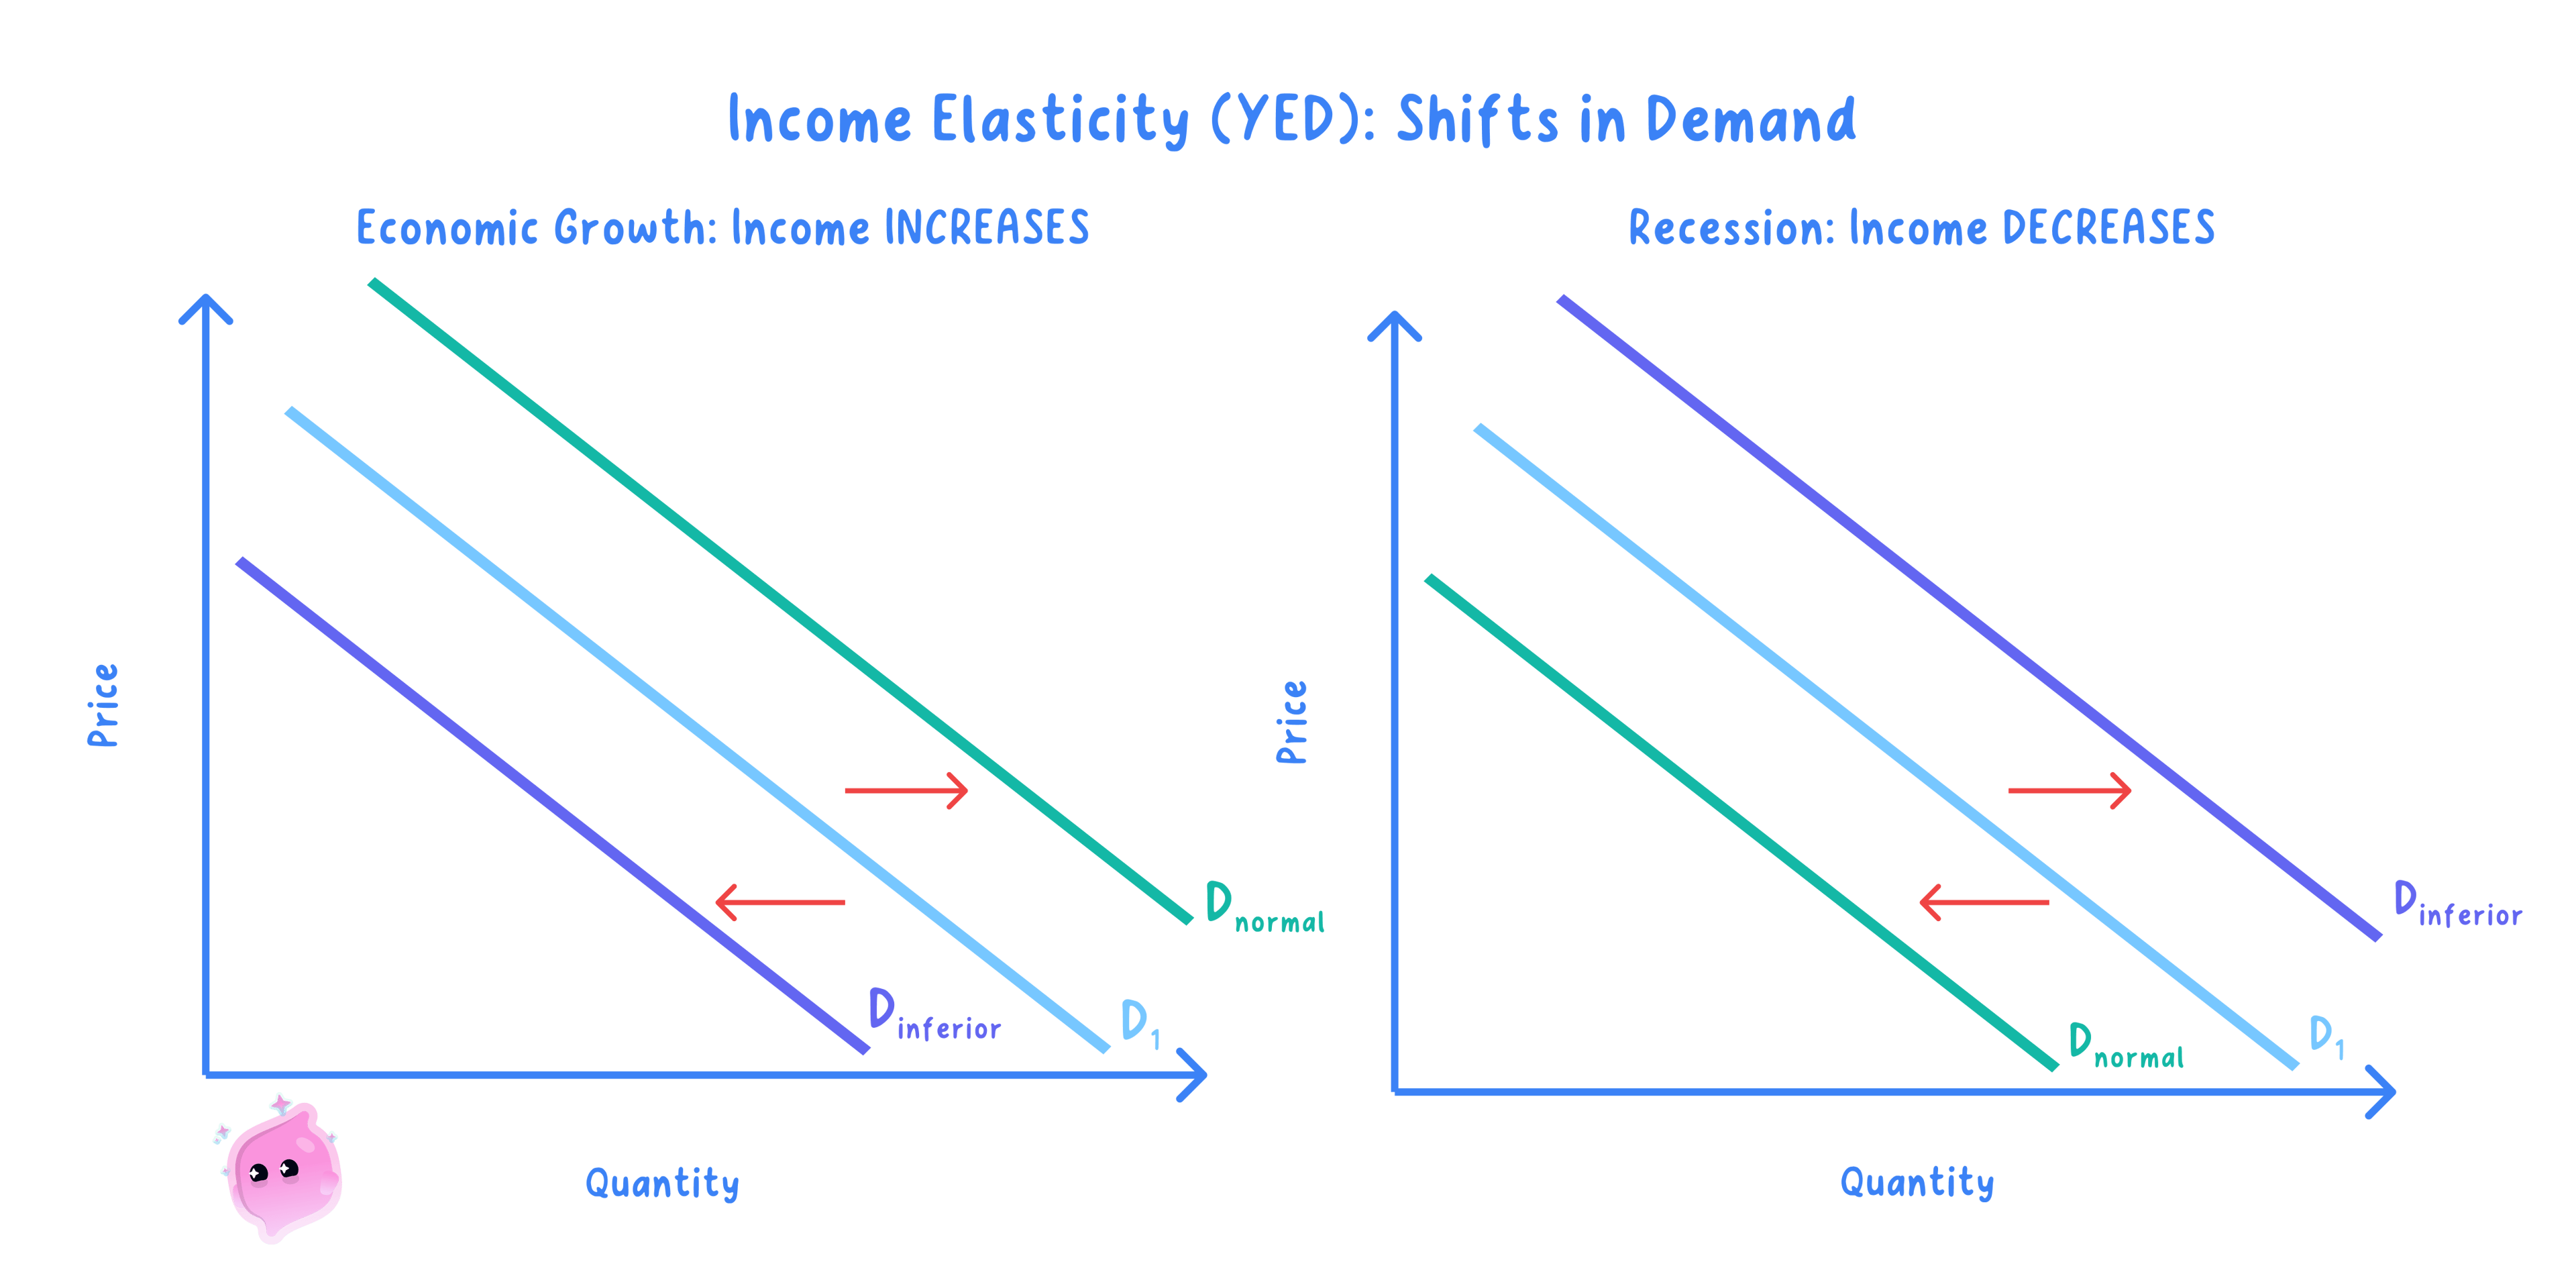
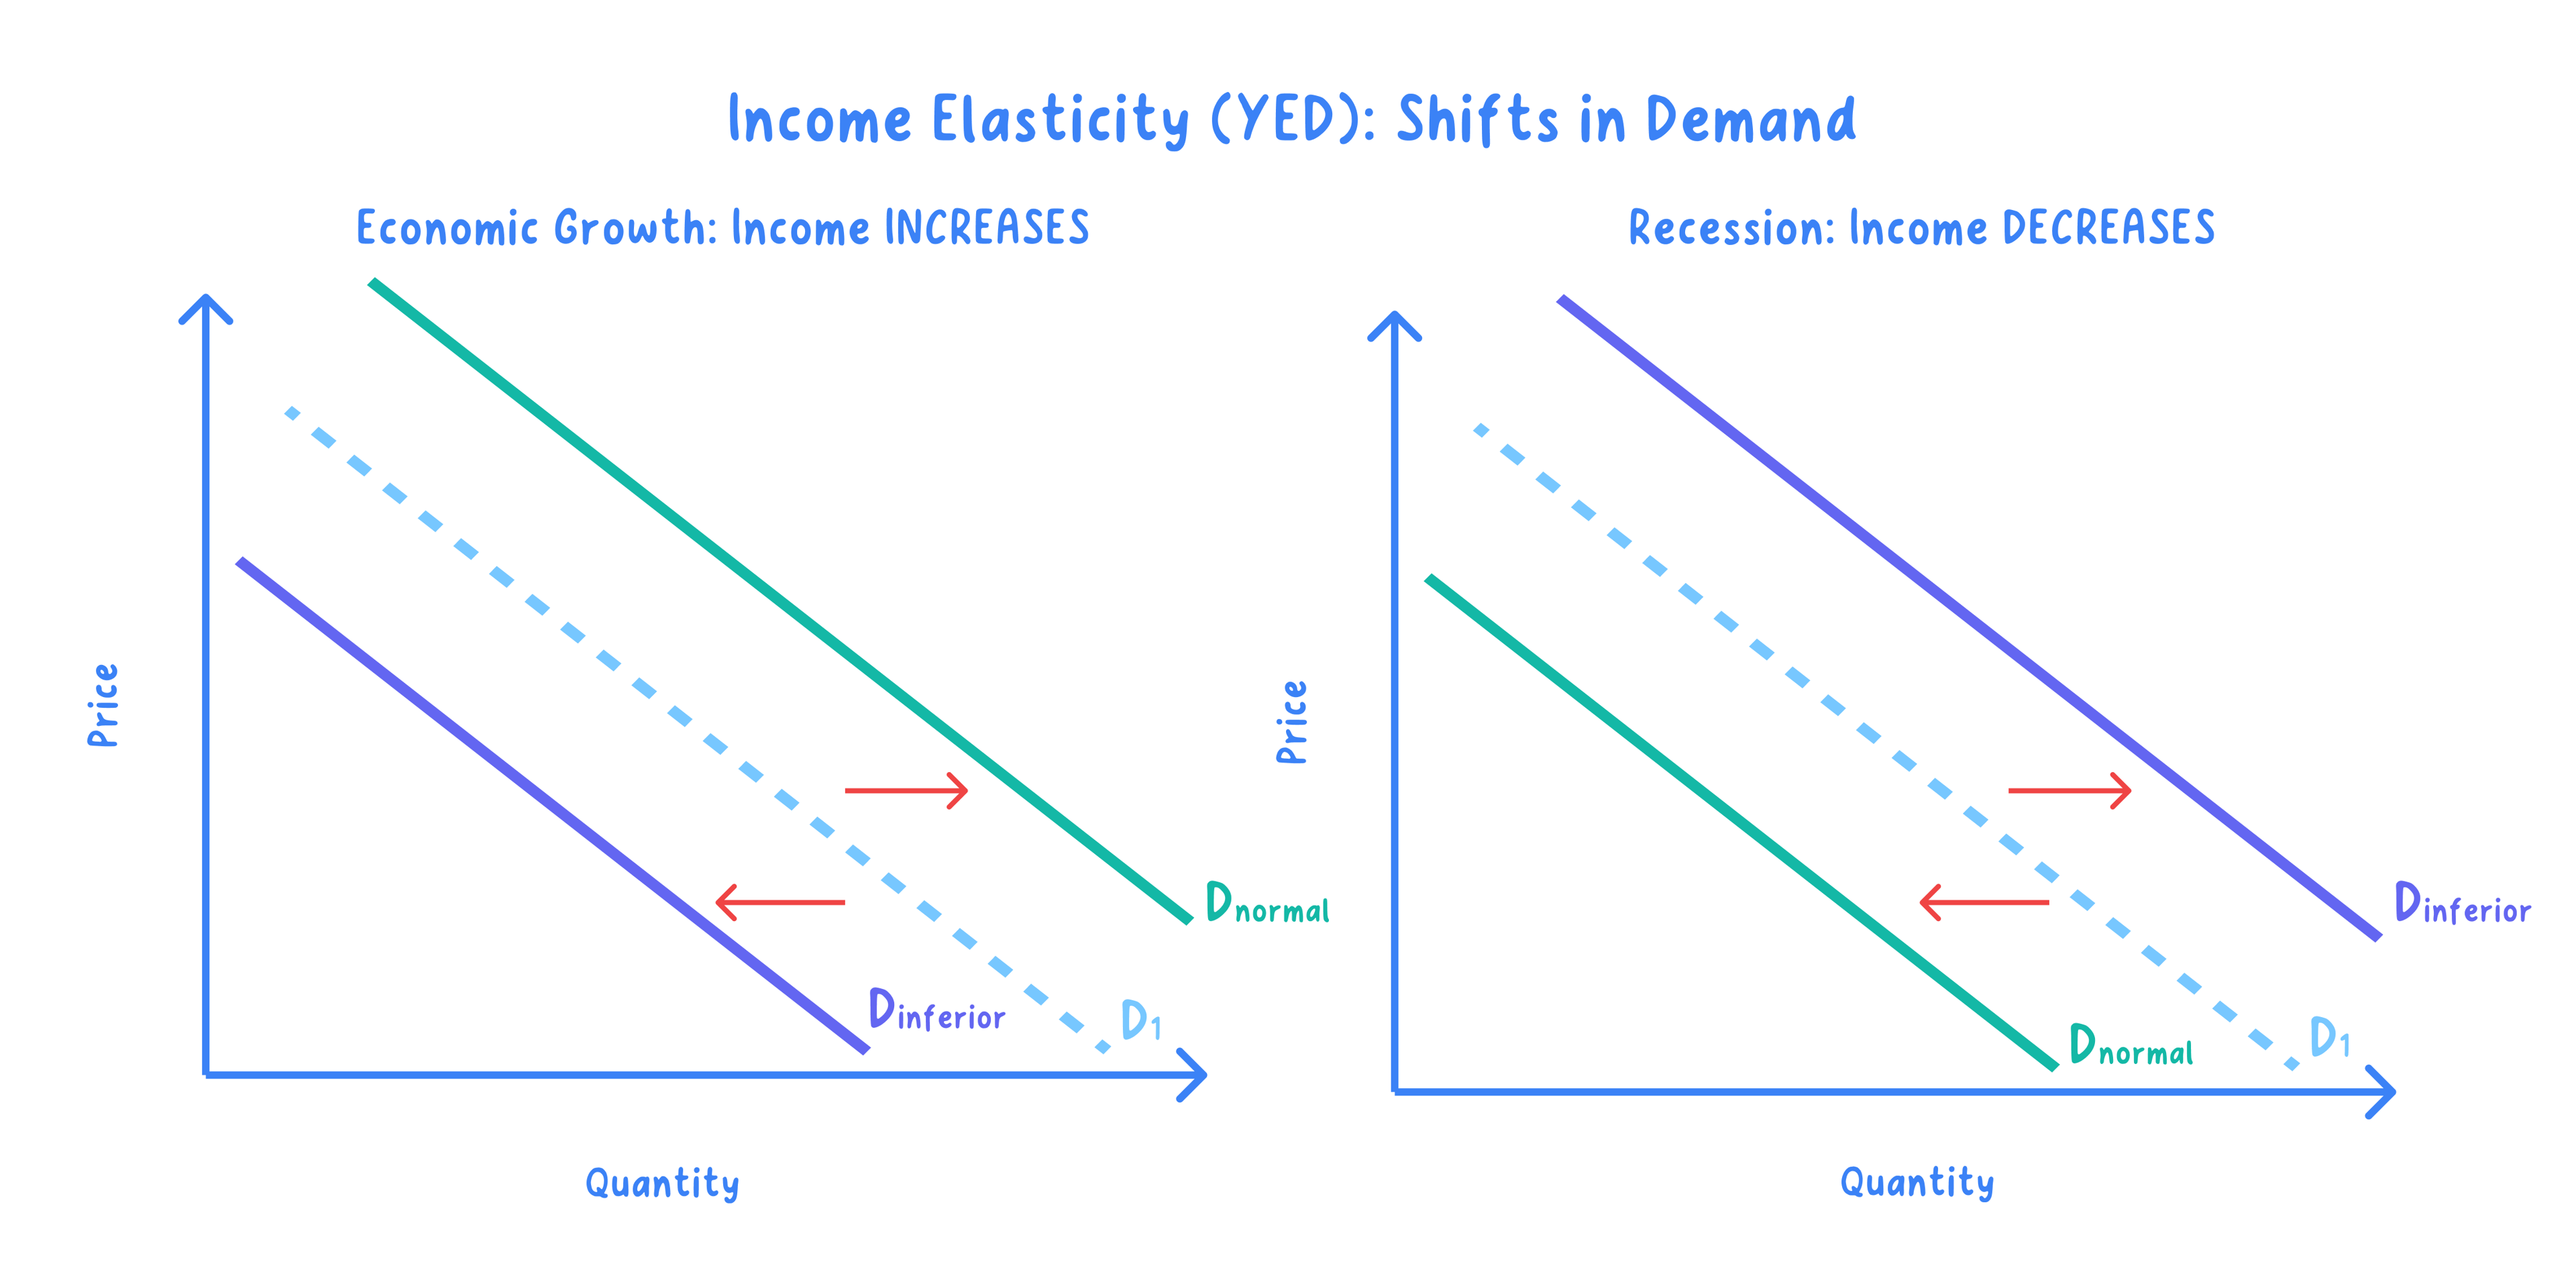
- Positive YED means a normal good, while negative YED means an inferior good.
- Among normal goods, luxuries have YED above one and necessities below one.
The Sign and Size of YED Classify the Good
- Normal necessity
- Positive YED below one, so demand rises more slowly than income.
- Normal luxury
- YED above one, so demand rises faster than income.
- Inferior good
- Negative YED, so demand falls as income rises.
- Suppose incomes rise by 4% and demand for restaurant meals rises by 8%, giving YED=+8%+4%=+2\text{YED} = \dfrac{+8\%}{+4\%} = +2YED=+4%+8%=+2.
- That positive figure above one marks a normal luxury, whose demand rises faster than income.
- If demand for a cheap own-brand staple instead fell by 2%, its YED=−2%+4%=−0.5\text{YED} = \dfrac{-2\%}{+4\%} = -0.5YED=+4%−2%=−0.5 would mark it as inferior.
YED Reveals Which Goods Are Cycle-Sensitive
- It helps firms forecast demand as the economy grows or shrinks.
- It explains why luxury sellers boom in an upturn and suffer in a downturn.
- It helps predict how industries fare over the economic cycle.
Evaluation: How Useful Is YED Over the Cycle?
- It gives a clear guide to which goods are cycle-sensitive.
- But YED can change as incomes and tastes shift over time.
- A good can move between categories, so the classification is not permanent.
Use Sign Then Size
- Read the sign first to tell normal from inferior.
- Then use the size to split normal goods into necessities and luxuries.
- Apply it to how a firm fares over the economic cycle.
- Do not confuse an inferior good with a low-quality good.
- An inferior good is simply one whose demand falls as income rises, whatever its quality.
- Do not ignore the sign of YED.
- The sign is what distinguishes normal from inferior goods.
Cross Elasticity of Demand: How Markets Pull on Each Other
- Cross elasticity of demand (XED) measures how the quantity demanded of one good responds to a change in the price of another.
- It is the percentage change in quantity demanded of one good divided by the percentage change in the price of the other: XED=%ΔQd,A%ΔPB\text{XED} = \dfrac{\%\Delta Q_{d,A}}{\%\Delta P_B}XED=%ΔPB%ΔQd,A.
- Its sign reveals how the two goods are related.
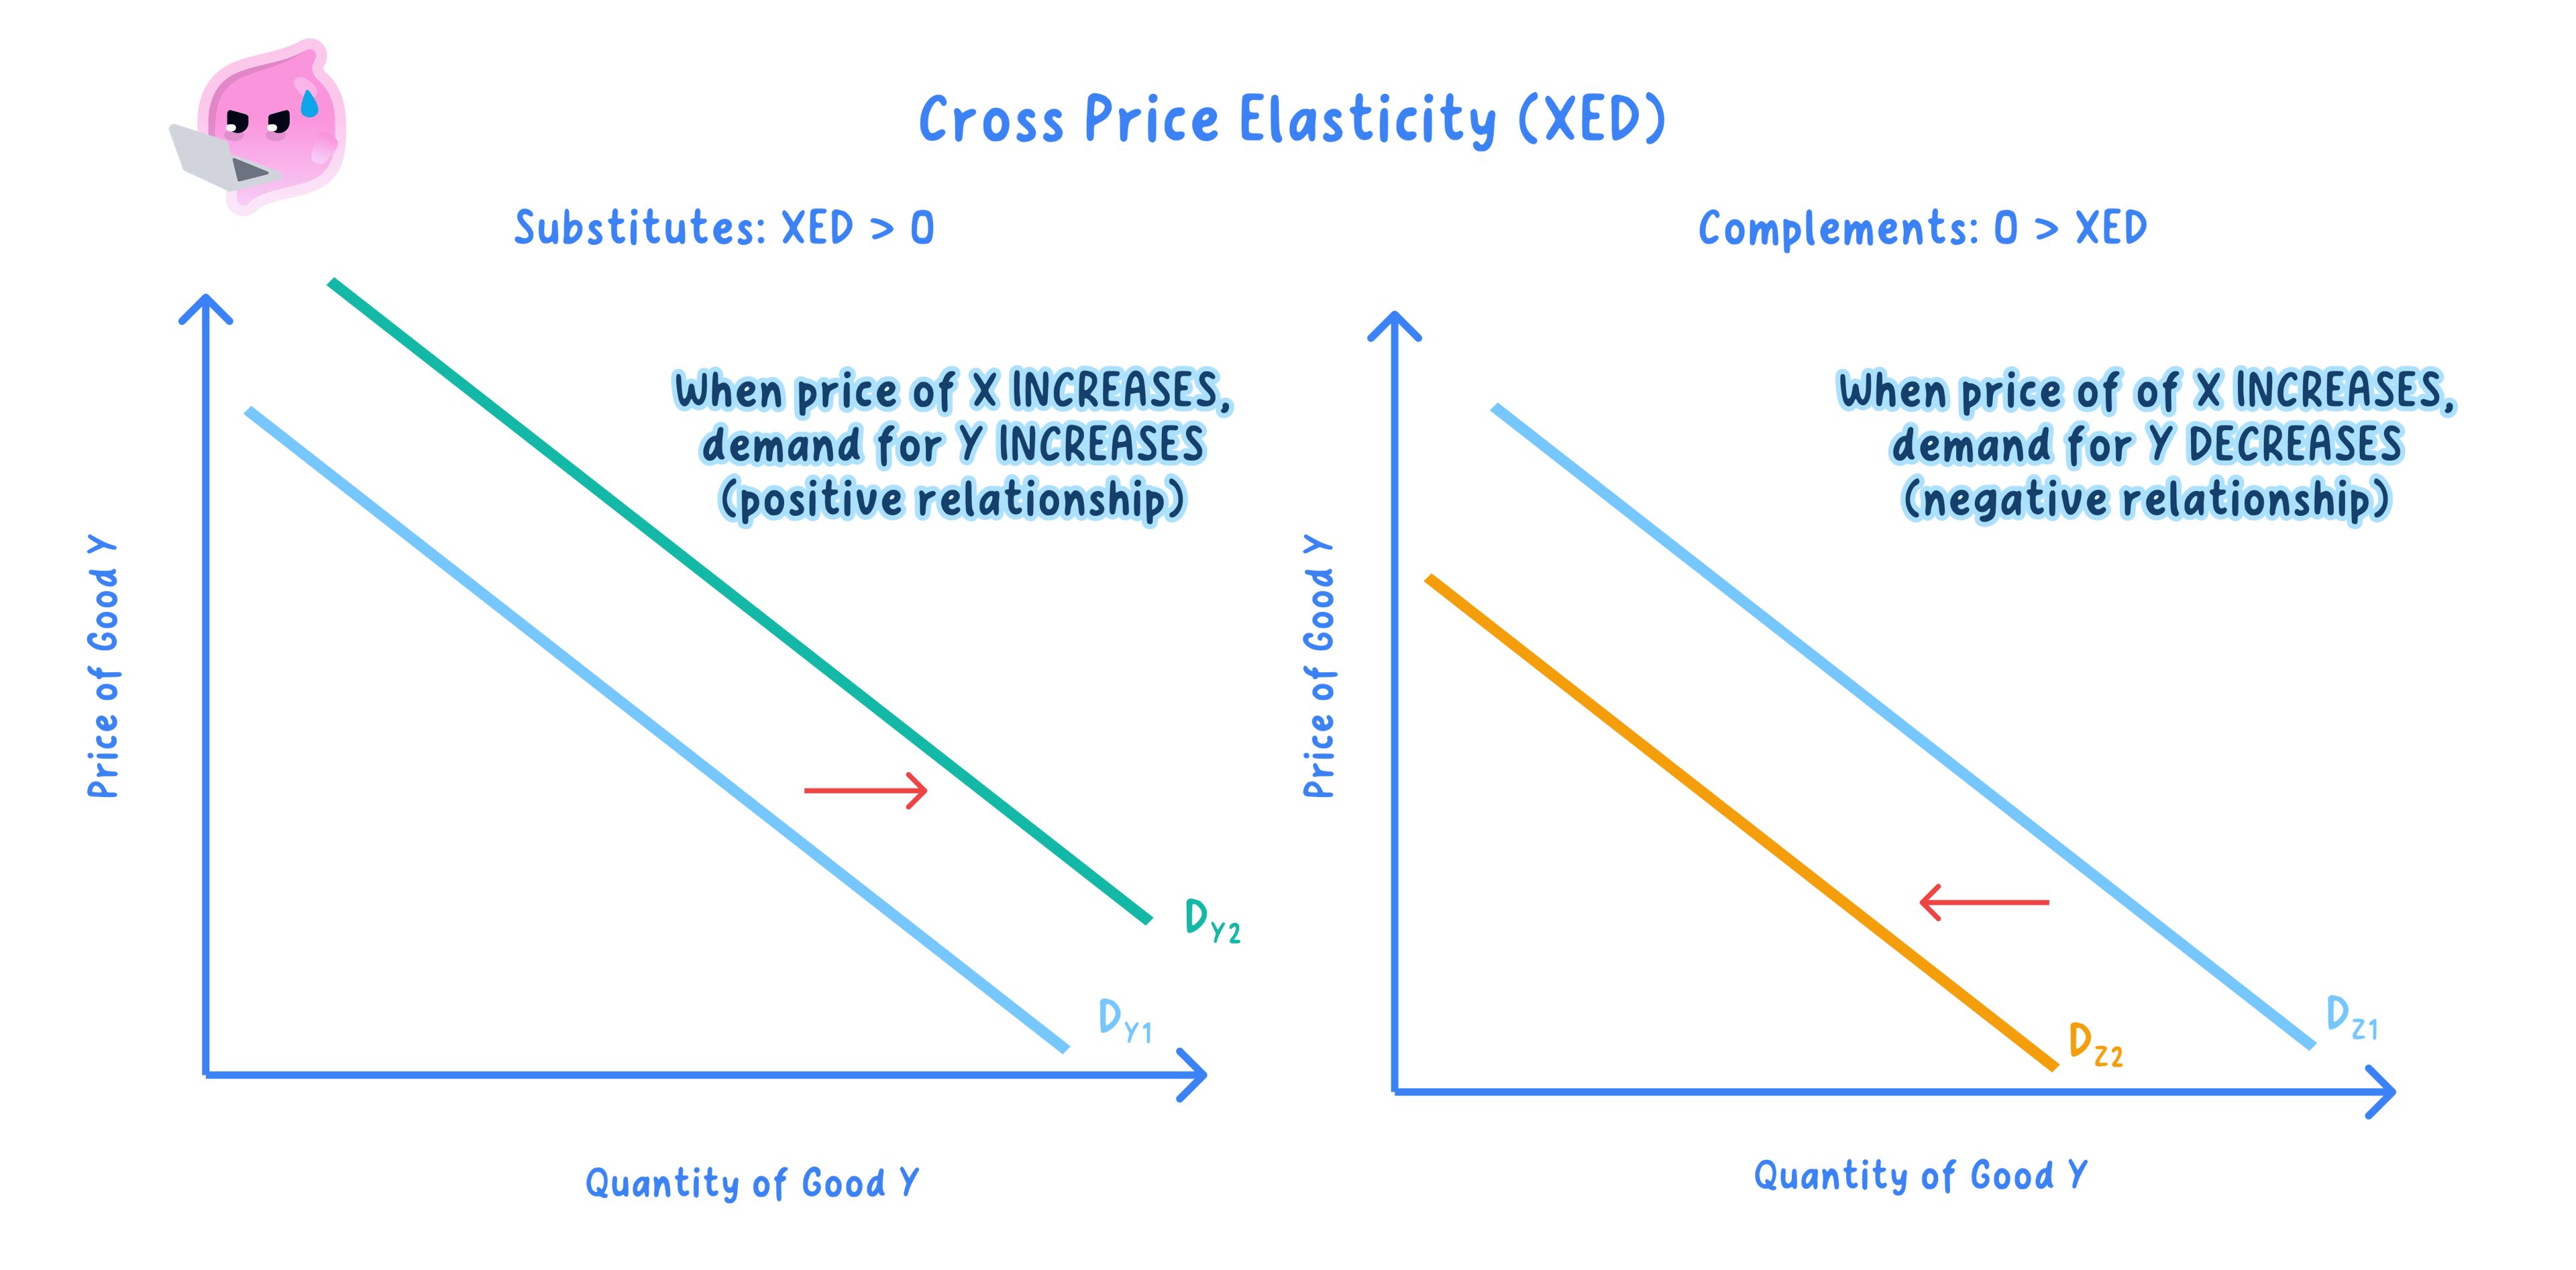
- Positive XED means substitutes, while negative XED means complements.
- An XED near zero means the goods are unrelated.
Reading the Sign and Size of XED
- Positive XED (substitutes)
- A dearer rival raises demand for this good.
- Negative XED (complements)
- A dearer complement lowers demand for this good.
- Size of the coefficient
- The larger it is, the stronger the relationship between the two goods.
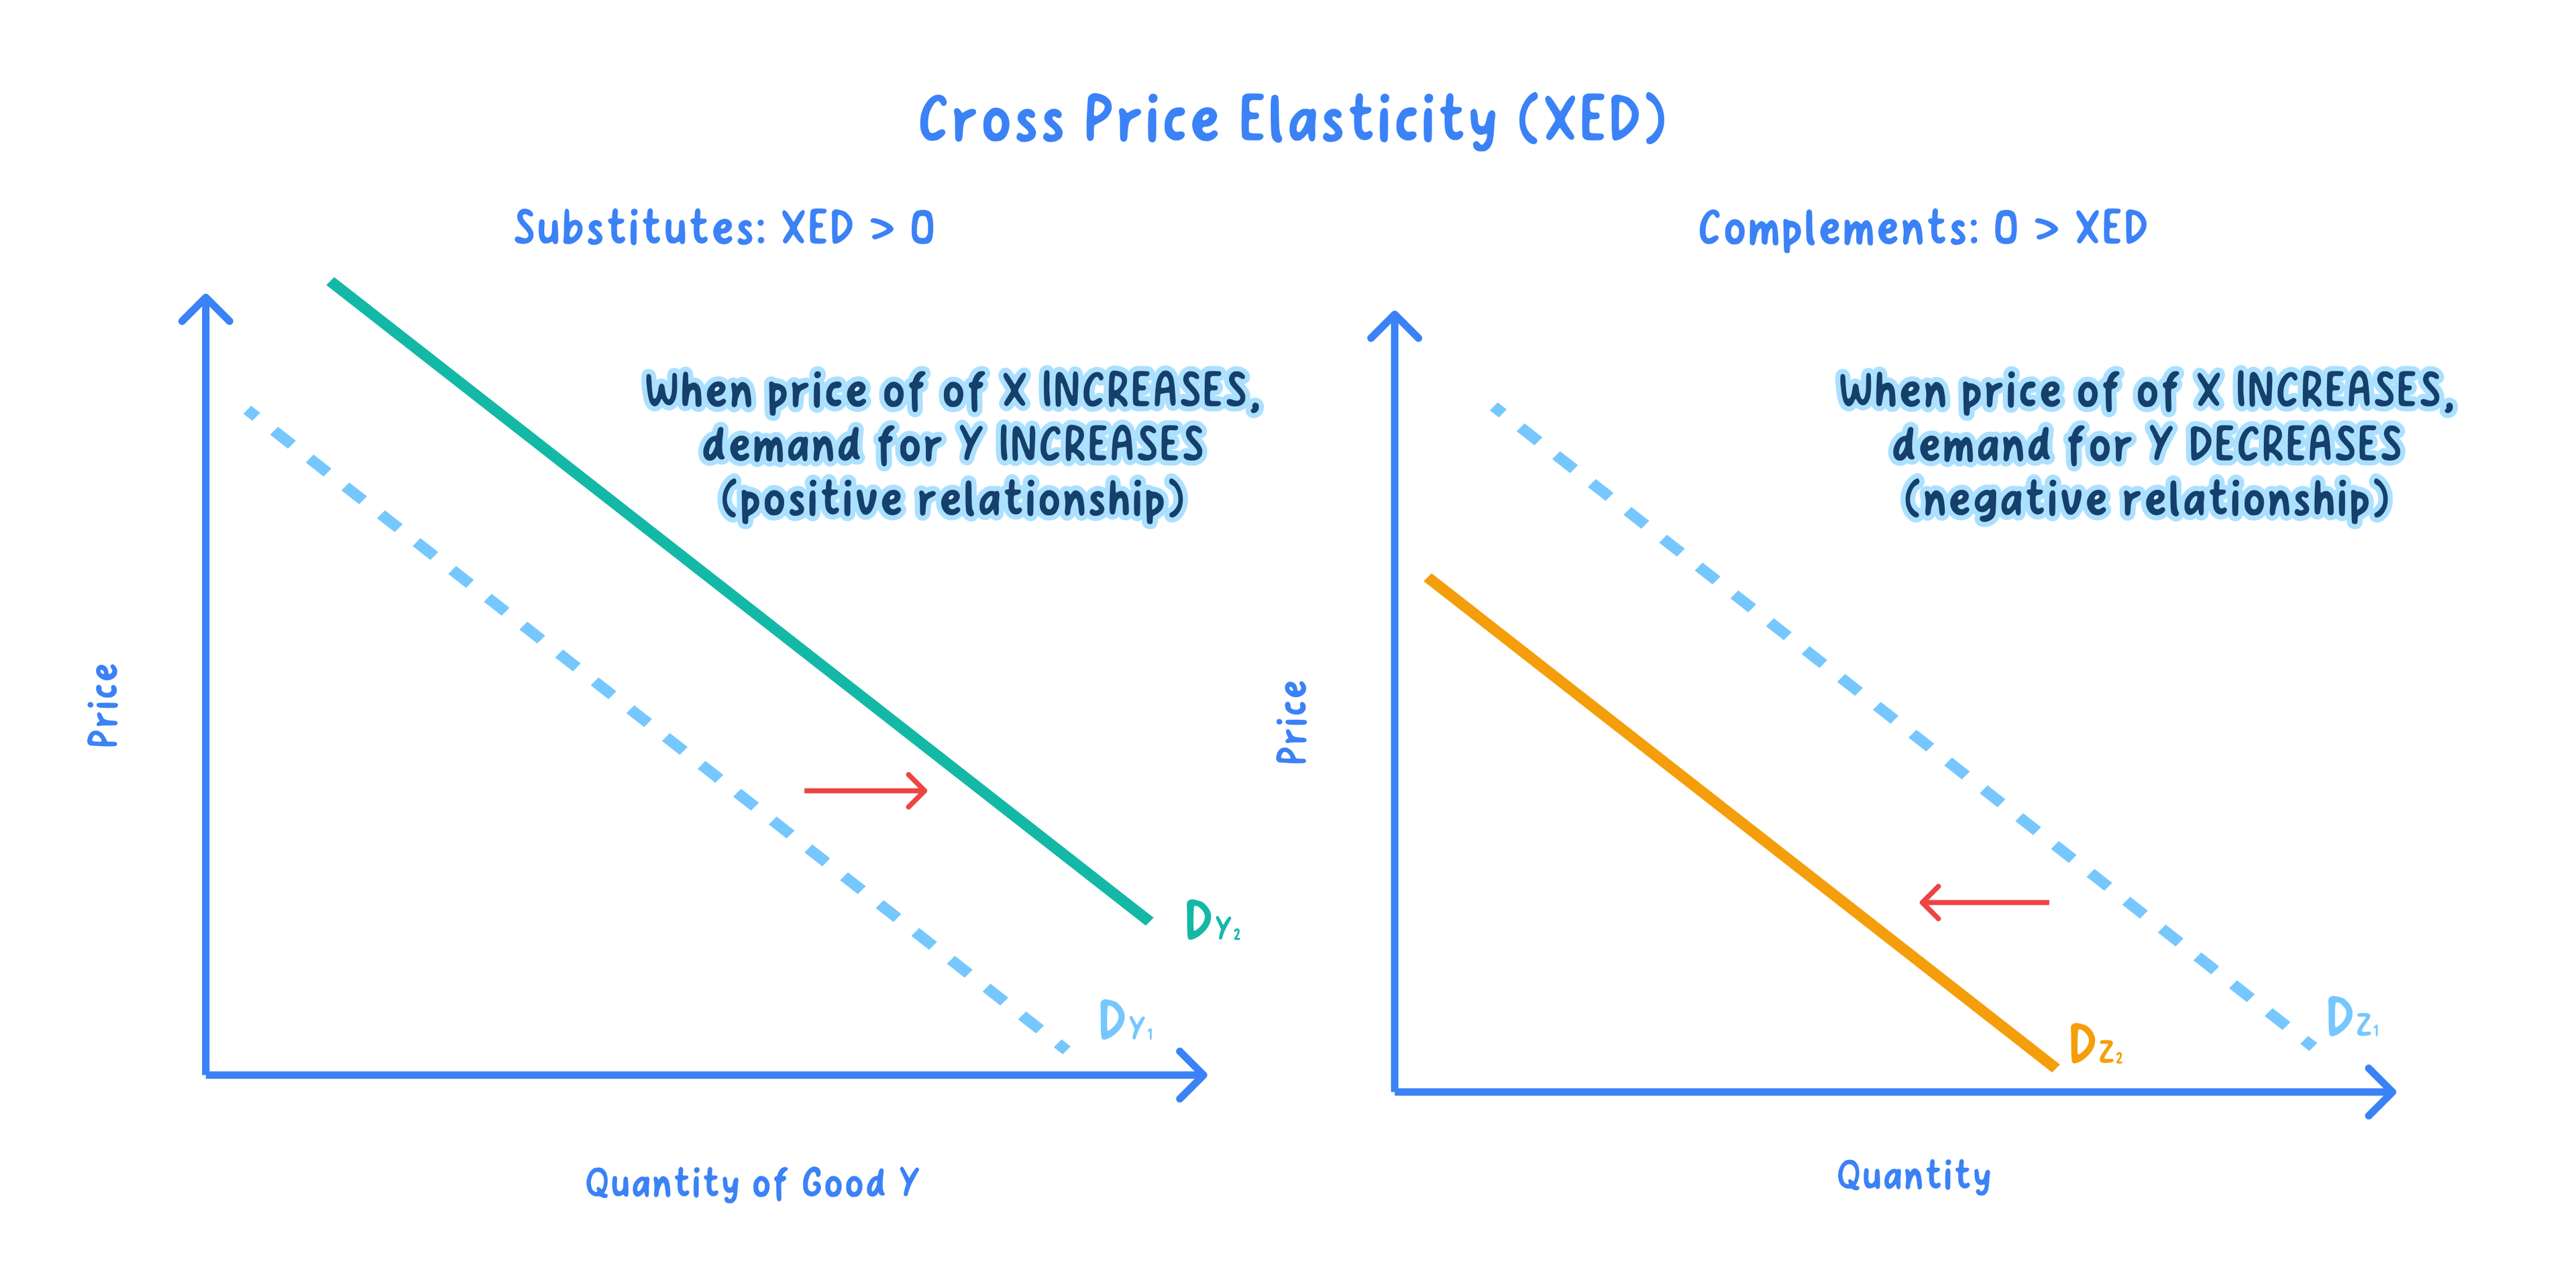
- Suppose the price of one coffee brand rises by 10% and demand for a rival rises by 5%, giving XED=+5%+10%=+0.5\text{XED} = \dfrac{+5\%}{+10\%} = +0.5XED=+10%+5%=+0.5.
- The positive sign marks them as substitutes, and the size shows a fairly weak link.
- If a 10% rise in console prices cut game sales by 8%, the XED=−8%+10%=−0.8\text{XED} = \dfrac{-8\%}{+10\%} = -0.8XED=+10%−8%=−0.8 would mark them as complements.
XED Reveals How Closely Markets Are Linked
- It helps a firm anticipate how a rival's price change will affect its sales.
- It guides pricing of complements, such as printers and ink.
- It shows how closely markets are linked.
Evaluation: How Reliable Is XED?
- It gives a clear signal of the relationship between two goods.
- But relationships can change as new products appear.
- Measured values assume other influences stay constant, which rarely holds.
Sign First, Then Strength
- Use the sign to classify substitutes, complements or unrelated goods.
- Use the size to judge how strong the link is.
- Apply it to a real pricing decision.
- Do not misread the sign convention.
- Positive XED means substitutes, while negative XED means complements.
- Do not ignore the size of the coefficient.
- A small value means a weak link, even if the sign is correct.
- Define income elasticity of demand.
- What does a positive YED tell you, and how do luxuries differ from necessities?
- Why is an inferior good not the same as a low-quality good?
- Define cross elasticity of demand.
- What do a positive and a negative XED each indicate?
- What does the size of an XED coefficient tell you?
1.3.2c Price elasticity, revenue and determinants
Elasticity and Revenue: Whether a Price Rise Helps or Hurts Depends on PED
Total revenue: the total amount of money a firm receives from selling its output over a period, calculated as price multiplied by quantity sold.
- Total revenue is price multiplied by quantity sold, TR=P×Q\text{TR} = P \times QTR=P×Q, which equals total spending by consumers.
- Whether a price change raises or lowers total revenue depends on price elasticity of demand.
- This makes PED central to a firm's pricing decision.
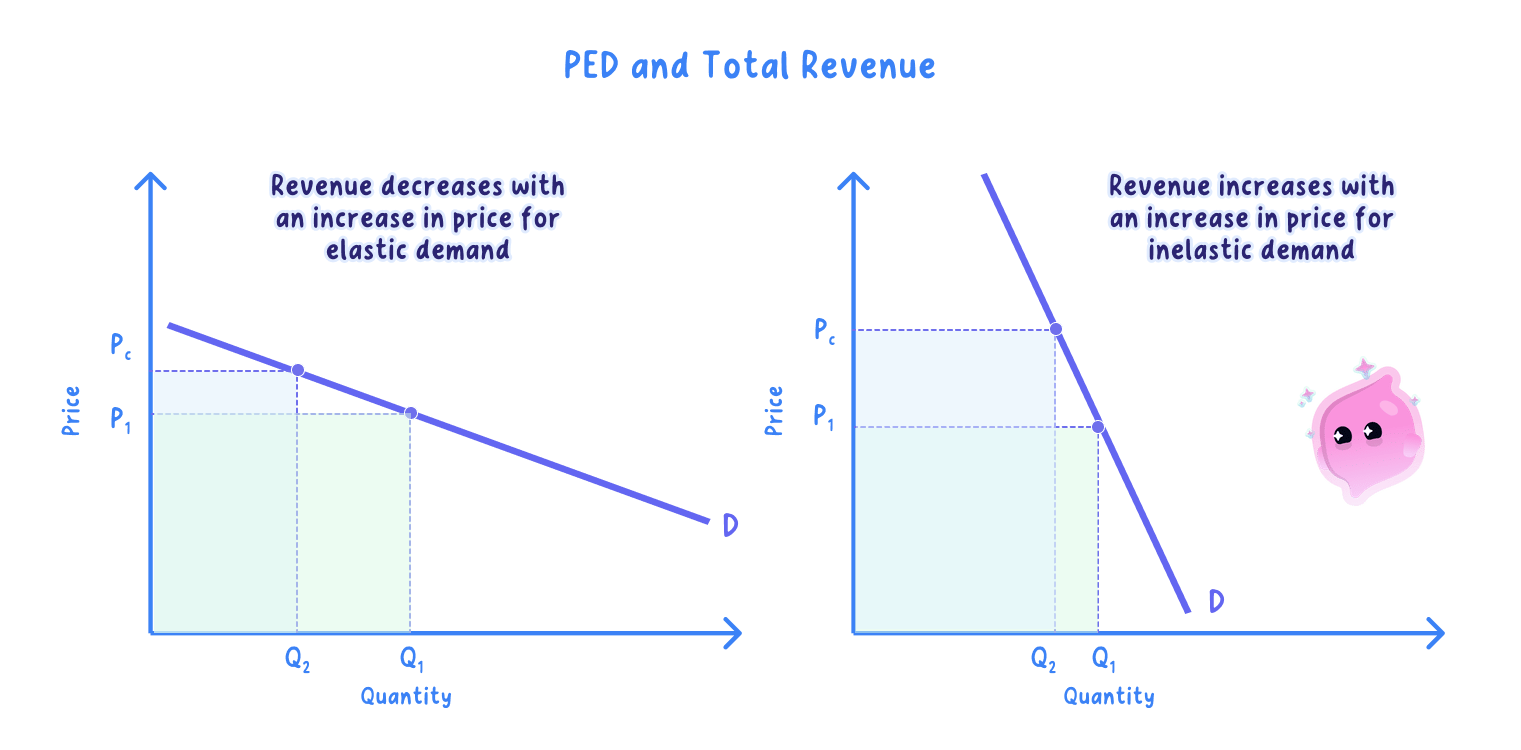
- If demand is inelastic, a price rise raises total revenue.
- If demand is elastic, a price rise lowers total revenue, but a price cut raises it.
Inelastic, Elastic and Unit Elastic Demand Each Move Revenue Differently
- Inelastic demand
- Quantity demanded falls proportionately less than price rises, so a price rise raises total revenue.
- Elastic demand
- Quantity demanded falls proportionately more than price rises, so a price rise lowers total revenue.
- Unit elastic
- Total revenue is unchanged by a small price change and is at its maximum where PED equals one.
- Suppose a firm sells 100 units at £10, so total revenue is £10×100=£1,000\pounds 10 \times 100 = \pounds 1{,}000£10×100=£1,000.
- It raises the price to £12, a 20% rise, and quantity demanded falls to 90 units, a 10% fall, so demand is inelastic (PED=−10%+20%=−0.5\text{PED} = \dfrac{-10\%}{+20\%} = -0.5PED=+20%−10%=−0.5).
- Revenue rises to £12×90=£1,080\pounds 12 \times 90 = \pounds 1{,}080£12×90=£1,080, confirming that a price rise raises revenue when demand is inelastic.
Firms Raise Price When Demand Is Inelastic and Cut It When Elastic
- A firm with inelastic demand can raise price to raise revenue.
- A firm with elastic demand should consider cutting price to raise revenue.
- Knowing PED turns pricing from guesswork into a calculated decision.
- Now take a good with elastic demand: a firm sells 200 units at £20, so total revenue is £20×200=£4,000\pounds 20 \times 200 = \pounds 4{,}000£20×200=£4,000.
- It cuts the price to £18, a 10% fall, and quantity demanded rises to 240 units, a 20% rise, so demand is elastic (PED=+20%−10%=−2\text{PED} = \dfrac{+20\%}{-10\%} = -2PED=−10%+20%=−2).
- Total revenue rises to £18×240=£4,320\pounds 18 \times 240 = \pounds 4{,}320£18×240=£4,320, showing that when demand is elastic a price cut, not a price rise, is what raises revenue.
Evaluation: Revenue Is Not the Same as Profit
- Revenue is not the same as profit, which also depends on costs.
- PED often varies along the demand curve, so the rule can change with price.
- Firms also weigh long-run effects, such as customer loyalty, not just immediate revenue.
State the PED, Then Deduce the Revenue Effect
- State the PED, then deduce the effect of a price change on total revenue.
- Remember total revenue is maximised where PED equals one.
- Distinguish revenue from profit in evaluation.
- Do not claim a price rise always raises revenue.
- It only does so when demand is inelastic; with elastic demand revenue falls.
- Do not treat revenue as the same as profit.
- Profit also depends on costs, which revenue analysis ignores.
What Makes Demand Elastic: The Determinants of PED
- Price elasticity of demand varies from good to good.
- Several factors determine whether demand is elastic or inelastic.
- The availability of substitutes is usually the most important.
- The easier it is to switch away from a good, the more elastic its demand.
- Elasticity also tends to rise the longer the time period.
The Main Determinants: Substitutes, Necessity, Income Share, Habit and Time
- Substitutes
- Many close substitutes make demand elastic.
- Necessity or luxury
- Necessities tend to be inelastic, while luxuries tend to be more elastic.
- Proportion of income
- Goods taking a large share of income tend to have more elastic demand.
- Addiction, habit or branding
- These make demand more inelastic.
- Time period
- Demand becomes more elastic over time as buyers find alternatives.
- For example, one brand of coffee has elastic demand because rivals exist, while coffee in general is more inelastic.
- Petrol is inelastic in the short run but more elastic over time as people switch cars or transport.
The Determinants Let a Firm Judge Whether It Can Raise Price Safely
- They let a firm judge whether it can raise price without losing many sales.
- They explain why the same price rise hits different products very differently.
- They connect elasticity to real product features, not just numbers.
Evaluation: Substitutes Usually Dominate, but Time Still Matters
- The availability of close substitutes is usually the strongest influence.
- But the time period matters greatly, since elasticity rises as substitutes appear.
- The factors can pull in different directions, so judgement is needed for any given good.
Justify Every Elasticity Claim with a Determinant
- Do not just assert a good is elastic or inelastic; justify it with determinants.
- Lead with the availability of substitutes.
- Note that demand tends to become more elastic over time.
- Do not treat elasticity as fixed for a good.
- It changes over time and depends on how narrowly the good is defined.
- Do not ignore substitutes when judging elasticity.
- The availability of substitutes is usually the key determinant.
Income and Cross Elasticity: The Nature of the Good and the Strength of the Link
- Income elasticity of demand depends on the nature of the good: necessities have low, positive but inelastic YED, luxuries have high, elastic YED, and inferior goods have negative YED.
- Cross elasticity of demand depends on how close the substitute or complementary relationship between the two goods is.
- Close substitutes give a large positive XED and close complements a large negative XED, while weakly related goods have XED near zero.
- So the same tools that explain PED also explain why some goods respond strongly to income or to rivals' prices while others barely react.
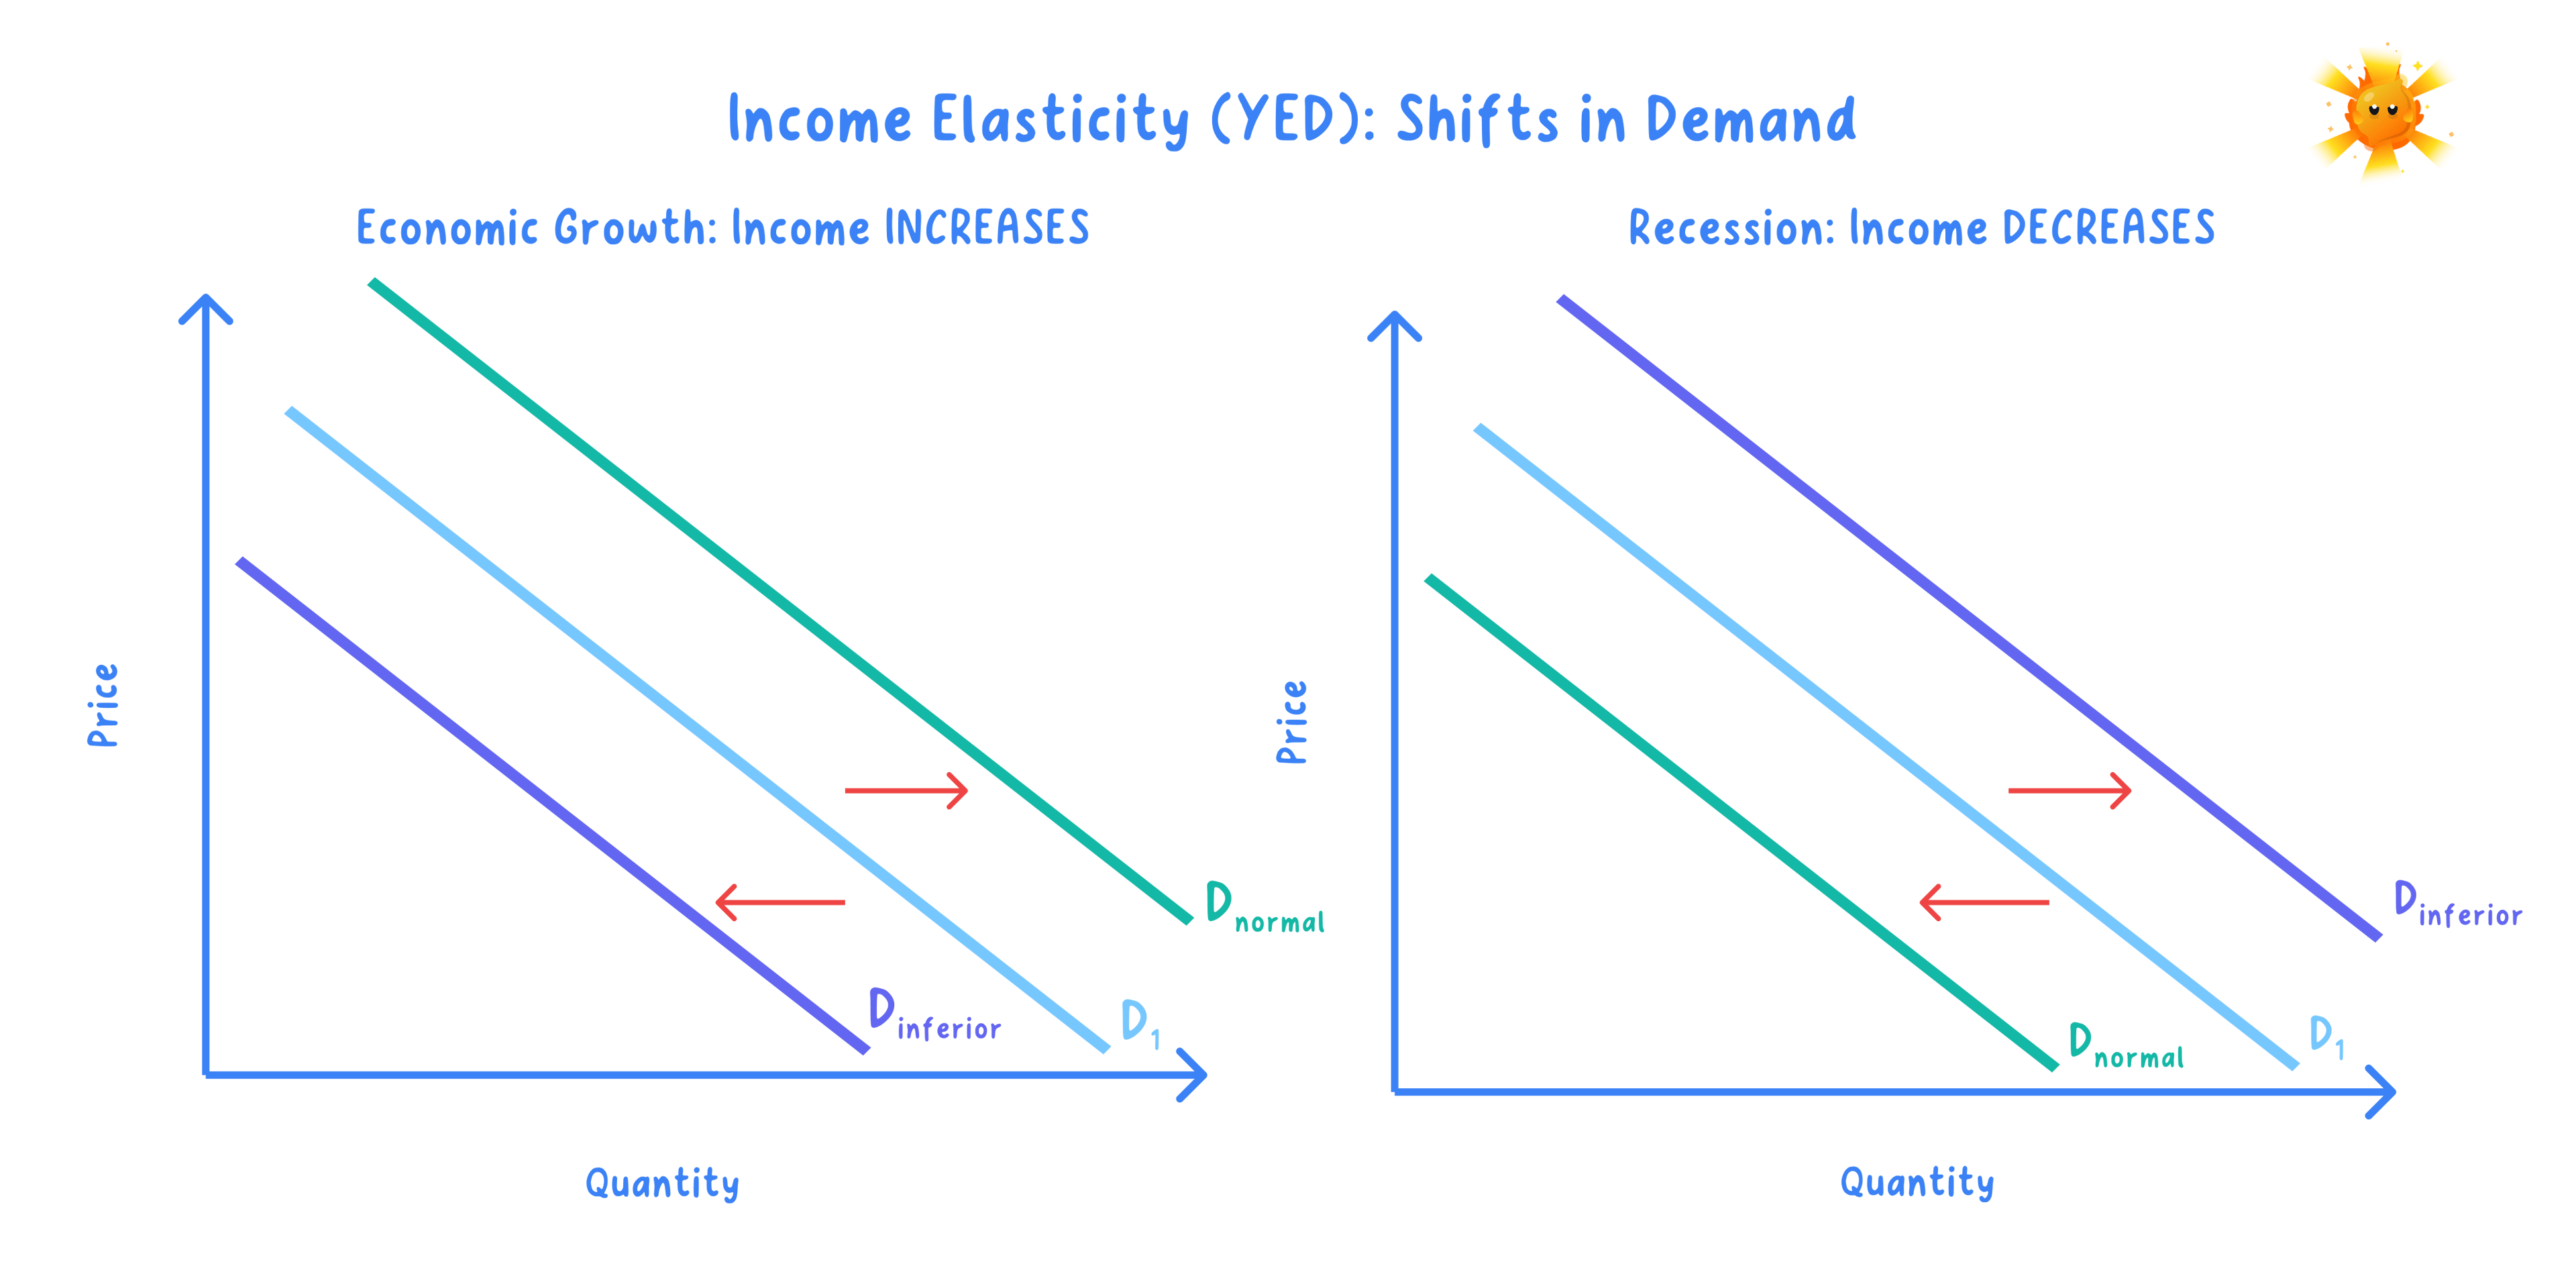
- For example, YED for foreign holidays is high and positive because they are luxuries, while YED for supermarket value ranges is negative because they are inferior goods.
- XED between two rival coffee brands is large and positive, but XED between coffee and an unrelated good such as shoes is close to zero.
- How is total revenue calculated?
- What happens to total revenue when the price of an inelastic good rises?
- At what value of PED is total revenue maximised?
- Name four determinants of price elasticity of demand.
- On what does income elasticity of demand mainly depend?
- What determines the size of cross elasticity of demand between two goods?
- A firm cuts price from £20 to £18 and sales rise from 200 to 240 units; show what happens to total revenue and why.
