The Law of Demand: Why the Curve Slopes Downward
Definition
Demand: the quantity of a good or service that consumers are willing and able to buy at a given price over a given period of time, other things being equal.
- Demand is the quantity buyers are willing and able to purchase at each price over a period.
- The law of demand says that, ceteris paribus, a lower price raises quantity demanded and a higher price lowers it.
- This inverse relationship gives the demand curve its downward slope.
Note
- Demand requires both willingness and ability to pay, not just desire.
- A change in the good's own price causes a movement along the curve, not a shift of it.
Three Effects Explain Why the Curve Slopes Downward
- Income effect
- A lower price raises a buyer's real income, or purchasing power, so they can afford more of the good; for example, when petrol prices fall, drivers have money left over and can buy more petrol as well as other goods.
- Substitution effect
- A lower price makes the good cheaper relative to its substitutes, so buyers switch towards it; for example, if Coca-Cola's price rises, some drinkers switch to Pepsi, so less Coca-Cola is demanded.
- Diminishing marginal utility
- Each extra unit consumed gives less additional satisfaction, so buyers will only take more if the price is lower; for example, the first slice of pizza is worth a lot to you, but a fourth is worth less, so you would only buy it at a lower price.
Note
- Individual demand is one buyer's demand, while market demand adds up all buyers at each price.
- The market curve is the horizontal sum of the individual curves.
Reading the Curve: Price on the Vertical Axis, Quantity Demanded on the Horizontal
- Price is on the vertical axis and quantity demanded on the horizontal axis.
- A change in the good's own price moves the buyer along the same curve.
- Only a change in a condition of demand shifts the whole curve, as set out below.

The Conditions of Demand Shift the Whole Curve
- Prices of substitutes and complements
- A rise in the price of a substitute raises demand for this good as buyers switch to it, while a rise in the price of a complement lowers it; for example, dearer coffee raises demand for tea, but dearer printers lower demand for ink cartridges.
- Real income
- For a normal good, higher real income raises demand because buyers can afford more, whereas for an inferior good higher income lowers demand as buyers trade up to better alternatives.
- Tastes and fashion
- A change in preferences moves demand up or down; for example, a health trend raises demand for gym memberships and lowers demand for sugary drinks.
- Advertising and branding
- Effective promotion makes buyers more aware of the product and more attached to it, raising demand at each price.
- Population size and age structure
- More buyers, or a larger relevant age group, raises demand; for example, an ageing population raises demand for healthcare and retirement homes.
- Expectations of future prices
- If buyers expect the price to rise soon, they bring purchases forward, so current demand rises.
Note
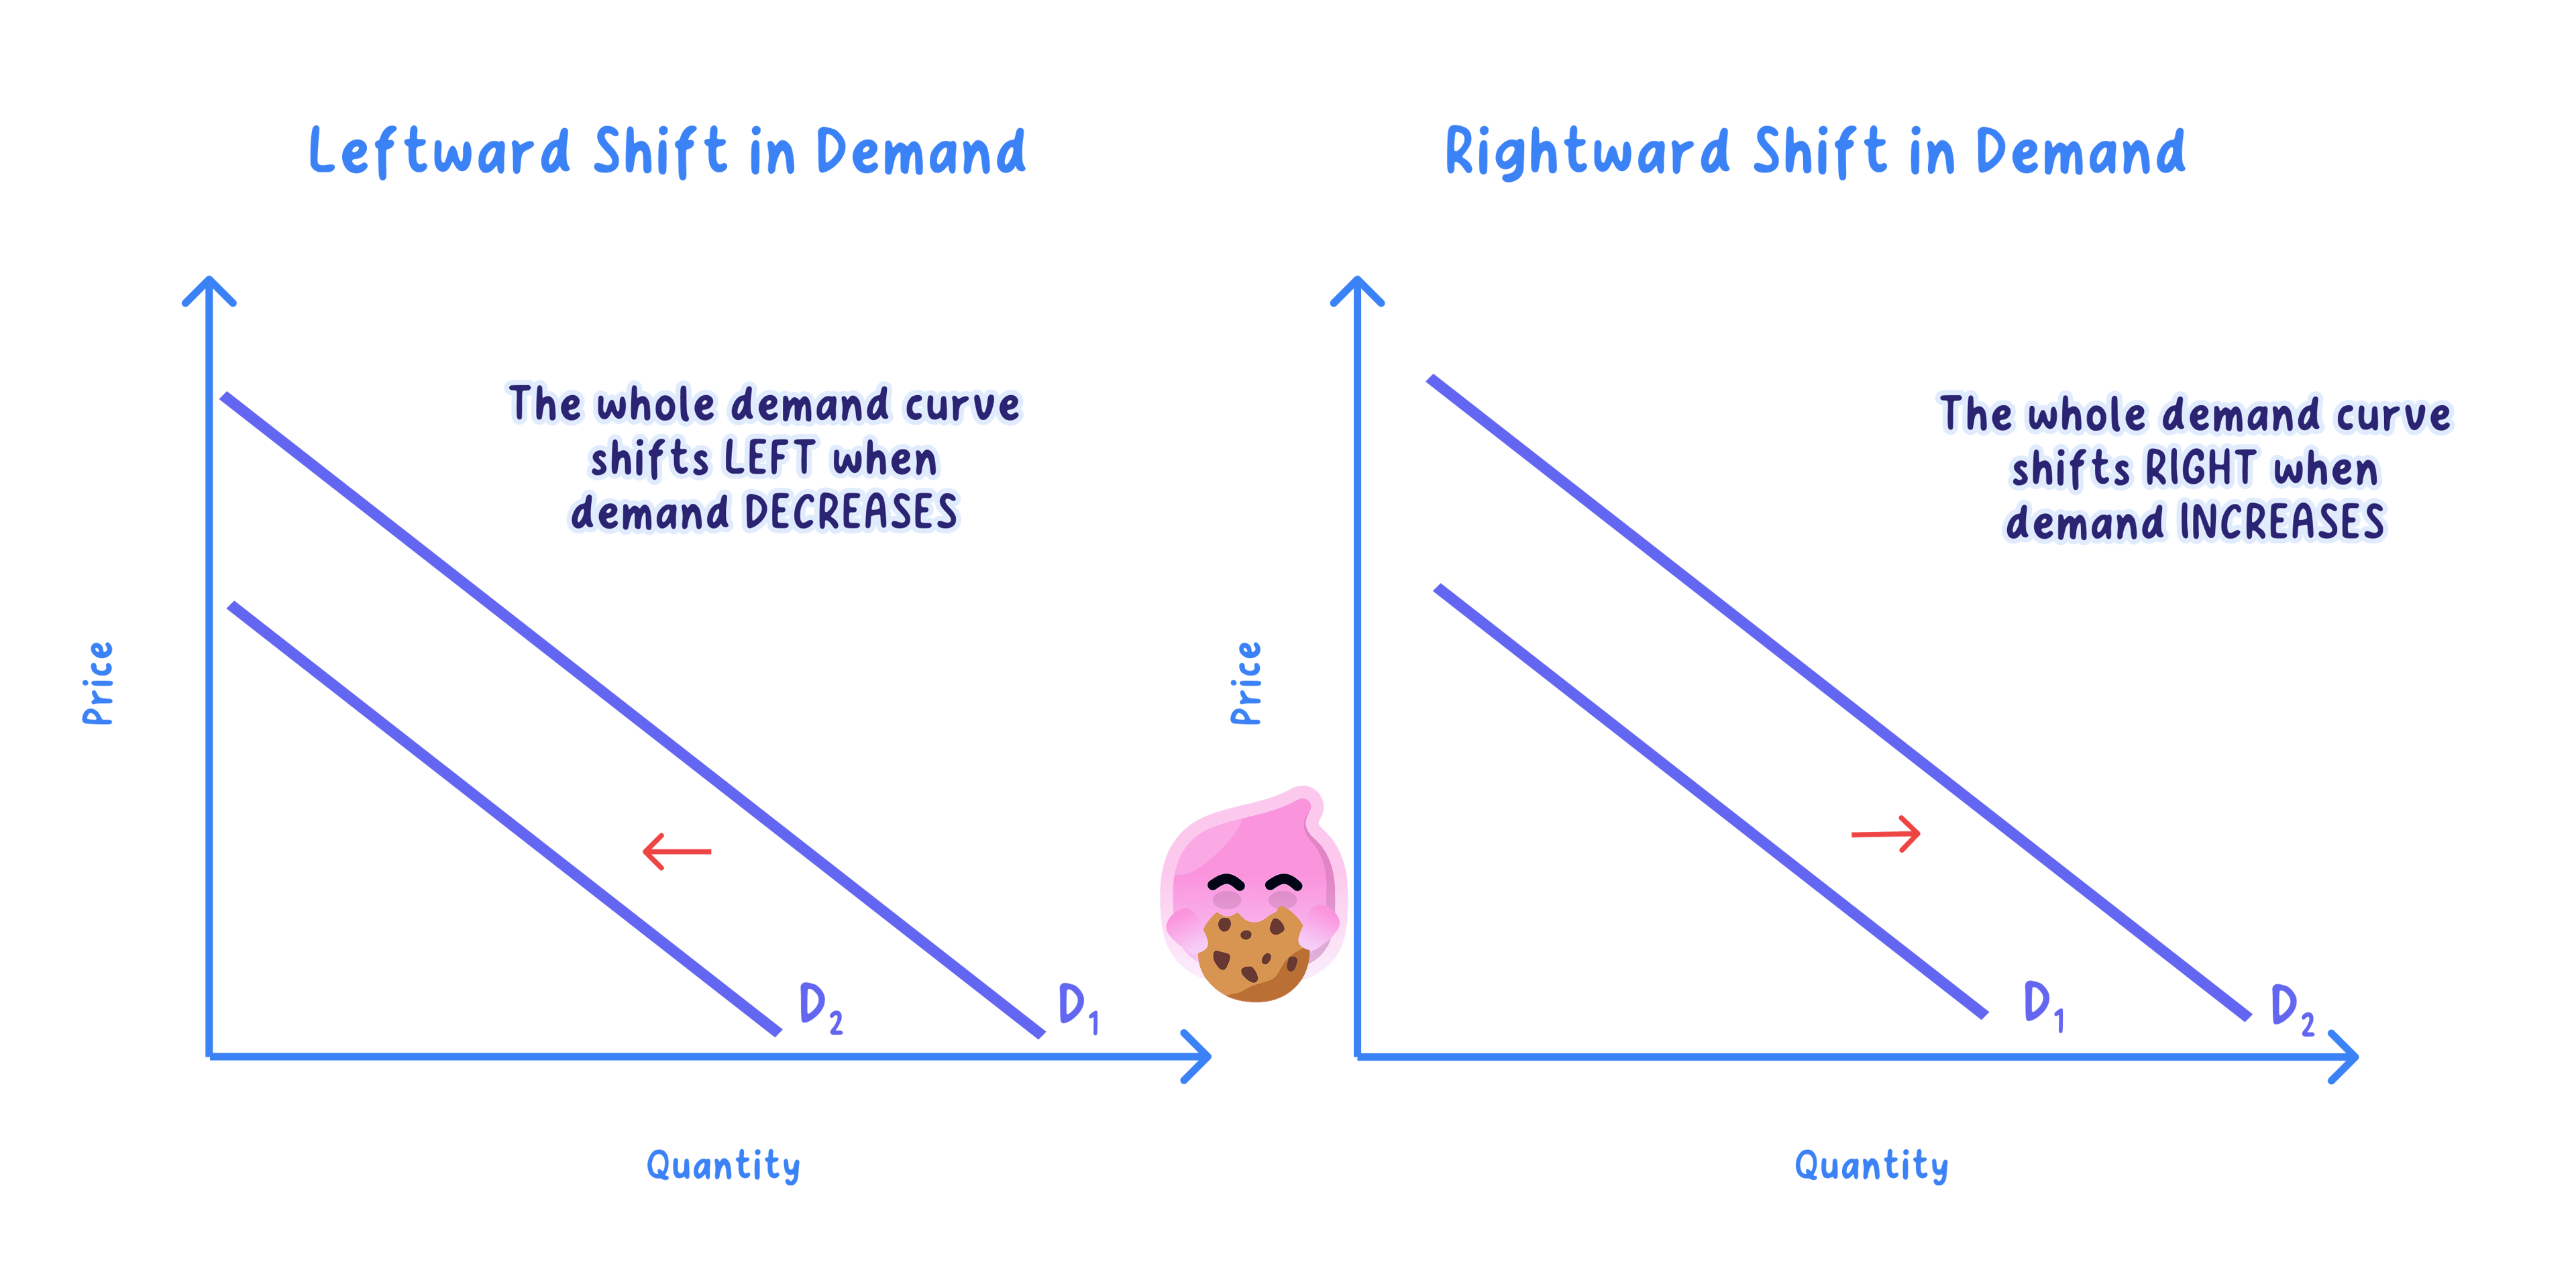
- A favourable change shifts the curve right, while an unfavourable change shifts it left.
- For example, a fall in the price of consoles, a complement, raises demand for games and shifts that curve right.
Example
- When UK petrol prices rose sharply in 2022, petrol is a complement to a petrol car, so the higher running cost reduced demand for new petrol cars.
- Electric vehicles are a substitute, so at the same time demand for EVs rose as buyers switched away from petrol models.
- On a demand diagram with price on the vertical axis and quantity on the horizontal axis, the EV demand curve shifts right from D1 to D2, so more EVs are demanded at every price, while the petrol-car curve shifts left from D1 to D2.
- Note that the trigger was the price of a related good, not the cars' own prices, which is why the whole curves shift rather than the buyer moving along one curve.
Evaluation: Does the Law of Demand Always Hold?
- For most goods the inverse relationship holds strongly.
- A few exceptions exist, such as Giffen and Veblen goods, where demand can rise with price.
- These are rare, so the downward-sloping curve remains the standard model.
Exam technique
- Justify the downward slope with the income effect, the substitution effect and diminishing marginal utility.
- Label the axes with price and quantity demanded.
- Treat a price change as a movement along the curve, never a shift.
Common Mistake
- Do not treat a change in the good's own price as shifting the demand curve.
- A change in own price is a movement along the curve, a change in quantity demanded.
- Do not define demand as mere desire.
- Demand requires both the willingness and the ability to pay.
Self review
- Define demand precisely.
- State the law of demand.
- Give the three reasons the demand curve slopes downward.
- What is the difference between individual and market demand?
- Name six conditions of demand and state whether a change in own price shifts the curve or moves along it.
