Externalities Arise When Private and Social Costs or Benefits Diverge
Definition
Externality: a cost or benefit imposed on a third party not involved in an economic transaction, causing a divergence between private and social costs or benefits.
- An externality is a spillover cost or benefit that falls on a third party, outside the market transaction.
- Social cost equals private cost plus external cost, and social benefit equals private benefit plus external benefit.
- When private and social values diverge, the free-market output is not the social optimum, so resources are misallocated.
Note
- A negative externality means marginal social cost exceeds marginal private cost, or marginal social benefit is below marginal private benefit.
- A positive externality means marginal social benefit exceeds marginal private benefit, or marginal social cost is below marginal private cost.
- Where costs or benefits spill over, the market over-produces or under-produces relative to the social optimum.
Negative Externalities Lead to Over-Production
- A negative externality imposes costs on third parties.
- In production, marginal social cost exceeds marginal private cost.
- In consumption, marginal social benefit is below marginal private benefit.
- So the market over-produces or over-consumes.
Example
- A factory emitting smoke imposes costs on nearby residents.
- Traffic causes congestion for other road users.
- Passive smoking imposes costs on bystanders.
Positive Externalities Lead to Under-Provision
- A positive externality confers benefits on third parties.
- In consumption, marginal social benefit exceeds marginal private benefit, as with vaccination or education.
- In production, marginal social cost lies below marginal private cost, as with firm training or research and development.
- So the free market under-produces or under-consumes, below the social optimum.
Example
- A vaccination protects others as well as the person who receives it.
- Education raises a worker's productivity and benefits wider society.
- Research and development by one firm spills over to others.
The Diagram Shows the Gap Between the Market Output and the Social Optimum
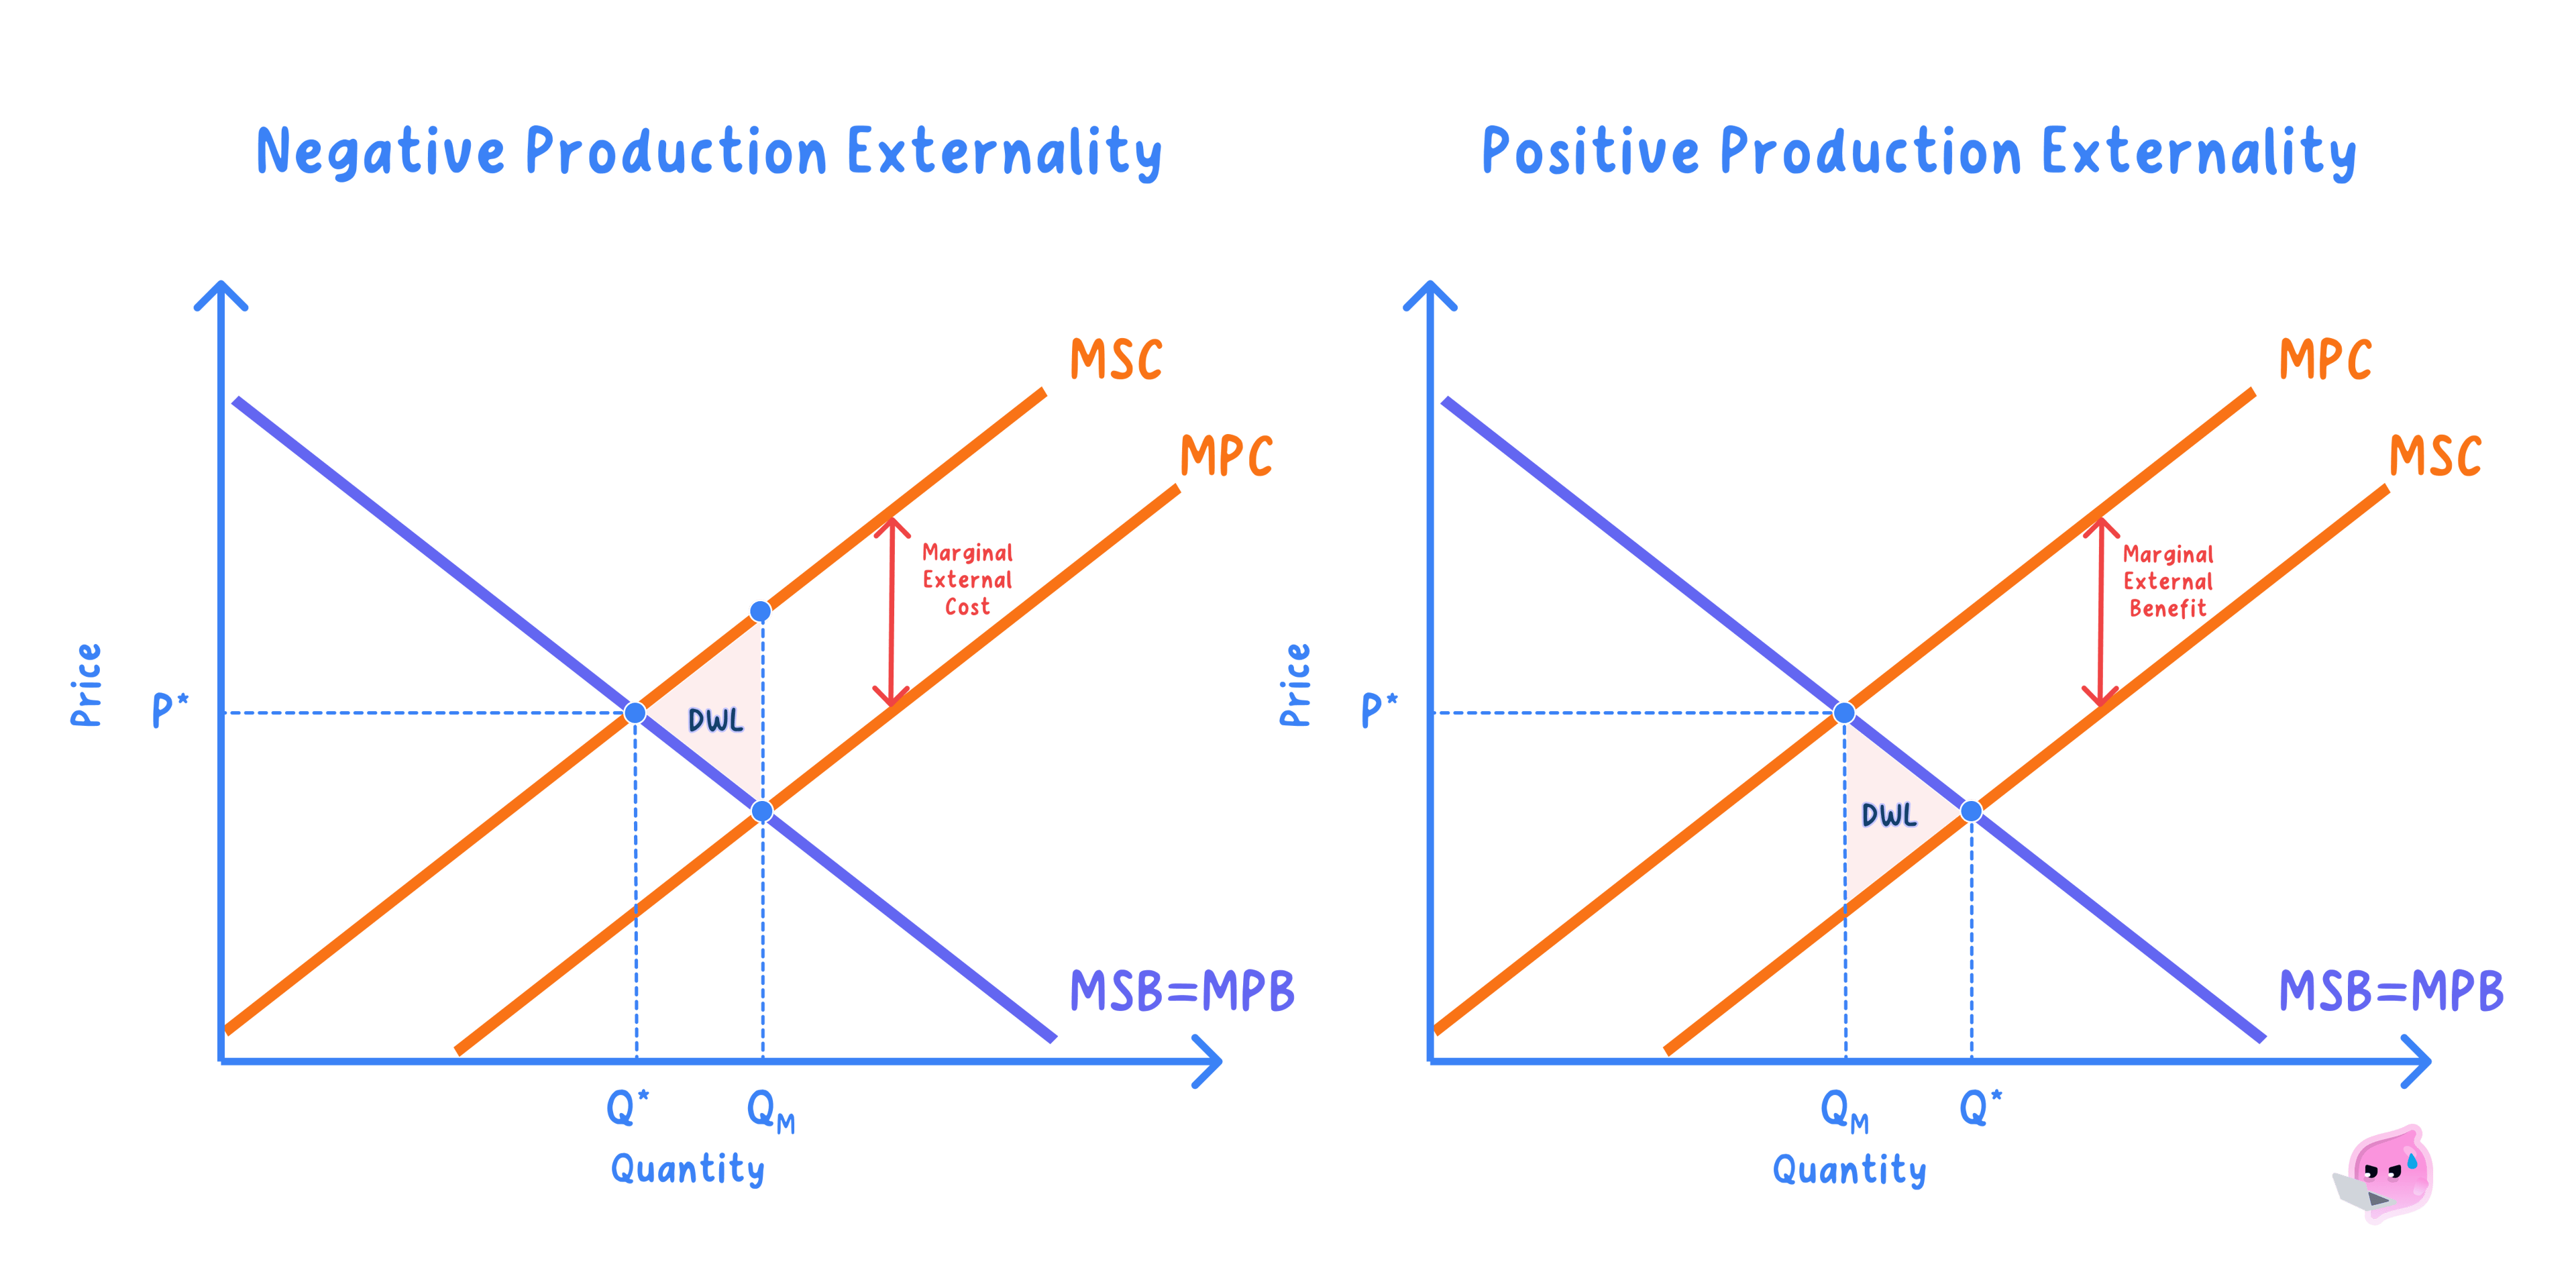
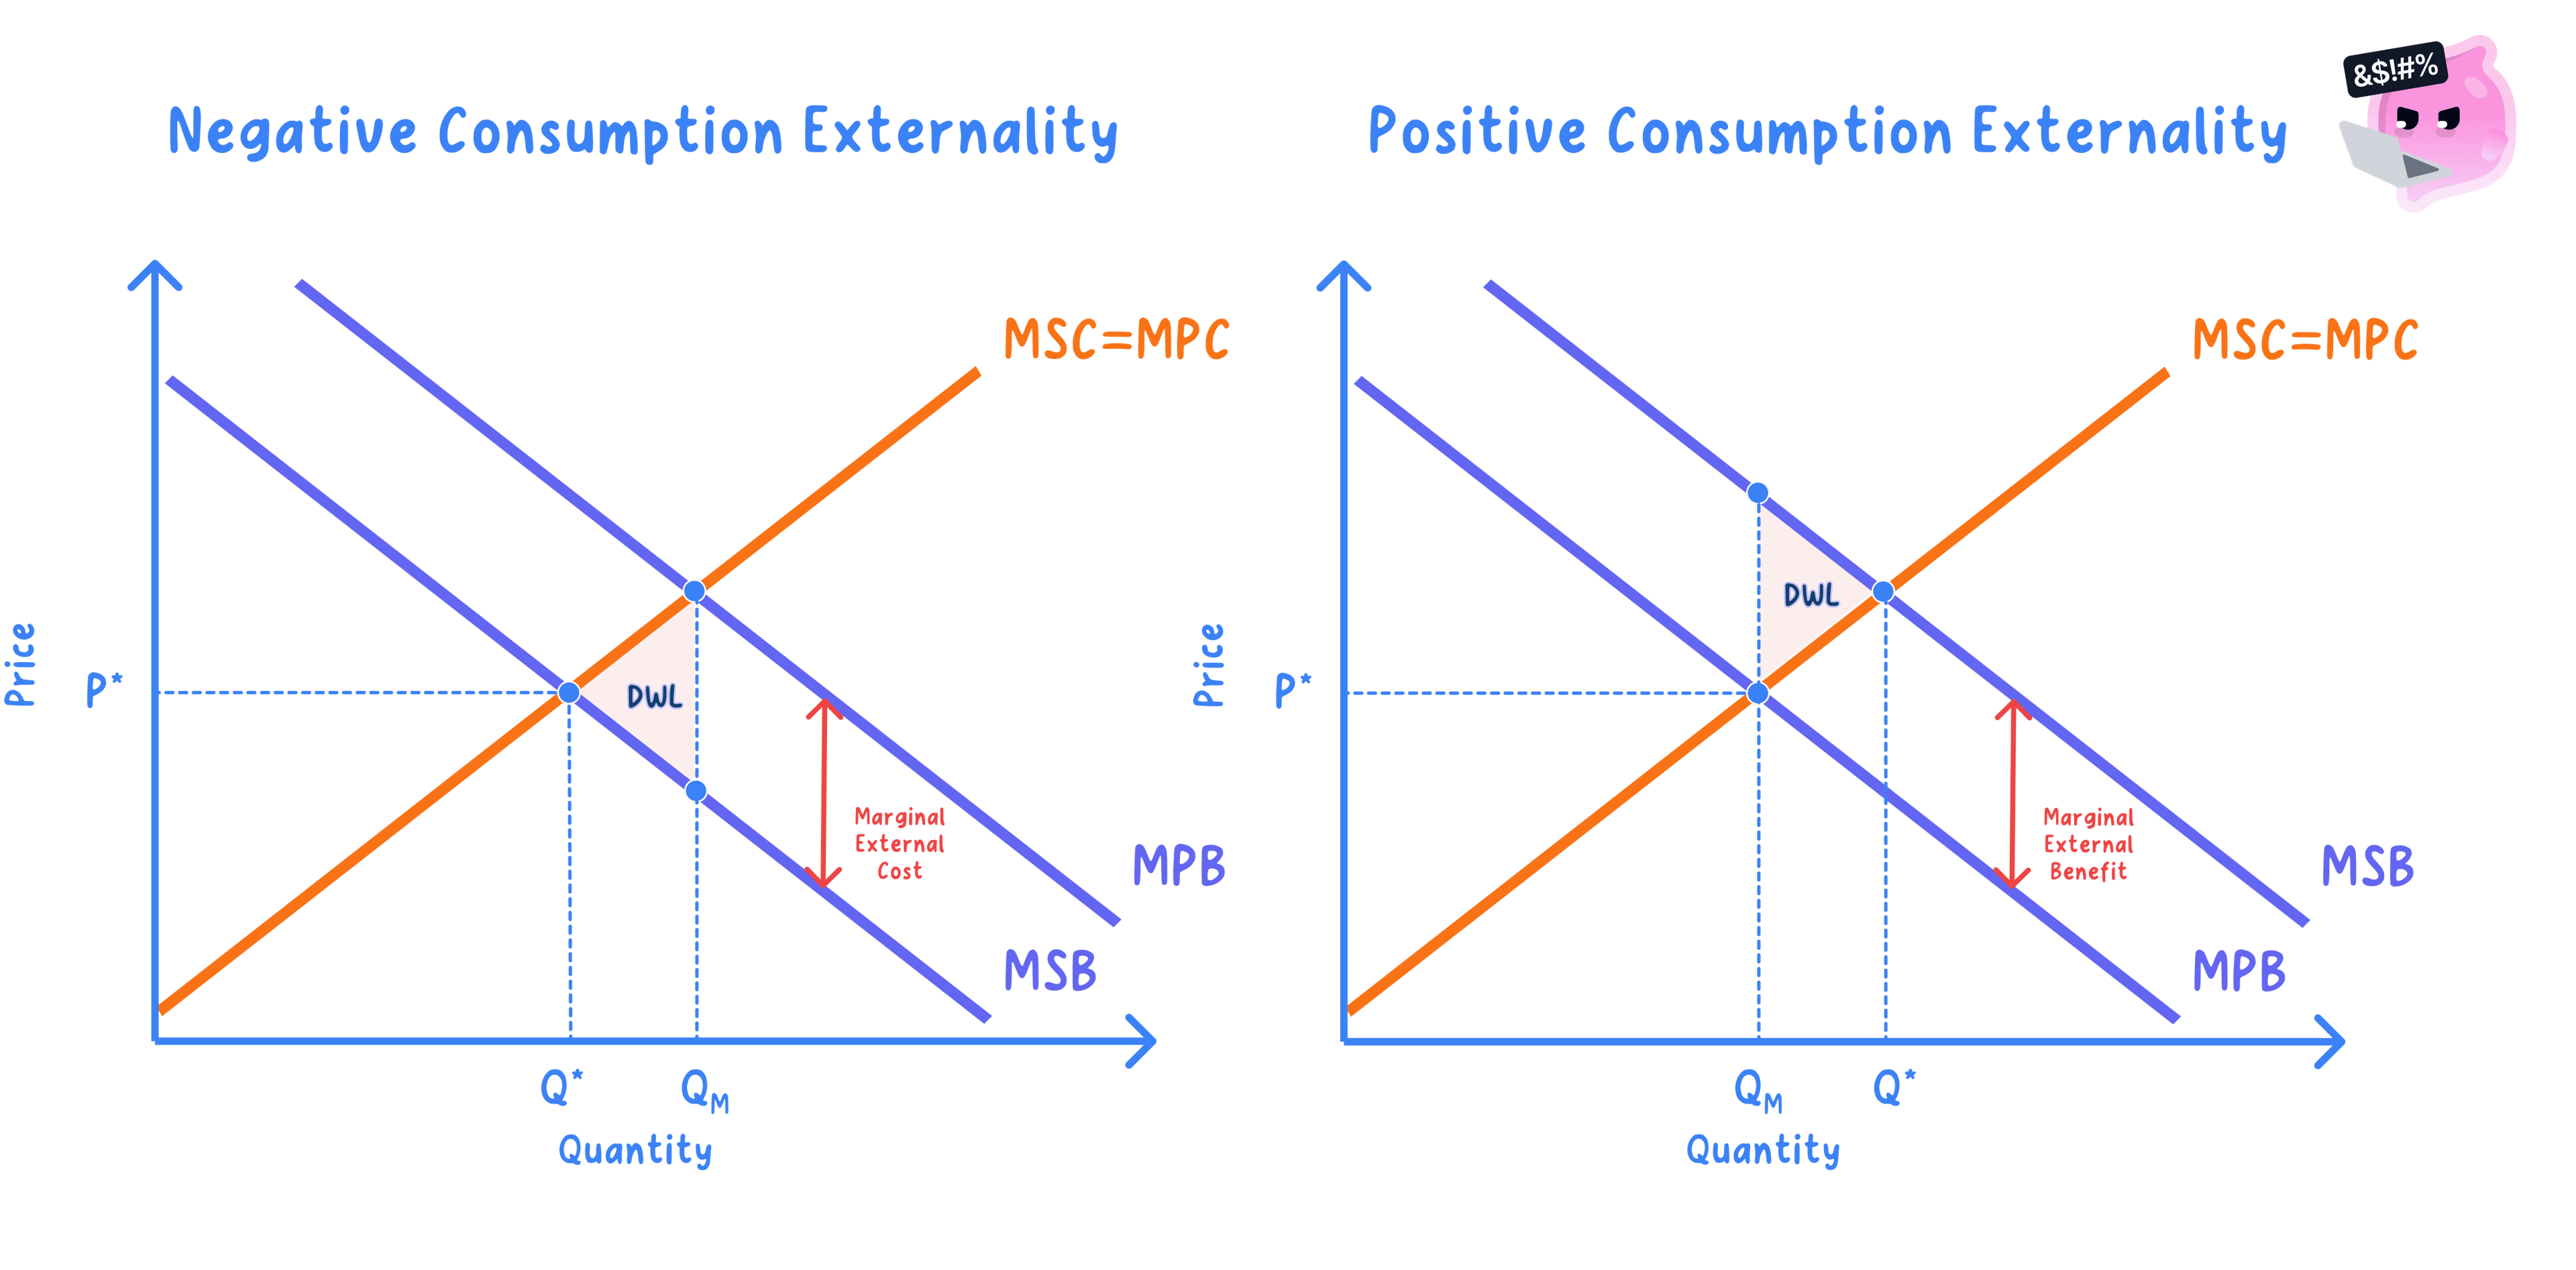
- The vertical axis shows costs and benefits, the horizontal axis output.
- The free-market output is where the private curves cross.
- The social optimum is where the social curves cross.
- For a negative production externality, marginal social cost lies above marginal private cost, so the free-market output is too high.
- For a positive consumption externality, marginal social benefit lies above marginal private benefit, so the free-market output is too low.
Case study
- London introduced a congestion charge to price road use.
- The charge makes drivers face more of the external cost.
- So output moves closer to the social optimum.
Missing Property Rights Are a Root Cause of Externalities
- Externalities often exist because property rights over a resource are absent or poorly defined.
- When no one owns the air, a river or the peace of a neighbourhood, no one can charge those who damage it.
- Producers and consumers then ignore these external costs, so goods with negative externalities are over-produced.
- Missing rights also leave external benefits unrewarded, so goods with positive externalities are under-produced.
- This is why assigning or extending property rights is one way to correct externalities.
The Welfare Loss Measures the Cost of the Misallocation
- Output beyond the social optimum adds more cost than benefit.
- These extra units create a deadweight welfare loss.
- The loss is shown as a triangle between the private and social curves.
- So over-production, or under-production, reduces total welfare.
Work Through the Negative Production Externality Diagram Step by Step
- Label the vertical axis price and cost, and the horizontal axis quantity.
- Draw marginal private cost (MPC) as the industry supply curve, and draw demand as marginal private benefit (MPB), which here equals marginal social benefit (MSB) since there is no consumption externality.
- Draw marginal social cost (MSC) above MPC throughout, with the vertical gap between the two curves equal to the external cost imposed on third parties.
- Mark the free-market output at Q1Q_1Q1, where MPC crosses MPB, since firms and consumers weigh only private costs and benefits.
- Mark the social optimum at Q∗Q^*Q∗, where MSC crosses MSB (which equals MPB), since this is the output at which the full cost to society just equals the full benefit.
- Because MSC lies above MPC, Q∗Q^*Q∗ sits to the left of Q1Q_1Q1, so Q1Q_1Q1 is greater than Q∗Q^*Q∗, and the free market over-produces relative to the social optimum.
- Shade the deadweight welfare-loss triangle between the MSC curve and the MSB curve over the range from Q∗Q^*Q∗ to Q1Q_1Q1, since every unit produced beyond Q∗Q^*Q∗ costs society more than it is worth.
Example
- A factory polluting a river is a classic case: private producers keep making units up to Q1Q_1Q1 because they never pay the clean-up cost, so the shaded triangle from Q∗Q^*Q∗ to Q1Q_1Q1 measures the welfare lost each period from that over-production.
Mirror the Diagram for a Positive Externality to Show Under-Production
- For a positive consumption externality, draw marginal private cost equal to marginal social cost (MPC=MSC\text{MPC} = \text{MSC}MPC=MSC), since there is no production externality.
- Draw marginal private benefit (MPB) as demand, and draw marginal social benefit (MSB) above it, with the gap equal to the external benefit enjoyed by third parties.
- Mark the free-market output at Q1Q_1Q1, where MPC crosses MPB, since consumers only weigh the benefit to themselves.
- Mark the social optimum at Q∗Q^*Q∗, where MSC crosses MSB, since this is the output at which the full social benefit just equals the full cost.
- Because MSB lies above MPB, Q∗Q^*Q∗ sits to the right of Q1Q_1Q1, so Q1Q_1Q1 is less than Q∗Q^*Q∗, and the free market under-produces, or under-consumes, relative to the social optimum.
- Shade the welfare-loss triangle between the MSB curve and the MSC curve over the range from Q1Q_1Q1 to Q∗Q^*Q∗, since each unit in that range would have added more benefit to society than it cost.
Example
- Vaccination fits this pattern: individuals under-vaccinate at Q1Q_1Q1 because they weigh only their own protection, so the triangle from Q1Q_1Q1 to Q∗Q^*Q∗ measures the herd-immunity benefit that is never realised without a subsidy or public programme.
Correcting an Externality Can Raise Welfare but Is Not Costless
- A tax, subsidy or extension of property rights can internalise the externality and shift output towards the social optimum, recovering the deadweight welfare loss.
- Against this, the external cost or benefit is hard to value precisely, so a correction set at the wrong level can overshoot or undershoot the optimum and leave a residual misallocation.
- Intervention also carries administrative and enforcement costs and can trigger government failure or unintended consequences that offset the welfare gain.
- The size of any gain depends on elasticity, since a tax on an inelastic good cuts output little and mainly raises revenue rather than correcting the externality.
- On balance, correcting an externality is justified when the welfare gain clearly exceeds these costs, so the deciding factor is how accurately the externality can be valued and how cheaply the correction can be delivered.
Draw Both Outputs and Shade the Welfare Loss
Exam technique
- Draw the private and social curves and mark both the market output and the social optimum.
- Shade the welfare-loss triangle relative to the social optimum.
- Use a real context such as pollution, congestion or vaccination.
Common Mistake
- Do not place the welfare loss on the wrong side of the social optimum.
- Do not omit the external cost or external benefit curve.
- Do not treat positive externalities as harmless; under-provision is still a market failure.
Self review
- What is the difference between a private cost, an external cost and a social cost?
- Why do negative externalities lead to over-production?
- Why do positive externalities lead to under-provision?
- How does the absence of property rights cause externalities?
- Where is the welfare loss shown on the diagram?
- In the negative production externality diagram, why is Q1Q_1Q1 greater than Q∗Q^*Q∗, and in the positive externality mirror, why is Q1Q_1Q1 less than Q∗Q^*Q∗?
