Total, Average and Marginal Revenue: Three Views of the Same Sales
Definition
Marginal revenue: the addition to total revenue from selling one more unit of output.
- Total revenue is price times quantity sold.
- Average revenue is revenue per unit, which equals price.
- Marginal revenue is the change in total revenue from selling one more unit.
Note
- The average revenue curve is the firm's demand curve.
- For a price-taker AR equals MR equals price, while for a price-maker MR lies below AR.
How Total and Marginal Revenue Move Together
- Total revenue rises while marginal revenue stays positive.
- Total revenue peaks when marginal revenue is zero.
- For a price-maker, cutting price to sell more pulls marginal revenue below price.
Example
- Take a straight-line demand curve where price is £9\pounds 9£9 at 1 unit and falls by £1\pounds 1£1 for each extra unit sold, so prices run 9,8,7,6,59, 8, 7, 6, 59,8,7,6,5.
- Total revenue (price times quantity) is then 9,16,21,24,259, 16, 21, 24, 259,16,21,24,25, so marginal revenue, the change in total revenue, is 9,7,5,3,19, 7, 5, 3, 19,7,5,3,1.
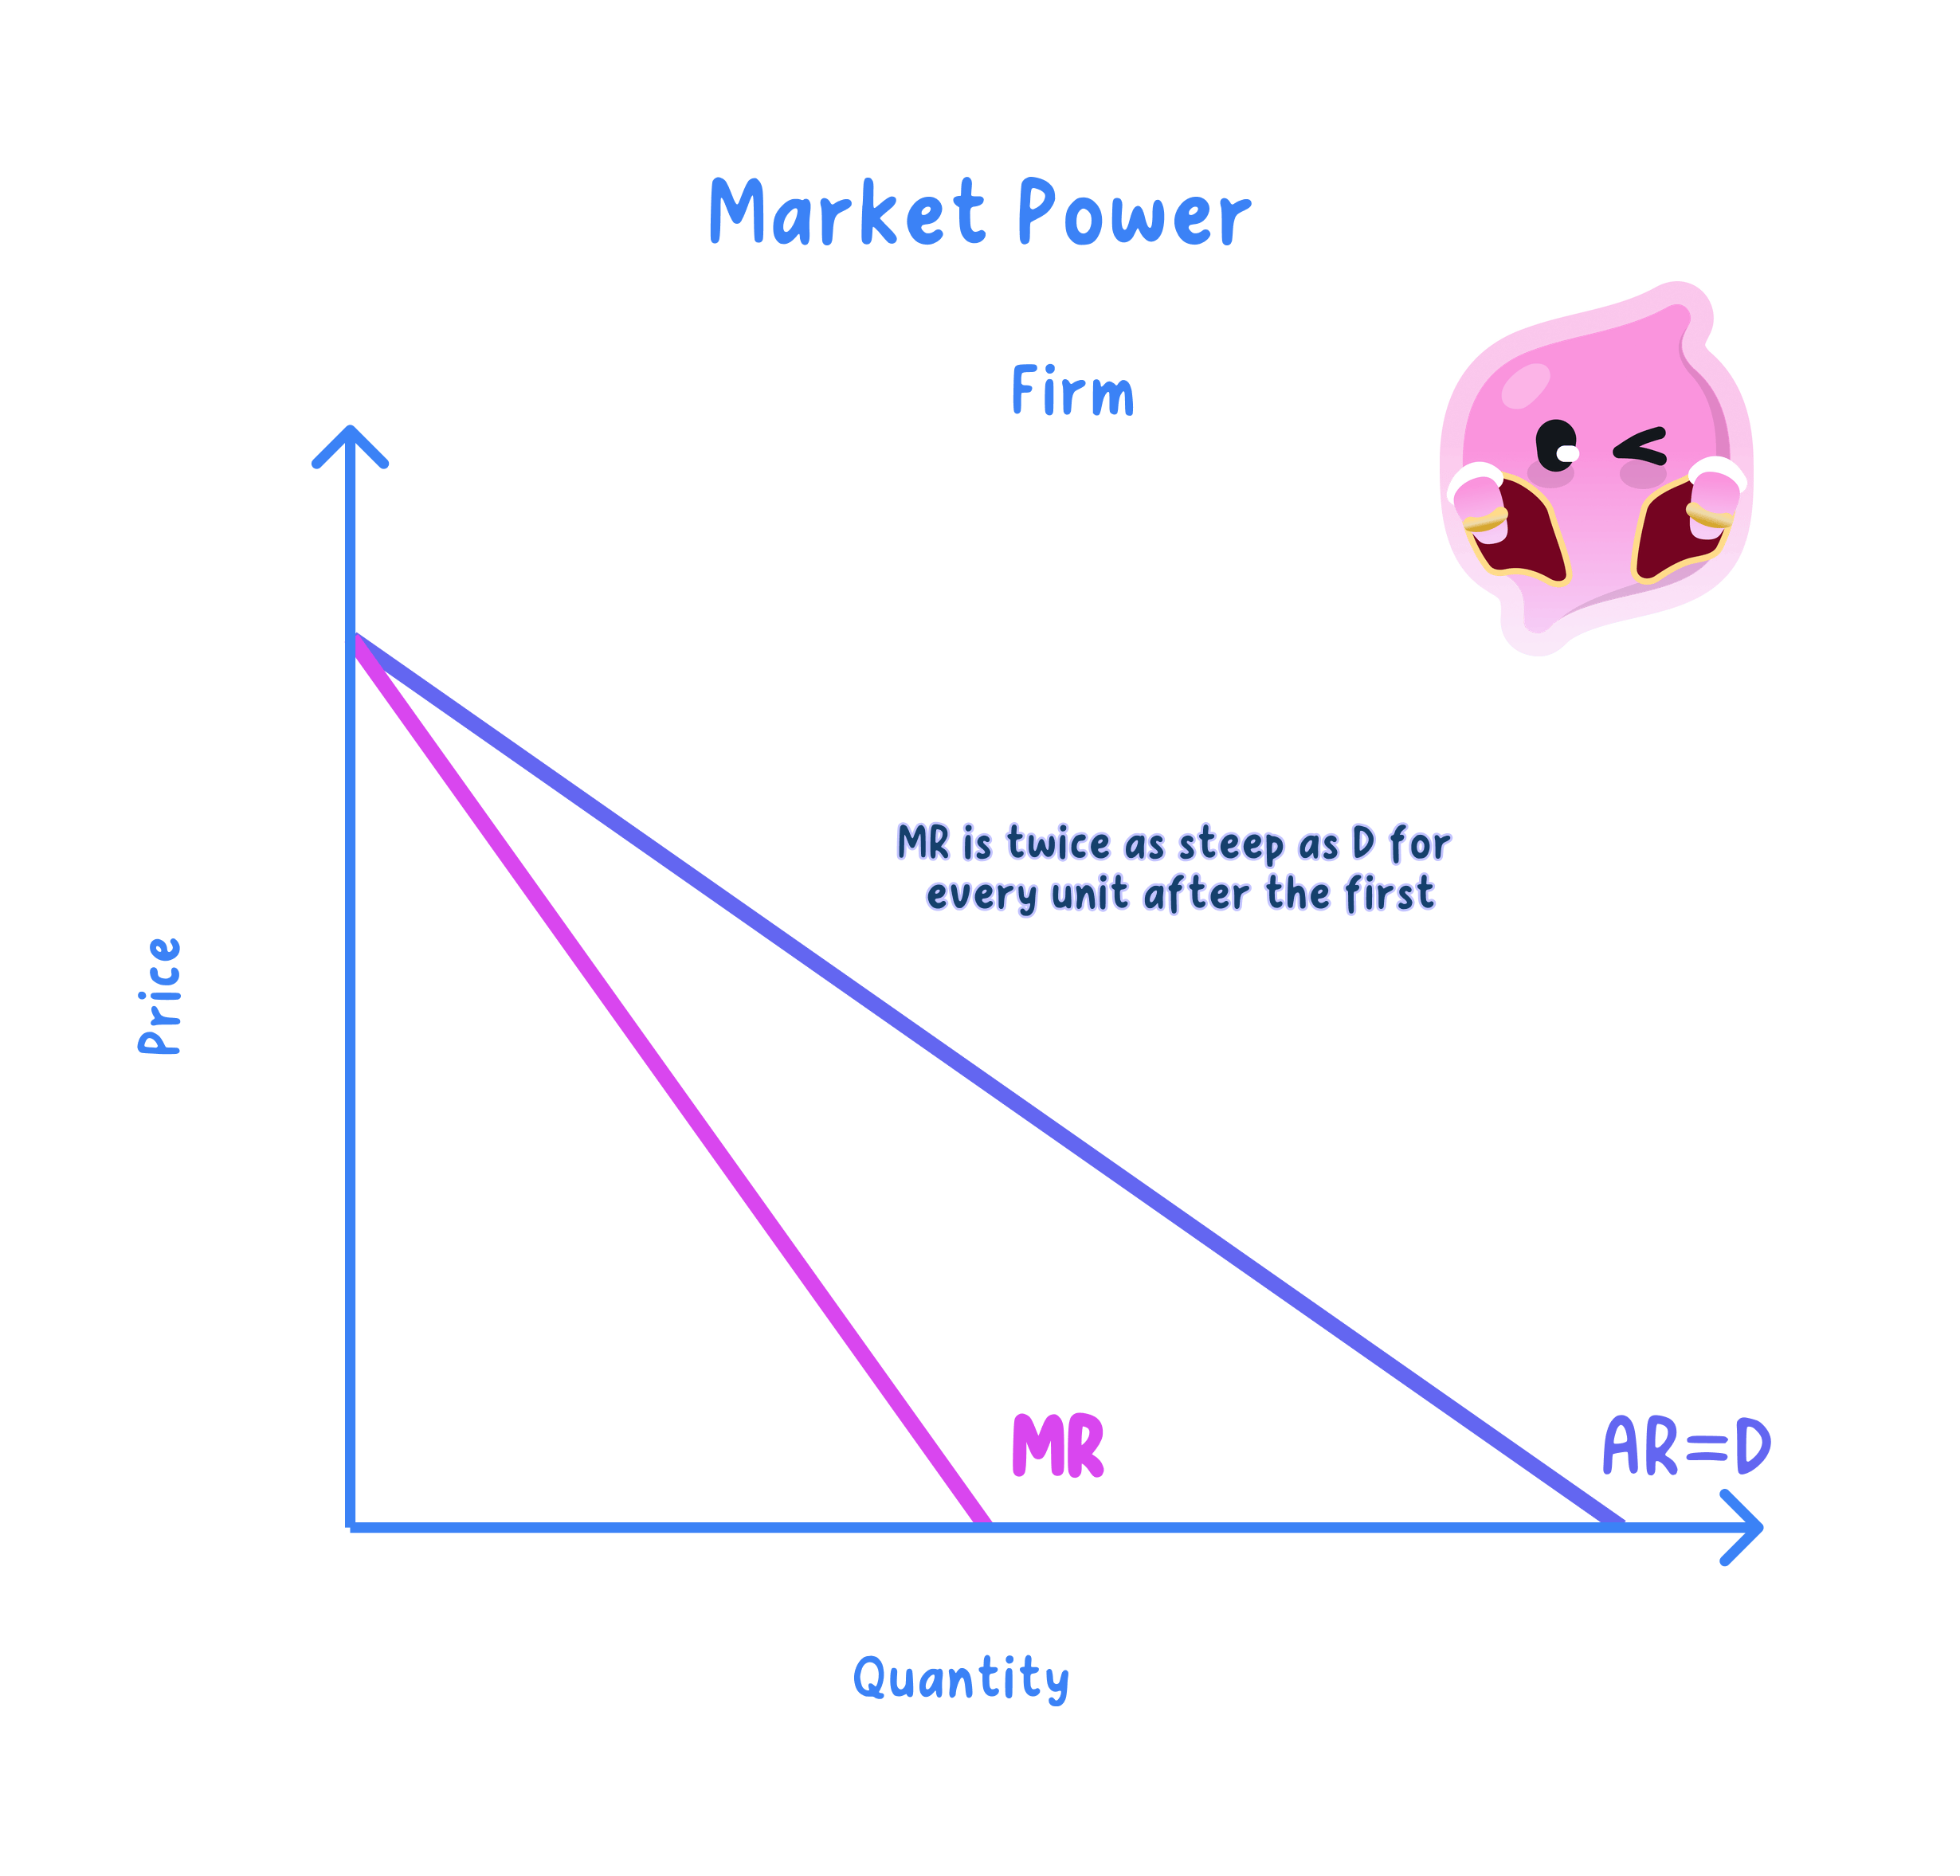
- Average revenue falls by £1\pounds 1£1 a unit but marginal revenue falls by £2\pounds 2£2 a unit, so MR falls twice as fast, which is why the MR line is twice as steep as AR and hits the axis at half the quantity.
- Total revenue peaks at 5 units (£25)(\pounds 25)(£25), where marginal revenue is approaching zero (MR is +£1+\pounds 1+£1 on the 5th unit and turns negative on the 6th); sell a 6th unit at £4\pounds 4£4 and MR turns negative, so total revenue falls.
Why AR Is the Demand Curve
- Average revenue is total revenue divided by quantity, and because total revenue is price times quantity, this cancels down to price: AR=TRQ=P×QQ=P\text{AR}=\dfrac{\text{TR}}{Q}=\dfrac{P\times Q}{Q}=PAR=QTR=QP×Q=P.
- The demand curve shows the price at which each quantity can be sold, so at every level of output that price is exactly the firm's average revenue.
- Since AR equals price at every quantity, the AR curve traces out the same line as the demand curve.
Check Price-Taker Versus Price-Maker
Exam technique
- For a price-taker, set AR equal to MR equal to price, so both are a horizontal line.
- For a price-maker, draw MR below AR and twice as steep, cutting the quantity axis halfway along the AR line.
Common Mistake
- Do not assume marginal revenue always equals price.
- That holds only for a price-taker, while for a price-maker MR lies below AR.
Self review
- Define total, average and marginal revenue.
- Why is the AR curve the demand curve?
- When does AR equal MR?
- What is marginal revenue when total revenue peaks?
- If price falls by £1\pounds 1£1 for each extra unit from £9\pounds 9£9 at 1 unit, work out MR for the first four units and show it falls by £2\pounds 2£2 each time.
