2.3.3a Concepts and causes of inflation
Inflation, Deflation and Disinflation Each Describe a Different Movement in the Price Level
Definition
Inflation: a sustained rise in the general price level over time, which reduces the purchasing power of money; it differs from deflation, a sustained fall in the price level, and disinflation, a fall in the rate of inflation.
- Inflation is a sustained rise in the general price level.
- Deflation is a sustained fall in the general price level.
- Disinflation is a fall in the rate of inflation, so prices still rise but more slowly.
Note
- As the price level rises, the purchasing power of money falls.
- A one-off price rise is not the same as sustained inflation.
What Each Term Means in Practice
- Inflation means prices are rising over time.
- Deflation means prices are actually falling.
- Disinflation means prices still rise, but at a slower rate.
Example
- Inflation falling from 6 per cent to 3 per cent is disinflation.
- Prices dropping below last year's level is deflation.
Example
- Worked example: the Consumer Prices Index (CPI) tracks the price of a typical basket of goods, set to 100 in the base year.
- If the CPI rises from 100 to 104 over a year, the inflation rate is the percentage change in the index: 104−100100×100=4%\dfrac{104-100}{100}\times 100 = 4\%100104−100×100=4%.
- If the next year the CPI rises from 104 to 106.6, inflation is 106.6−104104×100=2.5%\dfrac{106.6-104}{104}\times 100 = 2.5\%104106.6−104×100=2.5%.
- Inflation has fallen from 4% to 2.5%, but the index is still rising, so this is disinflation, not deflation: the index would have to fall below 106.6 for prices to be deflating.
Why Inflation Erodes the Value of Money
- When the price level rises, each pound buys less.
- So inflation erodes the real value of money.
- This is why price stability is a policy goal.
Keep the Three Terms Distinct
Exam technique
- Define inflation, deflation and disinflation separately.
- Stress that disinflation still means rising prices.
Common Mistake
- Do not confuse deflation with disinflation.
- Deflation is falling prices; disinflation is slower inflation.
Demand, Costs and the Money Supply All Drive Changes in the Price Level
- Demand-pull inflation comes from excess aggregate demand pulling up prices.
- Cost-push inflation comes from rising costs pushing up prices.
- A monetary explanation adds excessive growth of the money supply.
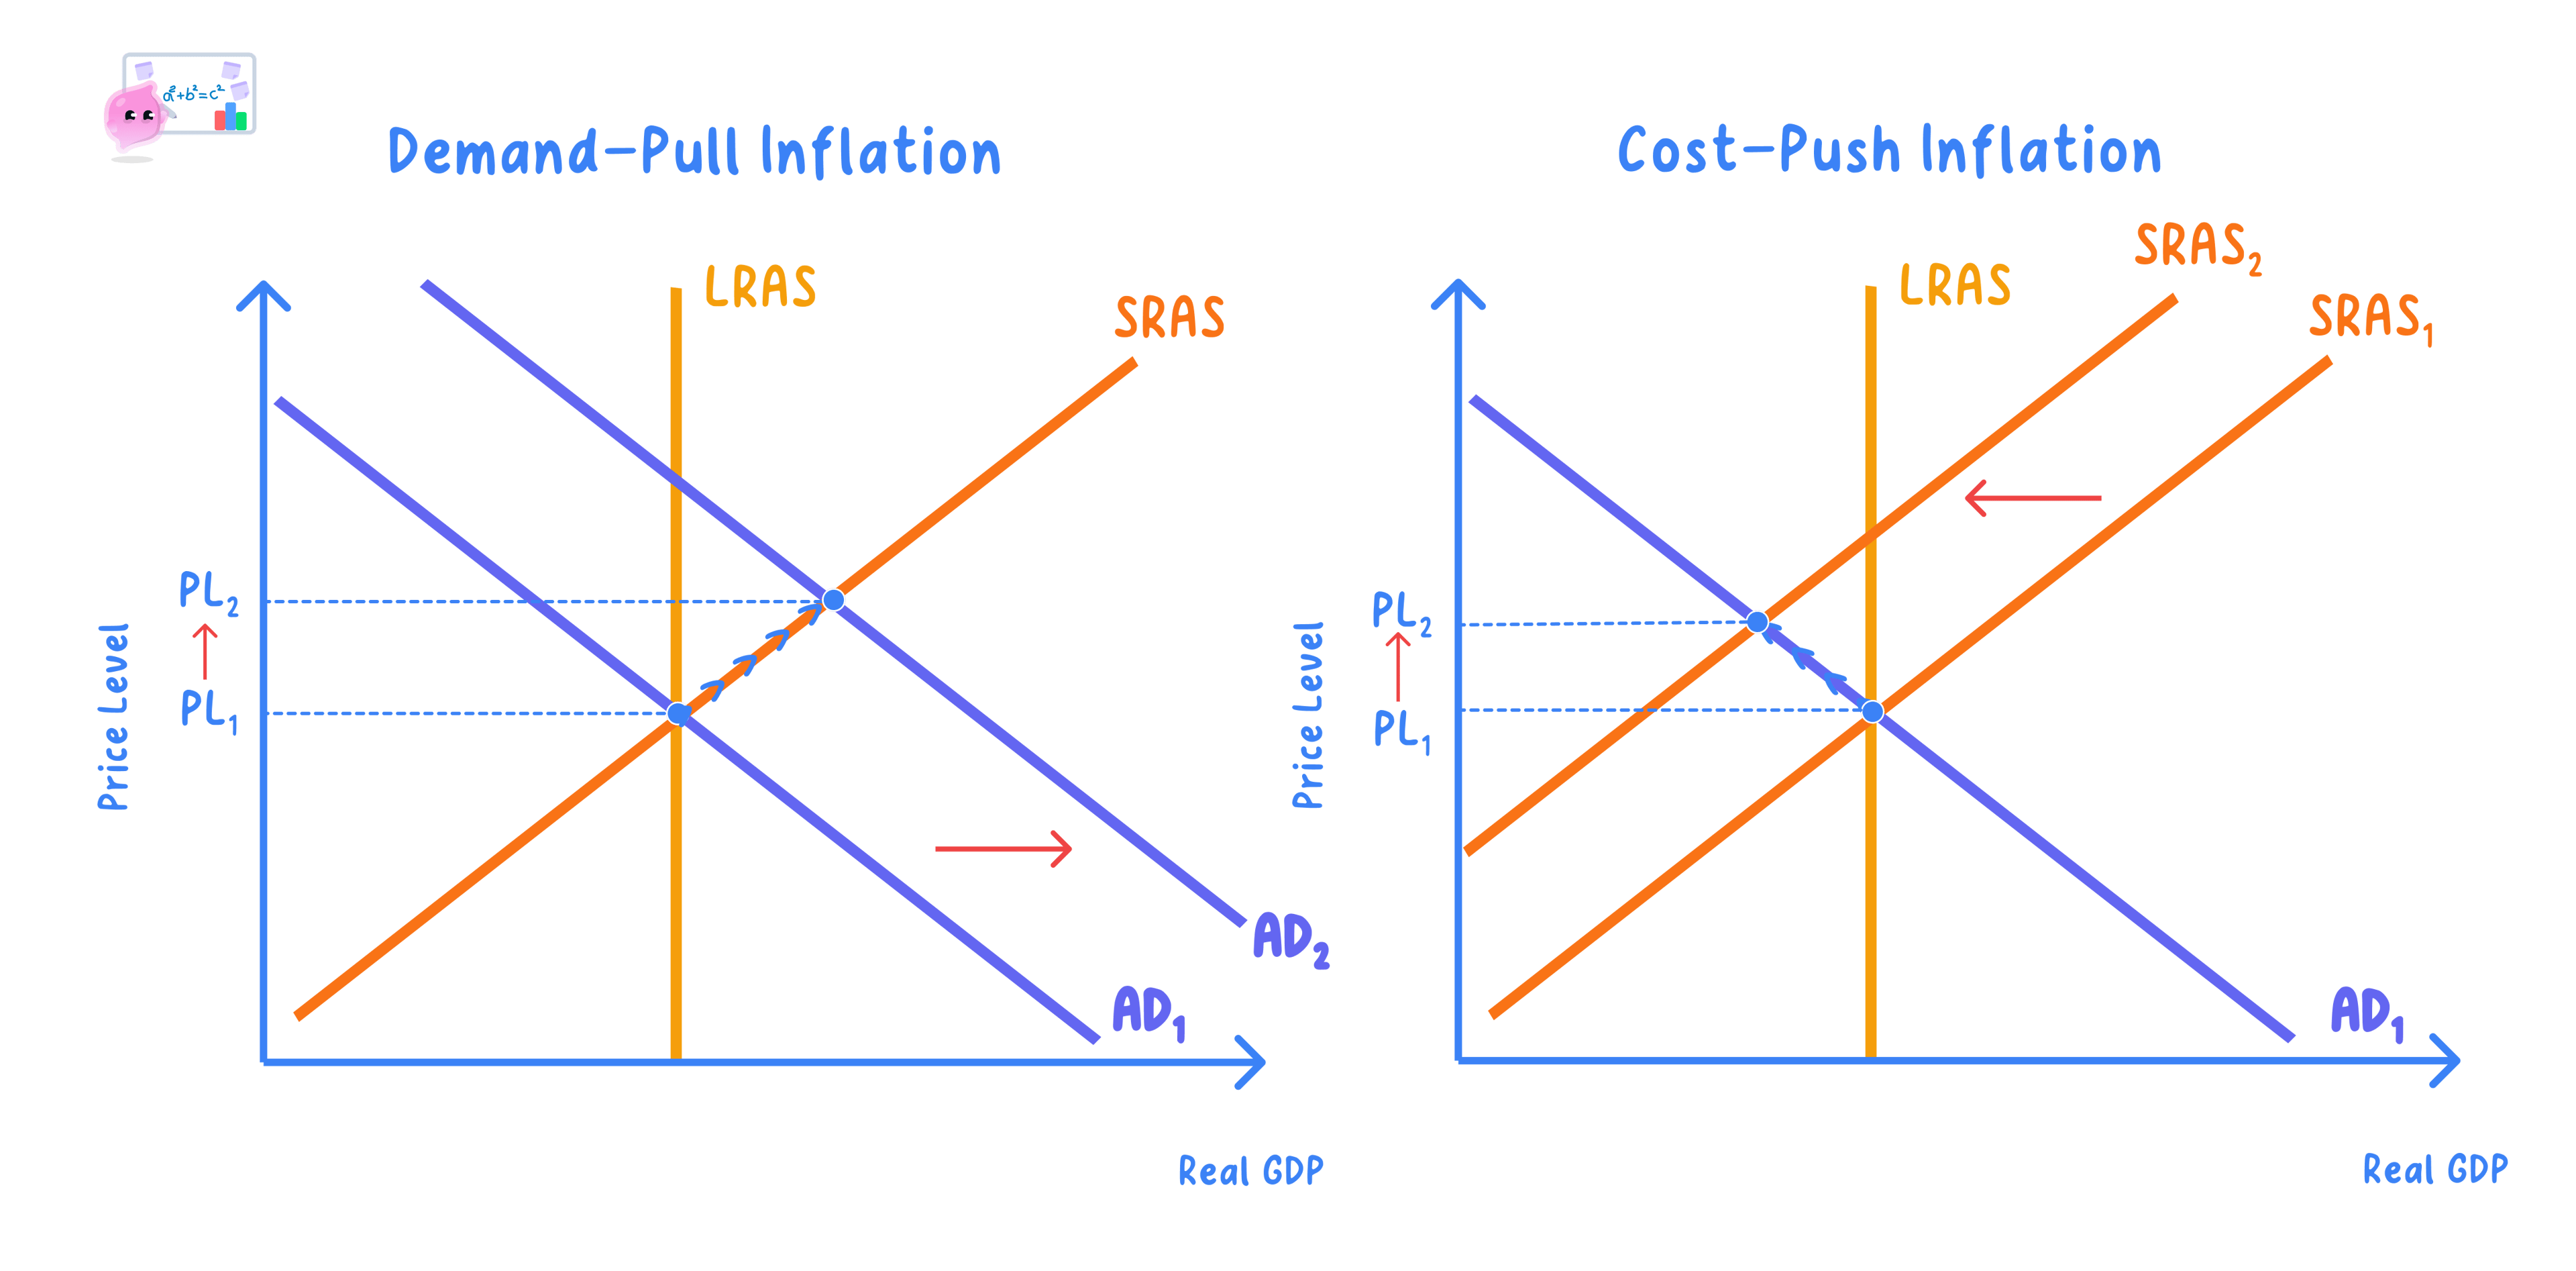
Note
- Demand-pull is shown as a rightward shift of aggregate demand.
- Cost-push is shown as a leftward shift of short-run aggregate supply.
How Each Cause Works
- Strong spending can pull prices up when the economy nears capacity.
- Rising wages or imported costs push firms' costs and prices up.
- Expectations of higher prices can feed further inflation.
Example
- A consumer boom can drive demand-pull inflation.
- A jump in imported energy prices can drive cost-push inflation, as in the 2022 energy price spike.
What Causes Deflation
- Deflation can come from falling aggregate demand.
- It can also come from rising aggregate supply or a falling money supply.
- So the same tools explain prices rising or falling.
Match the Cause to the Diagram
Exam technique
- Show demand-pull as an AD shift and cost-push as an AS shift, with the average price level and real output on the axes.
- Name the driver behind the shift.
Common Mistake
- Do not attribute all inflation to demand.
- Cost-push shocks on the supply side matter too.
Expectations Can Make Inflation Self-Fulfilling
- If workers and firms expect higher inflation, they build it into wage claims and price rises.
- Those higher wages and prices then become actual inflation, so the expectation is self-fulfilling.
- This can create a wage-price spiral that makes inflation persistent and harder to reduce.
- Anchoring expectations near the target is therefore a key aim of monetary policy.
Note
- Because expectations feed directly into wage and price setting, a credible inflation target helps keep actual inflation low.
The Quantity Theory of Money Links the Money Supply to the Price Level
- The quantity theory of money links the money supply to the price level.
- It uses Fisher's equation of exchange, MV=PQMV = PQMV=PQ.
- Here MMM is the money supply, VVV the velocity of circulation, PPP the price level and QQQ real national output.
- Monetarists argue that, if V and Q are stable, a rise in M raises P in proportion.
Example
- Worked example: suppose the money supply MMM is £500 billion and velocity VVV is 4, so total spending MVMVMV is £2,000 billion.
- If real output QQQ is 1,000 billion units, the price level P=MVQ=2,0001,000=£2P = \dfrac{MV}{Q} = \dfrac{2{,}000}{1{,}000} = \pounds 2P=QMV=1,0002,000=£2 per unit.
- If MMM rises 10% to £550 billion while VVV and QQQ are unchanged, PPP rises to 2,2001,000=£2.20\dfrac{2{,}200}{1{,}000} = \pounds 2.201,0002,200=£2.20, a 10% rise, showing the proportional link the monetarists claim.
Note
- The equation of exchange is true by definition.
- The theory adds the assumption that V and Q are stable.
- It gives a monetary explanation of inflation.
How the Theory Works
- The equation says total spending (MVMVMV) equals the money value of output (PQPQPQ).
- If V and Q are fixed, only P can change when M changes.
- So a faster-growing money supply feeds straight into prices.
- This is the monetarist account of the cause of inflation.
Example
- If M rises by 5 per cent while V and Q are constant, P rises by about 5 per cent.
- A money supply growing far faster than output tends to bring inflation.
- Monetarist thinking shaped UK policy in the early 1980s.
Questioning the Assumptions
- Velocity may not be stable if spending habits change.
- Real output can rise when there is spare capacity.
- If V or Q move, the link from M to P breaks down.
- So the proportional result depends on the assumptions holding.
Case study
- In a deep recession, extra money can raise output rather than prices.
- Velocity fell after 2008 as banks and households held more money.
- So quantitative easing did not bring the inflation some had feared.
Evaluating How Realistic the Theory Is
- For the theory: over the long run, high money growth and inflation move together.
- Against: velocity and real output are not truly constant in the short run.
- With spare capacity, extra money can raise output instead of prices.
- On balance, the quantity theory is a useful long-run guide to inflation, but its proportional link holds only if velocity and real output are stable, which is often not the case in the short run.
Test the Assumptions
Exam technique
- State the equation and define each term.
- Question whether velocity and real output are really stable.
- Separate the long-run link from the short-run picture.
Common Mistake
- Do not assert the link from money to prices without questioning the assumptions.
- The proportional result needs stable velocity and real output.
Self review
- State Fisher's equation of exchange.
- What does each term stand for?
- What is the monetarist claim?
- Why might the assumptions fail?
- When can extra money raise output rather than prices?
2.3.3b Consequences and external influences on inflation
Inflation and Deflation Both Create Winners and Losers, While UK Inflation Is Also Shaped by World Prices and Other Economies
Definition
Deflation: a sustained fall in the general price level over time, that is a negative rate of inflation.
- Inflation affects consumers, workers, savers, borrowers, firms and the government.
- It can erode real incomes and the real value of savings.
- It also brings menu costs, shoe-leather costs and fiscal drag, explained below.
Note
- Inflation redistributes from savers and lenders to borrowers.
- Its impact depends on whether it is anticipated, and on its cause and rate.
Who Wins and Who Loses From Inflation
- Savers and lenders lose as the real value of money falls.
- Borrowers gain as the real value of their debt falls.
- Uncertainty can deter investment and harm competitiveness.
- Menu costs are the costs to firms of having to change prices often, such as reprinting price lists, menus and labels, which mount up when inflation is high.
- Shoe-leather costs are the time and effort people and firms spend shopping around and moving money to avoid holding cash that is losing value.
- Fiscal drag occurs when inflation lifts nominal incomes and pushes people into higher tax bands, so they pay more tax even though their real income has not risen.
Example
- A saver on a fixed return loses out when inflation is high.
- A borrower with a fixed-rate loan sees its real burden shrink.
Example
- Worked example: suppose a saver earns 3% nominal interest on their money while inflation is 5%.
- The real interest rate is roughly the nominal rate minus inflation: 3%−5%=−2%3\% - 5\% = -2\%3%−5%=−2%.
- So the real value of the savings falls by about 2% over the year, meaning the saver loses purchasing power, while a borrower paying that same 3% on a fixed loan gains as inflation erodes the real value of the debt.
Split the Effects by Group
Exam technique
- Trace effects on savers, borrowers, firms and the government.
- Say whether the inflation is anticipated and note its rate.
Common Mistake
- Do not assume all inflation is harmful.
- Sustained deflation can carry the greater risk.
Deflation Can Be More Damaging Than Mild Inflation
- Deflation is a sustained fall in the general price level.
- Demand-side deflation, caused by a fall in aggregate demand, is malign.
- Supply-side deflation, caused by rising productivity and falling costs, is benign.
Note
- Benign deflation comes from lower costs and greater supply.
- Malign deflation comes from collapsing aggregate demand.
How Deflation Harms Individuals and the Economy
- Consumers may delay spending while they wait for lower prices, which weakens demand further.
- The real burden of debt rises as prices fall, leaving borrowers worse off.
- Weaker demand squeezes firms' profits, so they cut investment and jobs.
- Falling demand, prices and incomes can reinforce one another in a deflationary spiral, so central banks treat persistent deflation as a serious threat.
Example
- Shoppers put off buying, waiting for cheaper prices next month.
- A fixed debt becomes harder to repay as prices and incomes fall.
Trace the Spiral
Exam technique
- Show how deferred spending weakens demand further.
- Link falling prices to a rising real debt burden.
Common Mistake
- Do not assume falling prices simply help consumers.
- Malign, demand-side deflation can trigger a damaging spiral.
World Commodity Prices Feed Directly Into UK Inflation
- Many goods and inputs the UK consumes, such as oil, gas, metals and foodstuffs, are priced on world markets.
- A rise in world commodity prices raises firms' costs and import prices, causing cost-push inflation in the UK.
- Because the UK is a large net importer of energy and food, external price shocks pass quickly into domestic prices.
Note
- Rising world commodity prices push up UK costs and import prices, raising domestic inflation.
- Falling commodity prices ease cost-push pressure and lower inflation.
Example
- A spike in global oil and gas prices raises transport and energy bills, lifting UK CPI inflation.
- A good harvest that lowers world food prices helps to bring UK inflation down.
Case study
- The Bank of England's CPI inflation target is 2%, but in 2021-23 a surge in world energy, gas and food prices pushed UK CPI inflation above 11% by October 2022, its highest for around 40 years.
- This was mainly imported cost-push inflation, showing how external commodity shocks can drive domestic inflation far from target.
Conditions in Other Economies Spill Over Into UK Inflation
- The UK trades heavily, so inflation and growth abroad feed through to prices at home.
- Higher inflation among trading partners raises the price of imports, adding to imported inflation.
- A fall in the exchange rate makes imports dearer and can raise inflation, while a stronger pound lowers import prices.
- Strong global demand can pull up commodity and export prices, while a global slowdown can ease inflationary pressure.
Example
- If the pound weakens against the dollar, dollar-priced imports cost more, adding to UK inflation.
- A recession in a major trading partner can reduce demand for UK exports and lower imported inflation.
How Harmful Is Inflation? It Depends on the Rate, Whether It Is Anticipated and Its Cause
- Low and stable inflation near the 2% target is widely seen as manageable and even helpful, as it lets relative prices and real wages adjust and keeps the economy clear of deflation.
- Inflation does most harm when it is high, volatile or unanticipated, because it erodes real incomes and savings, creates uncertainty that deters investment and can weaken international competitiveness.
- The distribution of gains and losses also matters, since inflation tends to redistribute from savers and lenders towards borrowers, so how fair it is depends on who holds debt and who holds savings.
- The cause shapes the response, as demand-pull inflation may call for tighter domestic policy whereas imported cost-push inflation from world commodity prices is largely outside domestic control.
- On balance, inflation is not always harmful, but the case for concern grows the higher, less predictable and more demand-driven it becomes, while sustained demand-side deflation can be a greater threat still.
Self review
- How does inflation affect savers and borrowers?
- Why can deflation be more damaging than mild inflation?
- How do changes in world commodity prices affect UK inflation?
- How can conditions in other economies affect UK inflation?
