2.3.1a Determinants and effects of economic growth
Economic Growth Is a Rise in Real Output, Split Into Actual and Potential Growth
Definition
Economic growth: an increase in the real output of an economy over time, usually measured by the annual percentage change in real GDP.
- Real GDP is the total value of the goods and services an economy produces in a year, measured at constant prices so that inflation is stripped out.
- Growth is the annual percentage change in real GDP from one year to the next.
- Because prices are held constant, a rise in real GDP means the economy is producing more goods and services, not simply charging higher prices for the same output.
Example
- Worked example: suppose real GDP rises from £2,200 billion in 2024 to £2,255 billion in 2025.
- The growth rate is the percentage change in real GDP: 552,200×100=2.5%\dfrac{55}{2{,}200}\times 100 = 2.5\%2,20055×100=2.5%.
- So the economy grew by 2.5% in real terms, meaning it produced 2.5% more goods and services, since the price effect has already been removed.
Note
- Economic growth is about real output, not just higher prices.
- It can take the form of actual growth or potential growth.
Actual Growth Uses Spare Capacity While Potential Growth Expands It
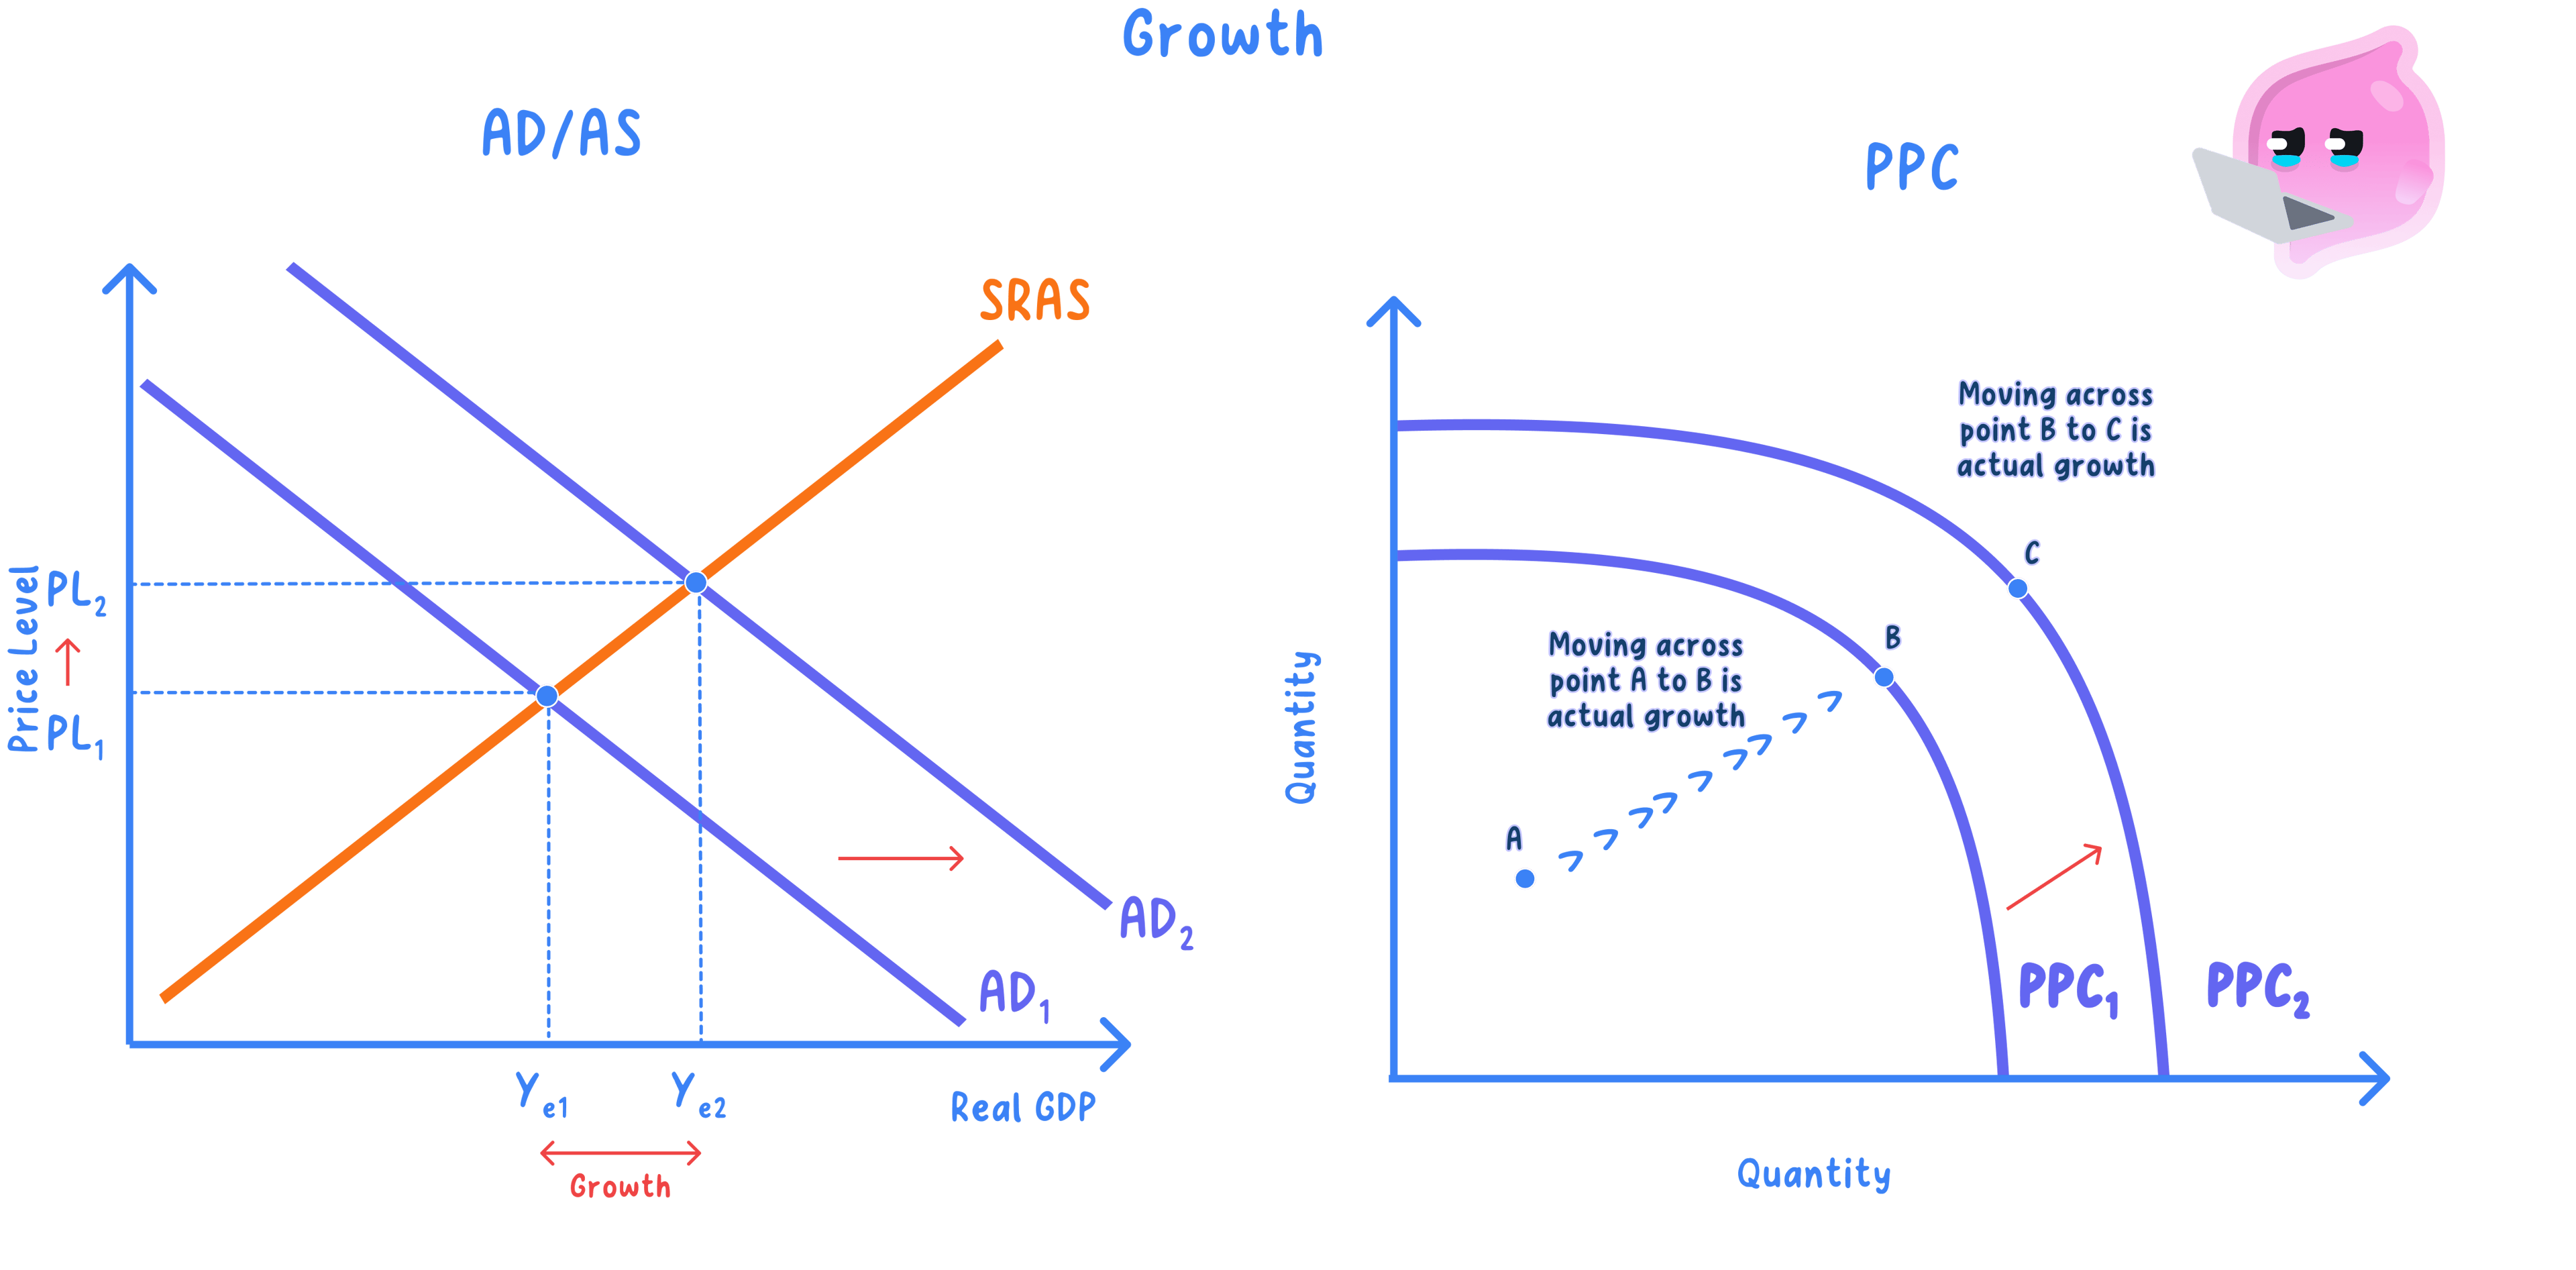
- Actual growth is the rate of change of real output, real GDP, in the short run.
- Potential growth is an increase in the productive capacity of the economy, which raises its long-run trend rate.
- Short-run growth uses existing spare capacity more fully, while long-run growth expands the capacity itself.
Example
- Bringing idle factories and unemployed workers back into use is actual growth.
- Building new factories, investing in capital or training workers is potential growth.
Each Form of Growth Has Its Own Diagram
- On a production possibility frontier, actual growth is a movement from inside the frontier towards the boundary, because idle resources are put back to work.
- Potential growth is an outward shift of the whole frontier, because the economy can now produce more at full employment than it could before.
- On an AD/AS diagram, potential growth is a rightward shift of long-run aggregate supply, with the axes labelled average price level and real output.
Common Mistake
- Do not treat every rise in measured real GDP as a rise in capacity.
- It may be spare capacity being used, which is actual growth, rather than more capacity, which is potential growth.
Growth Has Both Demand-Side and Supply-Side Determinants
- Short-run growth comes from rises in the components of aggregate demand: consumption, investment, government spending and net exports.
- Long-run growth, the trend rate, comes from more or better factors of production.
- Investment, new technology, rising productivity, a larger or more skilled labour force, including immigration, and trade all raise the trend rate.
Case study
- The UK's long-run trend rate of growth has averaged roughly 2% a year, driven mainly by rising productivity and investment.
- During the 2008-09 financial crisis real GDP fell for several quarters, an example of negative actual growth that opened up a large negative output gap.
Example
- A jump in household spending or a wave of business investment is a demand-side cause of short-run growth.
- New technology that raises productivity, or immigration that adds to the labour force, is a supply-side cause of long-run growth.
Exam technique
- Group the causes into demand-side and supply-side.
- Say whether each raises output in the short run or lifts the long-run trend rate.
Growth Brings Real Benefits but Also Real Costs
- For individuals, growth raises real incomes and living standards and creates jobs, cutting unemployment.
- For the economy, higher output raises tax revenue to fund public services, though rapid growth can add to inflationary pressure if it outpaces capacity.
- For the environment, growth can cause negative externalities such as pollution and congestion, and it can deplete finite resources.
Note
- There is also a trade-off over time: more investment for future potential growth means less consumption today.
- Whether growth is desirable depends on how it is achieved and how fairly the gains are shared.
Exam technique
- Set the benefits, such as higher incomes, more jobs and higher tax revenue, against the costs, such as pollution, resource depletion and wider inequality.
- Bring in the trade-off between present and future consumption, and judge growth by whether it is sustainable and widely shared.
Common Mistake
- Do not treat growth as purely good, as it can bring pollution, resource depletion and wider inequality.
- Do not ignore the time trade-off, since investment for future growth means less consumption now.
Self review
- Distinguish actual growth from potential growth.
- How is potential growth shown on a production possibility frontier and on an AD/AS diagram?
- Name a demand-side and a supply-side determinant of growth.
- Give two benefits and two costs of economic growth.
- What is the impact of economic growth on the environment?
2.3.1b The economic cycle and output gaps
The Economy Moves Through a Repeating Cycle Around a Rising Long-Run Trend
Definition
Output gap: the difference between the actual level of real GDP and the estimated trend (potential) level of real GDP, usually expressed as a percentage of potential output.
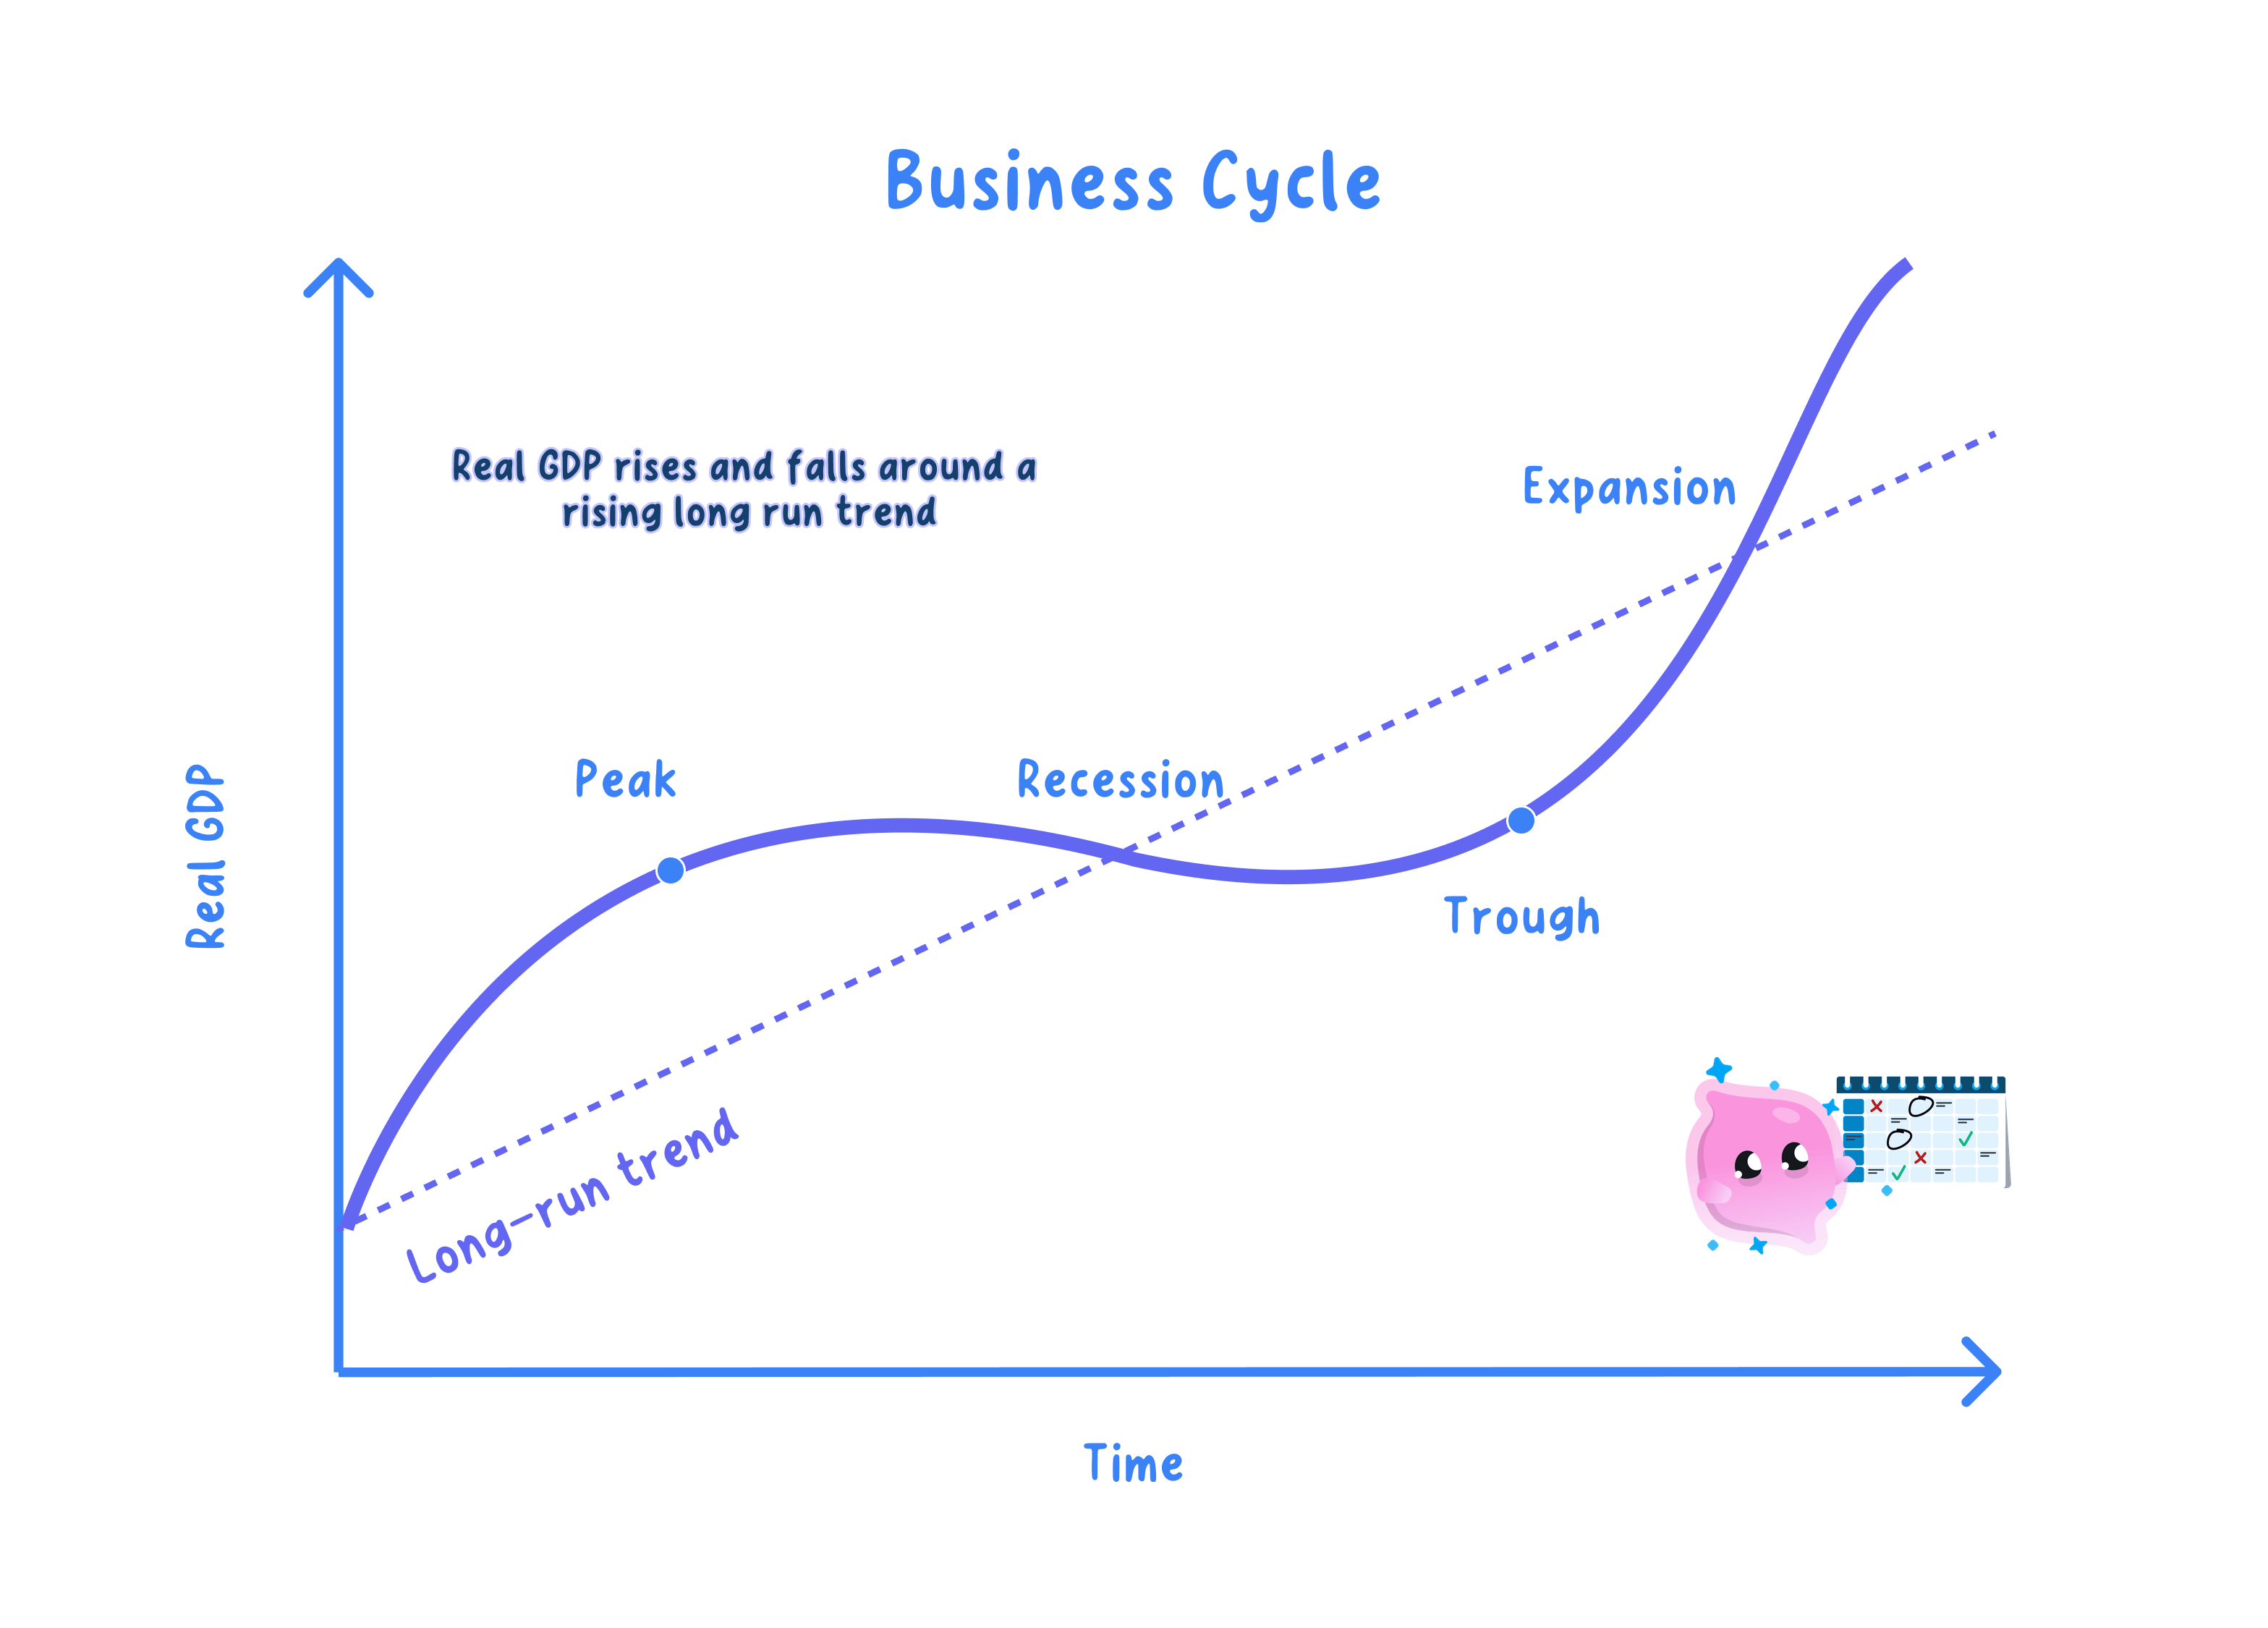
- The economic cycle is the fluctuation of real output around its long-run trend.
- Its four phases are boom, recession (a downturn), slump (or trough) and recovery.
- Output rises and falls, but the long-run trend still points upward.
Note
- A boom brings rising output, falling unemployment and rising inflationary pressure.
- A recession is conventionally two consecutive quarters of negative growth.
Real GDP, Inflation, Unemployment and Investment Reveal the Current Phase
- In a boom, output and employment are high and prices tend to rise.
- In a recession, output falls and unemployment rises.
- Indicators such as real GDP, the rate of inflation, unemployment and investment together show which phase the economy is in.
Example
- Falling unemployment and rising inflation point to a boom.
- Two quarters of shrinking real GDP point to a recession.
A Slowdown Is Still Positive Growth, but a Recession Is Falling Output
- A slowdown is slower positive growth, so output is still rising.
- A recession is negative growth, so output is actually falling.
- Telling actual growth apart from a slowdown in the rate of growth is essential for judging the cycle.
Name the Phase From the Data
Exam technique
- Use several indicators together to identify the phase.
- State whether growth is positive but slower, or actually negative.
Common Mistake
- Do not confuse a slowdown with a recession.
- A slowdown is slower growth; a recession is negative growth.
Shocks at Home and Abroad Move the Economy Between Phases
- Changes between phases are driven by demand-side and supply-side shocks.
- Demand-side shocks shift aggregate demand: swings in consumer and business confidence, changes in investment, interest rate or tax changes, or a rise or fall in demand for exports.
- Supply-side shocks shift aggregate supply: sharp changes in oil, energy or commodity prices, supply chain disruption, or changes in productivity.
- Shocks can be domestic, such as a change in UK fiscal or monetary policy, or global, such as a world recession or a spike in world oil prices.
- Cyclical instability can also build up from within: excessive growth in credit and levels of debt, asset price bubbles, destabilising speculation and animal spirits or herding, as in the boom that preceded the 2008 financial crisis.
Example
- A positive demand shock or an improvement in supply can lift the economy towards a boom; a negative shock can tip it into recession.
- The 2008 global financial crisis and the 2020 pandemic were global shocks that pushed many economies into recession.
An Output Gap Measures How Far Actual Output Sits From Its Potential
- An output gap is actual output minus potential (trend) output.
- A positive output gap is when actual output is above potential (trend) output.
- A negative output gap is when actual output is below potential (trend) output.
Example
- Worked example: suppose potential (trend) output is £2,200 billion but actual output is only £2,145 billion.
- The output gap is actual minus potential: 2,145−2,200=−£552{,}145 - 2{,}200 = -\pounds 552,145−2,200=−£55 billion, which as a share of potential is 552,200×100=2.5%\dfrac{55}{2{,}200}\times 100 = 2.5\%2,20055×100=2.5%.
- This is a negative output gap of about 2.5%, signalling spare capacity, so unemployment is likely above its natural rate and inflationary pressure is weak.
Note
- A positive gap means an overheating economy with inflationary pressure.
- A negative gap means spare capacity, higher unemployment and weak price pressure.
A Positive Gap Sits Above Trend Output and a Negative Gap Below It
- On an AD/AS diagram, the gap is the distance of actual output from the trend (potential) level.
- A positive gap sits above trend output; a negative gap sits below it.
- Gaps link directly to unemployment and inflation.
- The gap can also be shown on a production possibility curve: a negative gap as production inside the curve, a positive gap as output beyond the sustainable trend.
Example
- A booming economy running above trend has a positive output gap.
- An economy in recession with idle resources has a negative output gap.
Potential Output Is Unobservable, so Output Gaps Are Uncertain Estimates
- Potential output cannot be observed directly.
- So estimates of the gap are uncertain.
- Policy based on them must allow for that uncertainty.
Tie the Gap to Inflation and Jobs
Exam technique
- Link a positive gap to inflation and a negative gap to unemployment.
- Show the gap on an AD/AS diagram or a production possibility curve, labelling average price level and real output.
Common Mistake
- Do not assume output gaps can be measured precisely.
- Potential output is unobservable, so estimates are uncertain.
- Do not confuse a negative output gap with negative economic growth.
- A negative gap is a level below potential, not necessarily a fall in output.
Output Gaps Guide Macroeconomic Policy but Must Be Read With Caution
- An output gap signals where the economy sits relative to potential.
- A positive gap points to inflation risk.
- A negative gap points to spare capacity and unemployment.
Note
- Output gaps inform judgements about the stage of the cycle.
- But potential output is hard to measure.
A Positive Gap Argues for Tighter Policy and a Negative Gap for Looser Policy
- A positive gap can prompt tighter policy to curb inflation.
- A negative gap can prompt looser policy to support demand.
- So the gap informs the policy stance.
Example
- A large negative gap suggests room to raise demand without inflation.
- A positive gap warns that extra demand may just raise prices.
Measurement Problems Limit How Far Output Gaps Should Steer Policy
- For usefulness: gaps summarise the cycle in one measure.
- Against: potential output cannot be observed directly.
- Estimates are revised, so real-time judgements can be wrong.
- On balance, output gaps are a useful guide to the cycle, but the difficulty of measuring potential output means they should inform, not dictate, policy.
Weigh Usefulness Against Measurement Problems
Exam technique
- Explain what a gap signals for inflation and unemployment.
- Stress the difficulty of measuring potential output in real time.
Common Mistake
- Do not treat a measured output gap as precise.
- Potential output is estimated and revised over time.
Self review
- Name the four phases of the economic cycle.
- Which indicators help identify the phase of the cycle, and how?
- How does a slowdown differ from a recession?
- Define an output gap and distinguish a positive from a negative gap.
- Give one demand-side and one supply-side shock that could move the economy between phases.
- Why should output gaps inform rather than dictate policy?
