LRAS Shows the Economy's Productive Capacity and Shifts Only When That Capacity Changes
Definition
Long-run aggregate supply: the total output an economy can produce when all its factors of production are fully and efficiently employed, determined by productive capacity and shown by a vertical curve at the normal capacity level of output.
- Long-run aggregate supply (LRAS) represents the economy's productive capacity.
- It does not depend on the price level in the same way as SRAS.
- A rightward shift shows long-run, or potential, economic growth.
- In the classical (monetarist) view, the LRAS curve is vertical at the normal capacity, or full-employment, level of output.
Note
- LRAS depends on the quantity and quality of factors of production.
- A rightward shift in LRAS is potential growth.
Supply-side Factors Shift LRAS to the Right
- Technology, productivity and investment raise capacity.
- Enterprise, factor mobility and economic incentives matter too.
- Demographic change and migration alter the size of the workforce.
- Attitudes to work and enterprise also matter, as does the institutional structure of the economy; for example, a sound banking system that provides funds for business investment raises long-run capacity.
Example
- Investment in new capital shifts LRAS to the right.
- Improved education raises the quality of labour and lifts LRAS.
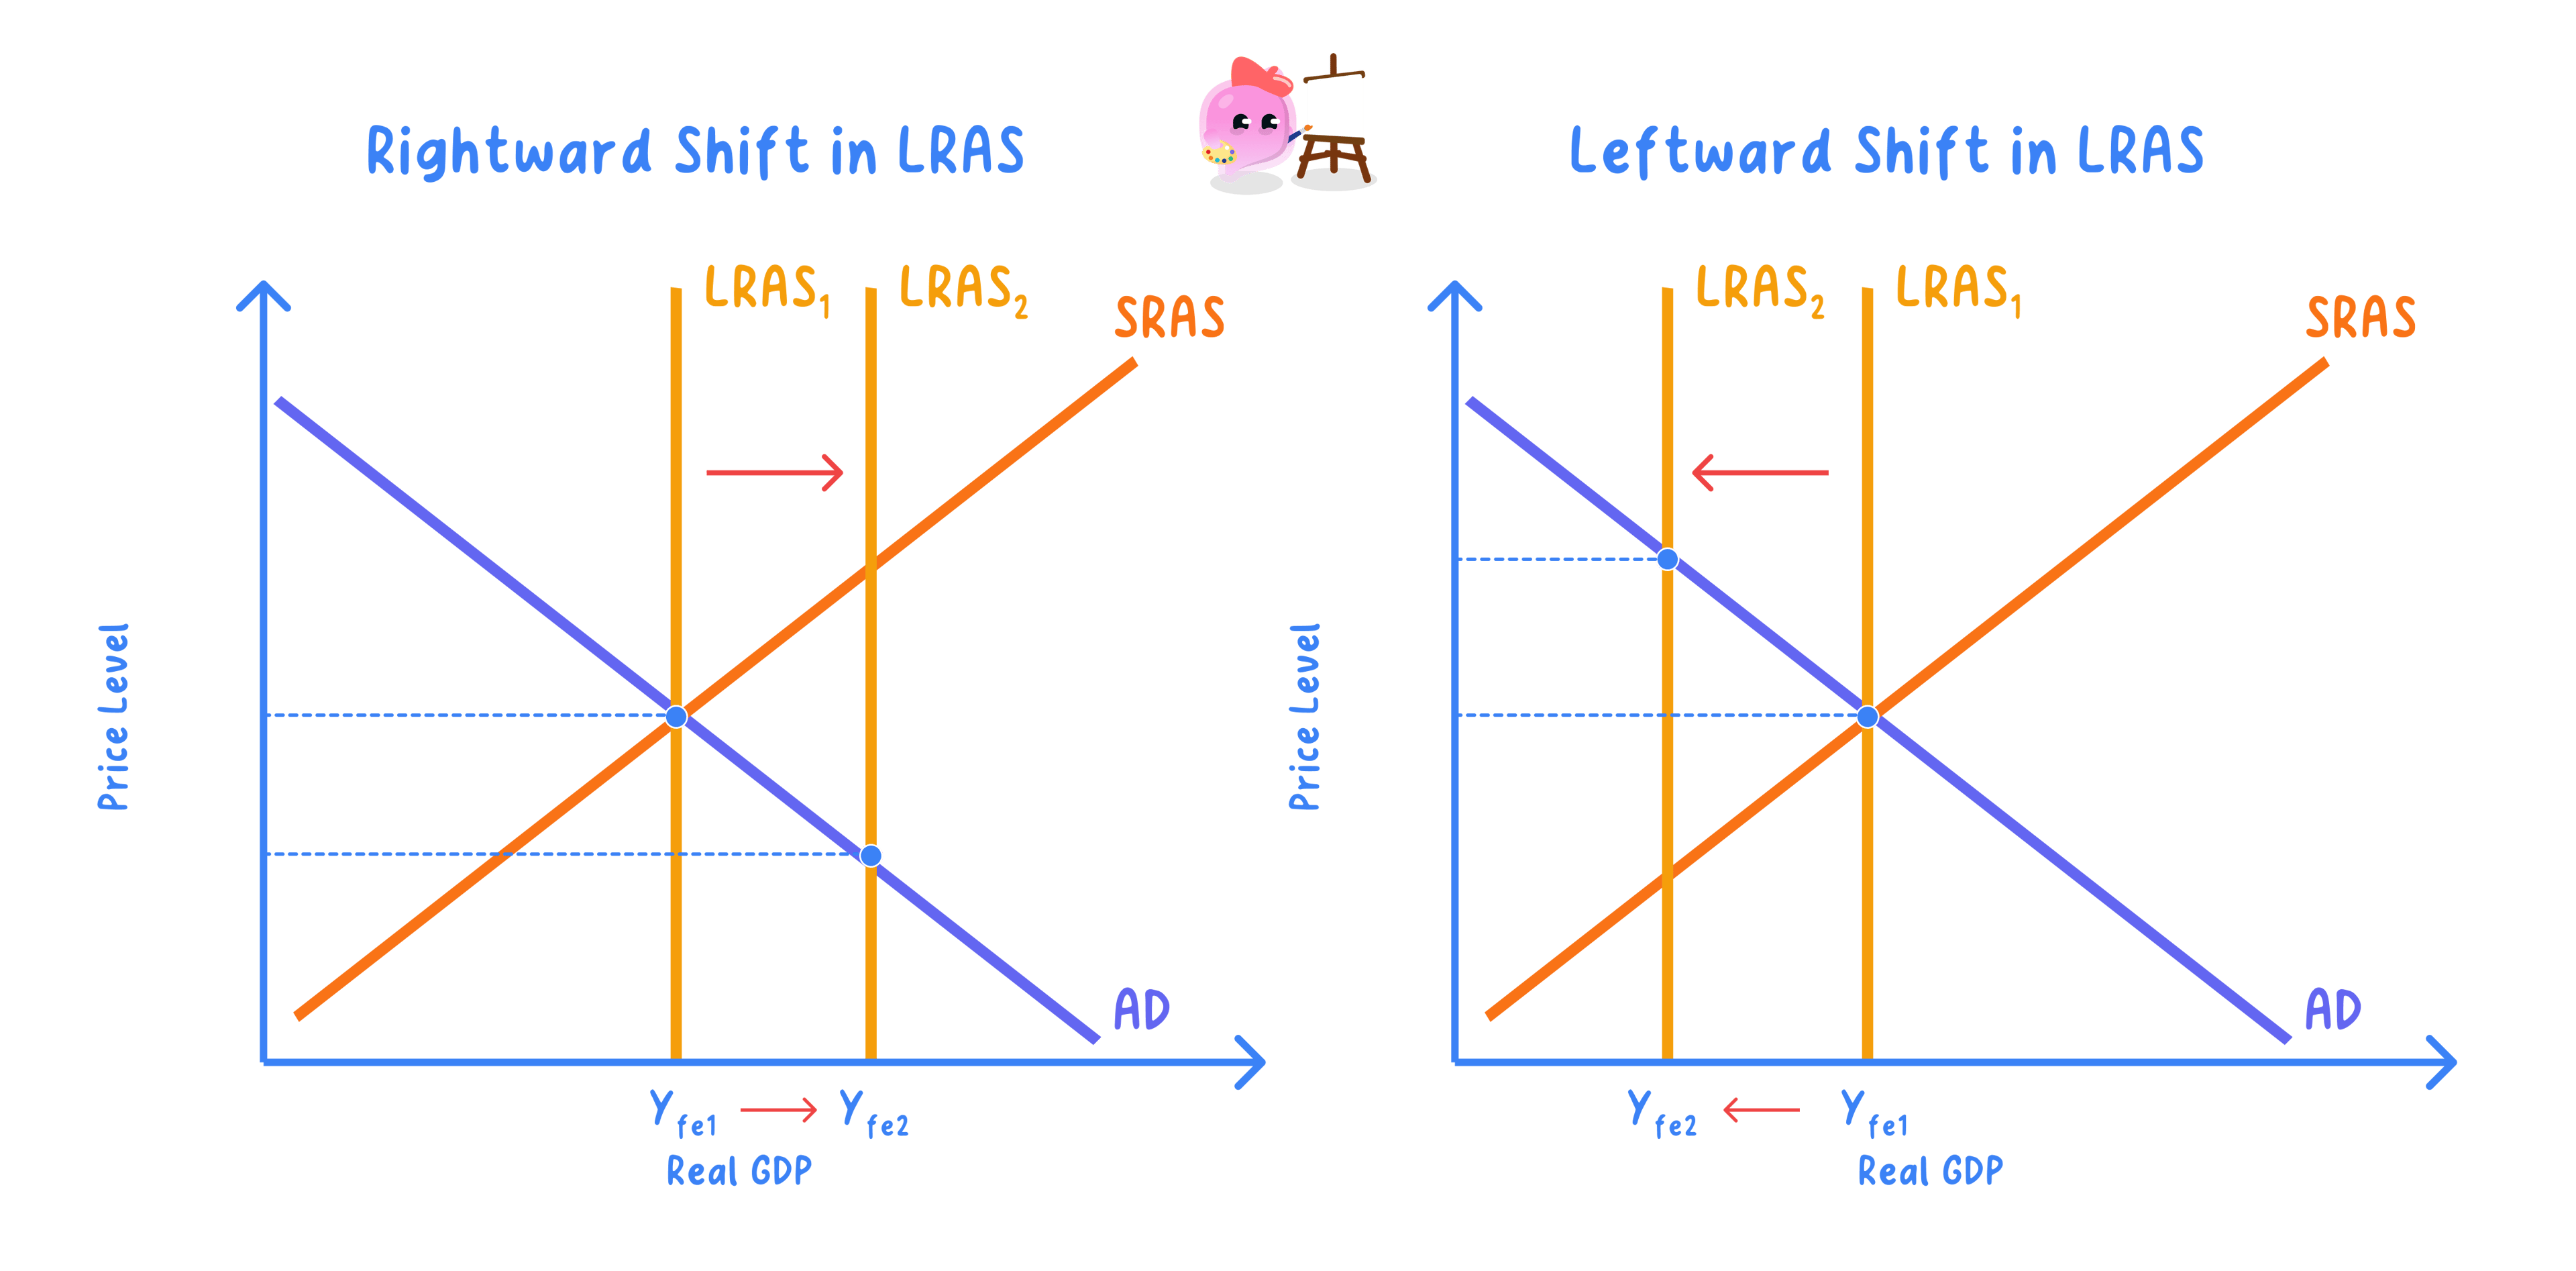
Only Capacity Changes Shift LRAS, Not Temporary Cost Changes
- A temporary cost change shifts SRAS, not LRAS.
- LRAS moves only when capacity itself changes.
- So the two shifters are different.
The Classical (Monetarist) and Keynesian AS Curves Have Different Shapes
- The classical (monetarist) long-run AS curve is vertical at full-employment output.
- The Keynesian AS curve has three sections.
- The two rest on different views of wage and price flexibility.
Note
- The classical (monetarist) curve is vertical at full capacity.
- The Keynesian curve is horizontal, then upward-sloping, then vertical.
Each Shape Rests on a Different View of Wages and Prices
- The classical (monetarist) view assumes flexible wages and prices.
- The Keynesian view assumes wages are sticky, especially downward.
- So the Keynesian curve has a flat section at low output.
Example
- On the flat section, output can rise with little effect on the price level.
- On the vertical section, extra demand only raises the price level.
The Shape Decides Whether Demand Can Raise Long-run Output
- The classical (monetarist) view implies demand cannot raise long-run output.
- The Keynesian view implies demand management can raise output when there is spare capacity.
- So the shape decides the policy conclusion.
Note
- Which curve is more useful depends on how much spare capacity the economy has.
- In a deep recession with high unemployment the flat Keynesian section fits, so demand stimulus can raise real output; near full capacity the vertical section fits, so extra demand mainly raises prices.
Draw Both Curves with the Axes Labelled Correctly
Exam technique
- Draw the Keynesian curve with flat, rising and vertical sections.
- Draw the classical (monetarist) curve as vertical at full-employment output.
- Label the axes average price level on the vertical axis and real output on the horizontal axis.
Common Mistake
- Do not draw the Keynesian curve as a single straight line.
- It has a horizontal, an upward-sloping and a vertical section.
Self review
- What does LRAS represent, and what determines its position?
- Name four determinants that can shift LRAS to the right.
- What shape is the classical (monetarist) LRAS curve, and at what level of output?
- What are the three sections of the Keynesian AS curve?
- Why does the choice of AS curve change the case for demand-side policy?
