1.4.4a Types of cost
Total Cost Splits into Fixed and Variable Costs
Definition
Fixed cost: a cost of production that does not change as output changes in the short run.
Variable cost: a cost of production that rises and falls with the level of output.
- Total cost is fixed cost plus variable cost, so TC=TFC+TVC\text{TC} = \text{TFC} + \text{TVC}TC=TFC+TVC.
- Total fixed cost stays the same at every level of output, whereas total variable cost rises as output rises.
- So as the firm produces more, the whole increase in total cost comes from the rise in variable cost.
Note
- Whether a cost is fixed or variable depends on the time period.
- In the long run, all costs are variable.
Recognising Fixed and Variable Costs
- Fixed costs
- Rent and insurance, which must be paid whatever the output.
- Variable costs
- Raw materials and the wages of extra staff, which grow with output.
Example
- A bakery pays the same rent whether it bakes 10 or 1,000 loaves.
- Its flour bill rises directly with the number of loaves.
Average and Marginal Cost: Per Unit and the Next Unit
- Average cost is total cost divided by output, the cost per unit, and it splits into average fixed cost (AFC) plus average variable cost (AVC).
- Marginal cost is the addition to total cost from producing one more unit.
- Total and average cost describe the whole output, while marginal cost focuses on the next unit.
Note
- Average cost is the figure firms compare with price to judge profitability.
- Marginal cost is central to the firm's decision on how much to produce.
Example
- Suppose total fixed cost (TFC) is £100 and, at an output of 4 units, total variable cost (TVC) is £160, so total cost (TC) is TC=£100+£160=£260\text{TC} = \pounds 100 + \pounds 160 = \pounds 260TC=£100+£160=£260.
- Average fixed cost (AFC) is AFC=£1004=£25\text{AFC} = \dfrac{\pounds 100}{4} = \pounds 25AFC=4£100=£25, and average variable cost (AVC) is AVC=£1604=£40\text{AVC} = \dfrac{\pounds 160}{4} = \pounds 40AVC=4£160=£40.
- Average total cost (ATC) is ATC=£2604=£65\text{ATC} = \dfrac{\pounds 260}{4} = \pounds 65ATC=4£260=£65, which must equal AFC + AVC (£25+£40=£65\pounds 25 + \pounds 40 = \pounds 65£25+£40=£65), a handy check on your working.
- If total cost at 3 units had been £220, the marginal cost of the 4th unit is MC=£260−£220=£40\text{MC} = \pounds 260 - \pounds 220 = \pounds 40MC=£260−£220=£40, the extra cost of that single unit.
Short-Run Costs Have a Fixed Factor; Long-Run Costs Do Not
- In the short run at least one factor is fixed, so costs split into fixed and variable.
- In the long run all factors can vary, so every cost is variable.
- Short-run costs assume a fixed plant size, while long-run costs allow the firm to change its scale.
Anchor Every Cost to Time and Output
Exam technique
- Say whether you mean the short run or the long run before labelling a cost.
- Split total cost into its fixed and variable parts, then find average and marginal cost.
Common Mistake
- Do not label a cost fixed or variable without stating the time period.
- In the long run, every cost is variable.
- Do not confuse average cost (cost per unit) with marginal cost (cost of the next unit).
Self review
- Define fixed and variable costs.
- What is total, average and marginal cost?
- With TFC of £100 and TVC of £160 at 4 units, work out ATC, AFC and AVC.
- How do short-run and long-run costs differ?
- Why are all costs variable in the long run?
1.4.4b Cost curves and factor inputs
Average and Marginal Cost Curves Have Characteristic Shapes
Definition
Marginal cost: the addition to total cost of producing one more unit of output.
- Average total cost is total cost divided by output.
- It splits into average fixed cost and average variable cost.
- Marginal cost is the cost of producing one more unit.
Note
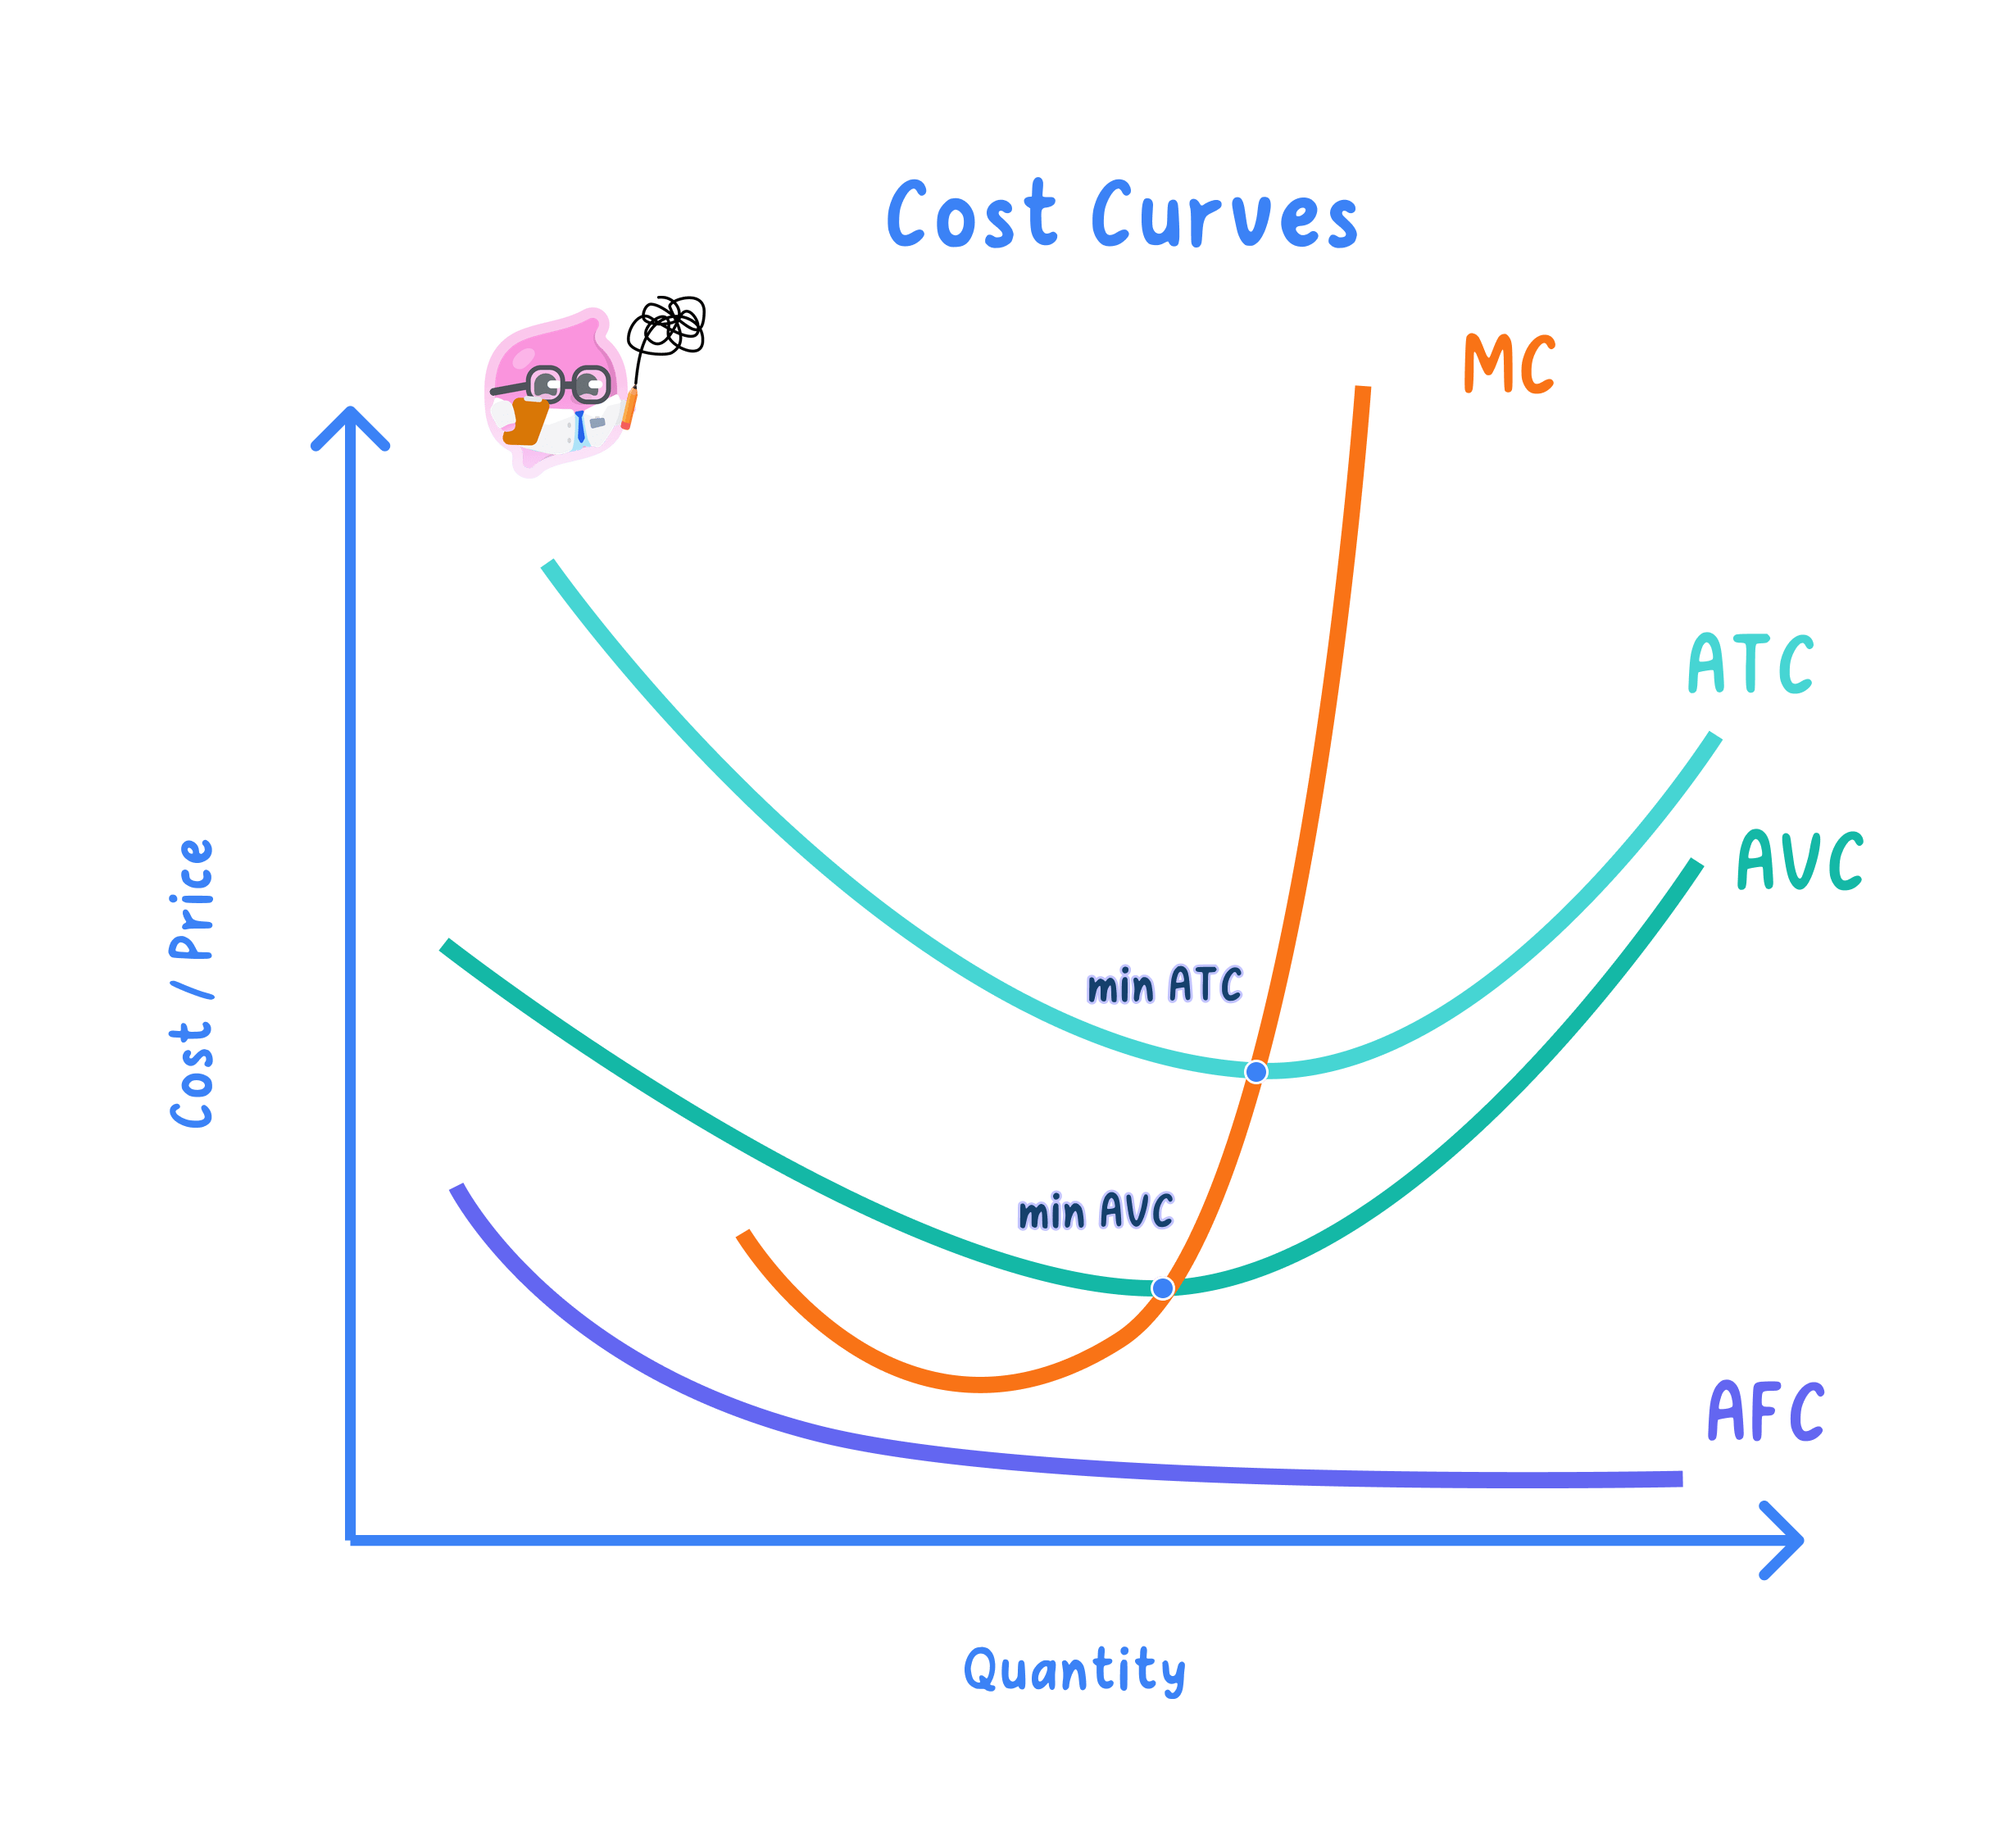
- The short-run average cost curve is typically U-shaped.
- Marginal cost cuts average variable and average total cost at their lowest points.
How to Read the Cost Curves
- Average fixed cost falls continuously as output spreads it thinner.
- Average variable and average total cost fall, then rise, giving the U shape.
- The upturn reflects diminishing marginal returns.
Example
- At low output, spreading fixed costs pulls average cost down; at high output, diminishing returns push marginal and average cost up.
- Put numbers on the crossing rule. If total cost for 4 units is £160, average cost is £1604=£40\dfrac{\pounds 160}{4} = \pounds 404£160=£40. A 5th unit costing a marginal £30 (below £40) lifts total cost to £160+£30=£190\pounds 160 + \pounds 30 = \pounds 190£160+£30=£190 and pulls average cost down to £1905=£38\dfrac{\pounds 190}{5} = \pounds 385£190=£38.
- Had the 5th unit instead cost £60 (above £40), total cost would be £160+£60=£220\pounds 160 + \pounds 60 = \pounds 220£160+£60=£220 and average cost would rise to £2205=£44\dfrac{\pounds 220}{5} = \pounds 445£220=£44, which is exactly why marginal cost drags average cost up once it exceeds it, and so must cross it at the minimum.
Why MC Cuts AC at the Bottom
- While marginal cost is below average cost, it drags the average down.
- While marginal cost is above average cost, it pulls the average up.
- So marginal cost must cross average cost at its lowest point.
Factor Prices and Productivity Shift the Cost Curves
- A rise in factor prices, such as higher wages or dearer raw materials, raises costs and shifts the cost curves upward.
- Higher productivity means more output per unit of input, which lowers unit costs and shifts the cost curves downward.
- Firms choose the combination of factor inputs that produces a given output at least cost.
Note
- When labour becomes relatively expensive, firms tend to substitute capital for labour, and vice versa.
- The least-cost mix balances each factor's price against its productivity.
Total Cost Starts at Fixed Cost and Steepens as Marginal Cost Rises
- Total cost is the sum of fixed cost and variable cost at each level of output.
- At zero output there is no variable cost, so the total cost curve starts at the level of fixed cost rather than at the origin.
- Total cost then rises with output, and its slope at any point equals marginal cost.
- So total cost rises slowly at first while marginal returns are rising, then more steeply as diminishing returns raise marginal cost.
Note
- The vertical gap between the total cost curve and the total variable cost curve stays constant and equals fixed cost.
- The total cost curve is steepest where marginal cost is highest.
Exam technique
- Draw MC cutting both AVC and ATC at their minimum points.
- Link the U shape to diminishing marginal returns, and shifts to factor prices and productivity.
Common Mistake
- Do not draw marginal cost missing the lowest point of ATC and AVC.
- Marginal cost always passes through their minimum points.
Self review
- Define average total, average fixed, average variable and marginal cost.
- Why is the short-run ATC curve U-shaped?
- Where does MC cross AVC and ATC, and why?
- How do factor prices and productivity affect costs and the choice of factor inputs?
- Why does the total cost curve start at the level of fixed cost, and what does its slope measure?
