Consumer and Producer Surplus Together Make up Total Welfare
Definition
Consumer surplus: the difference between the maximum price a consumer is willing to pay for a good and the price they actually pay.
Producer surplus: the difference between the price a firm actually receives and the minimum price it would have been willing to accept.
- Both surpluses measure the net gain from trading at the market price: consumers pay less than their maximum, and producers receive more than their minimum.
- The wider the gap between willingness to pay or accept and the actual price, the larger the surplus.
- Their sum is community surplus, or total welfare.
- It is largest at the competitive equilibrium, where the market is allocatively efficient.
Note
- Consumer surplus plus producer surplus equals community surplus.
- Total welfare is maximised at the competitive equilibrium.
- Shifts in demand or supply redistribute and change these surpluses.
Consumer Surplus Sits Below Demand Above Price; Producer Surplus Above Supply Below Price
- On a demand and supply diagram, price is on the vertical axis and quantity on the horizontal axis.
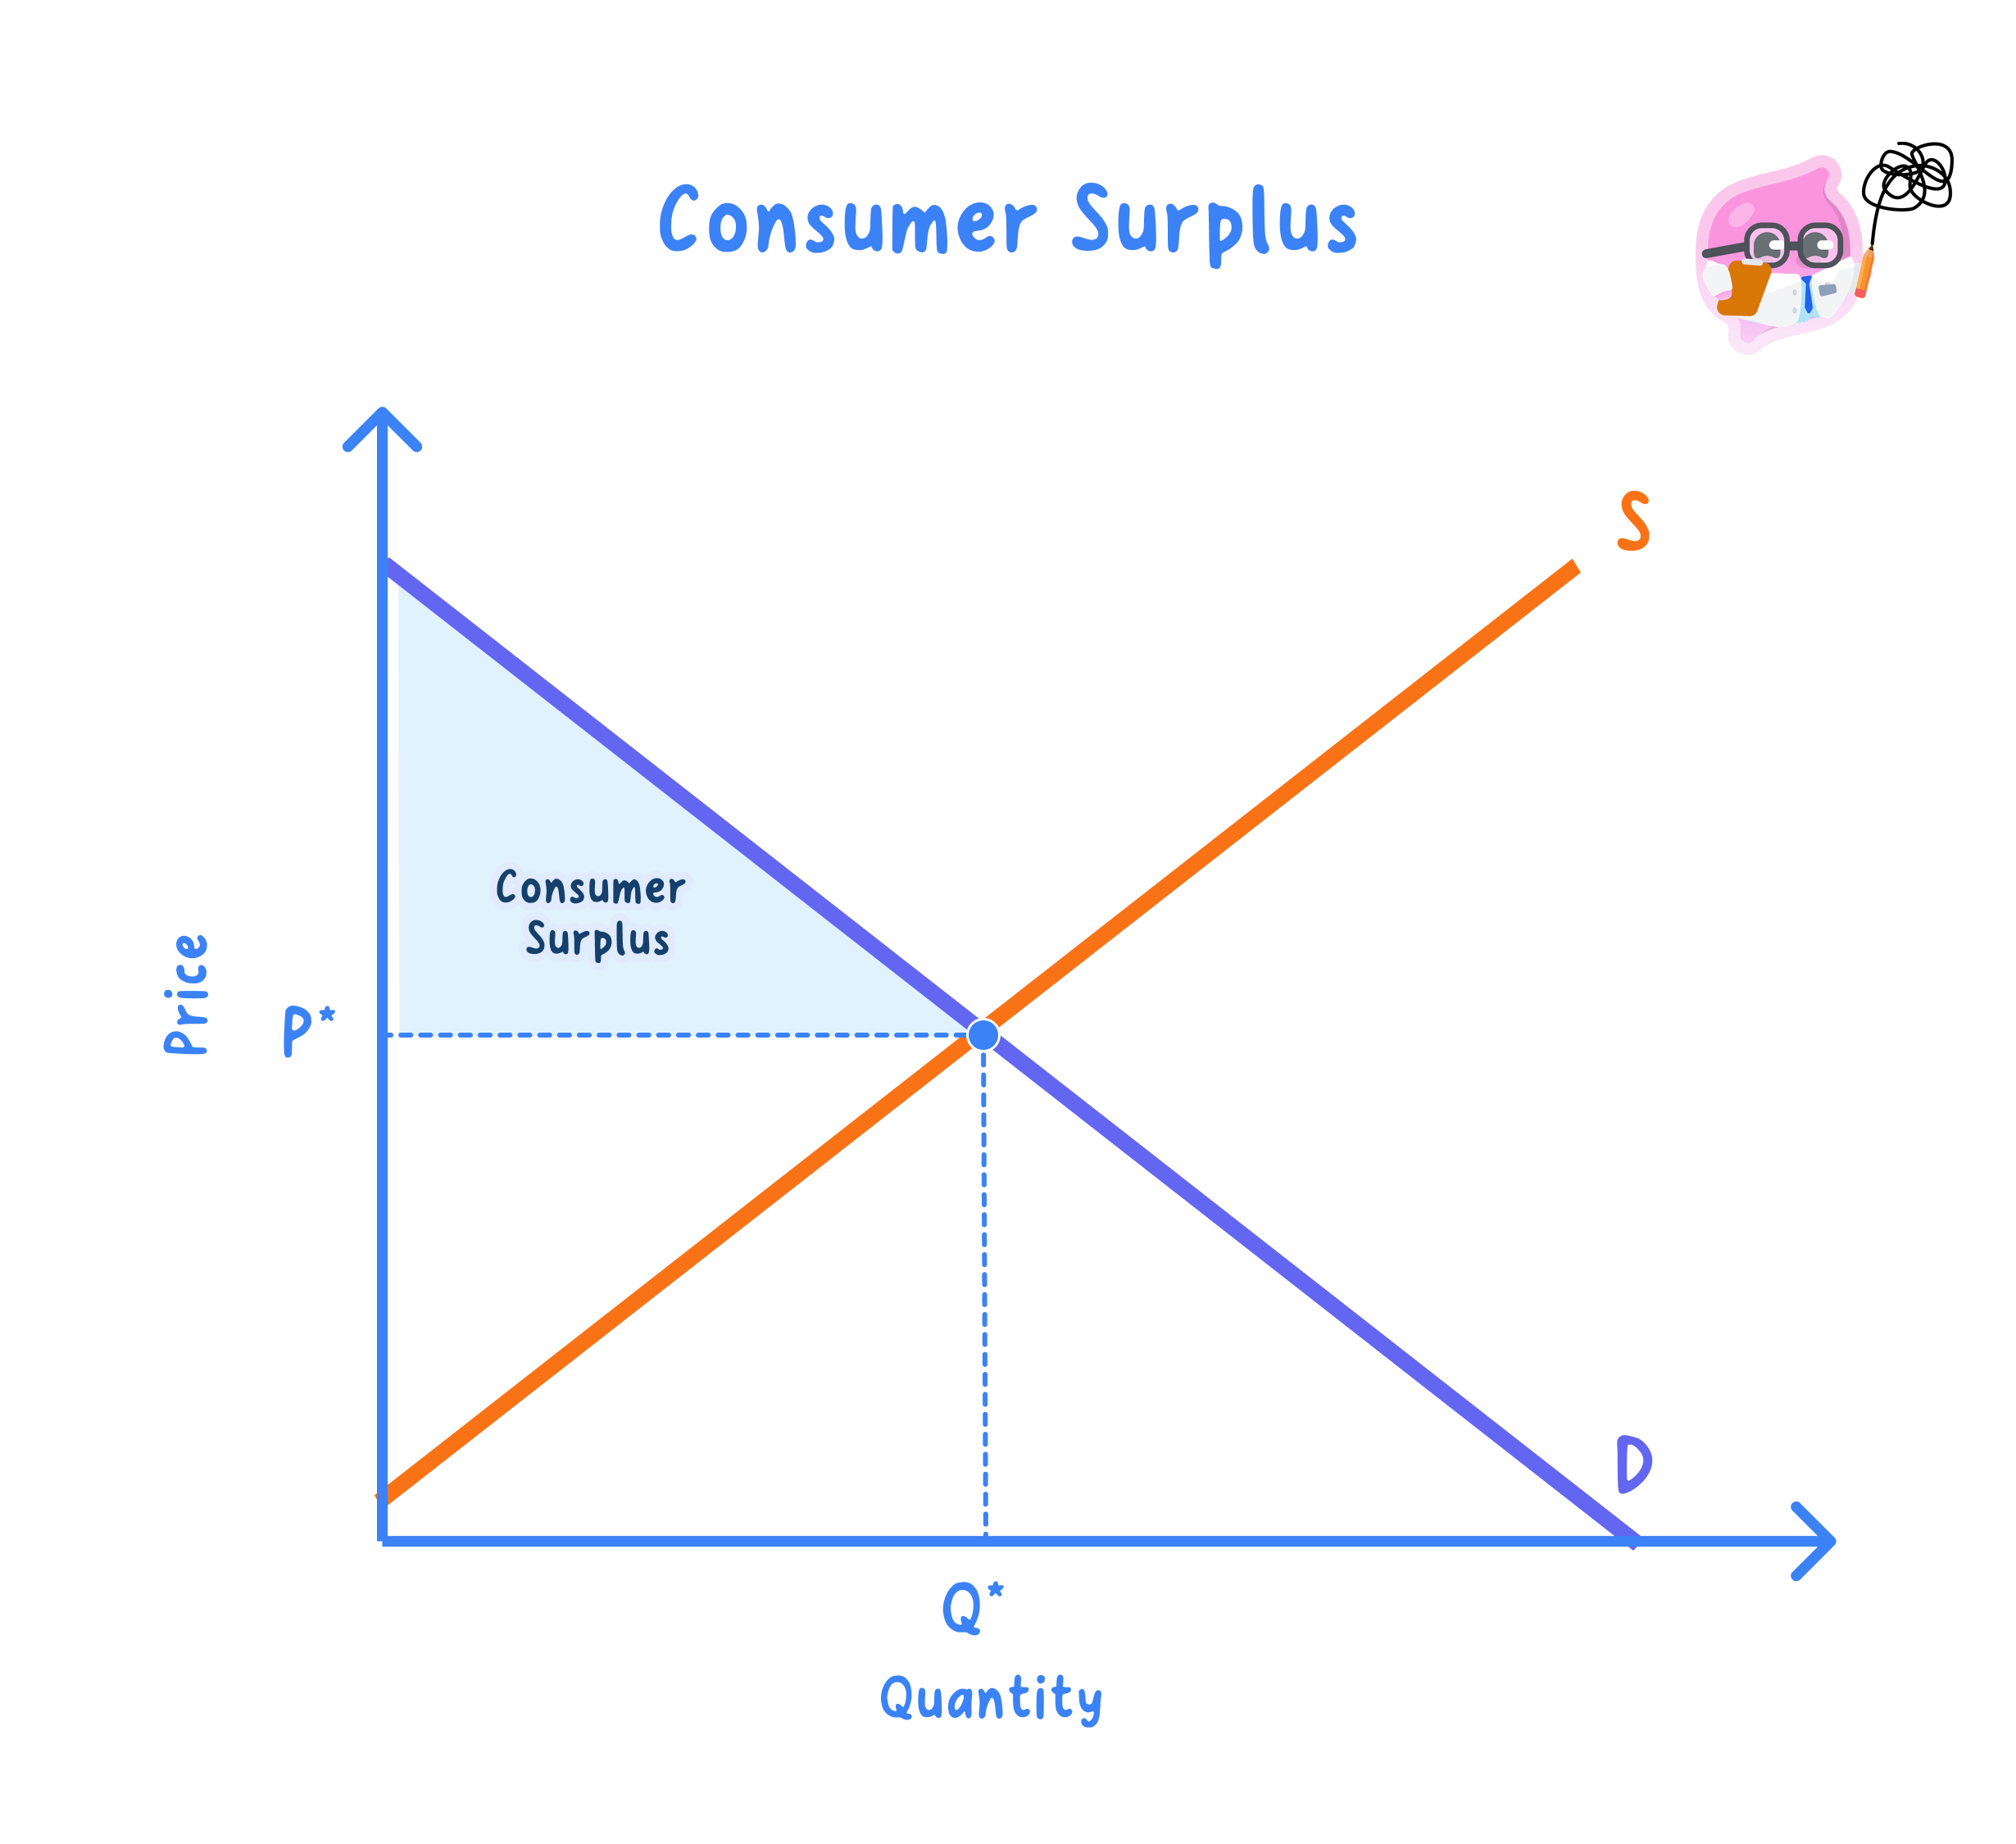
- Consumer surplus is the area below the demand curve and above the price.
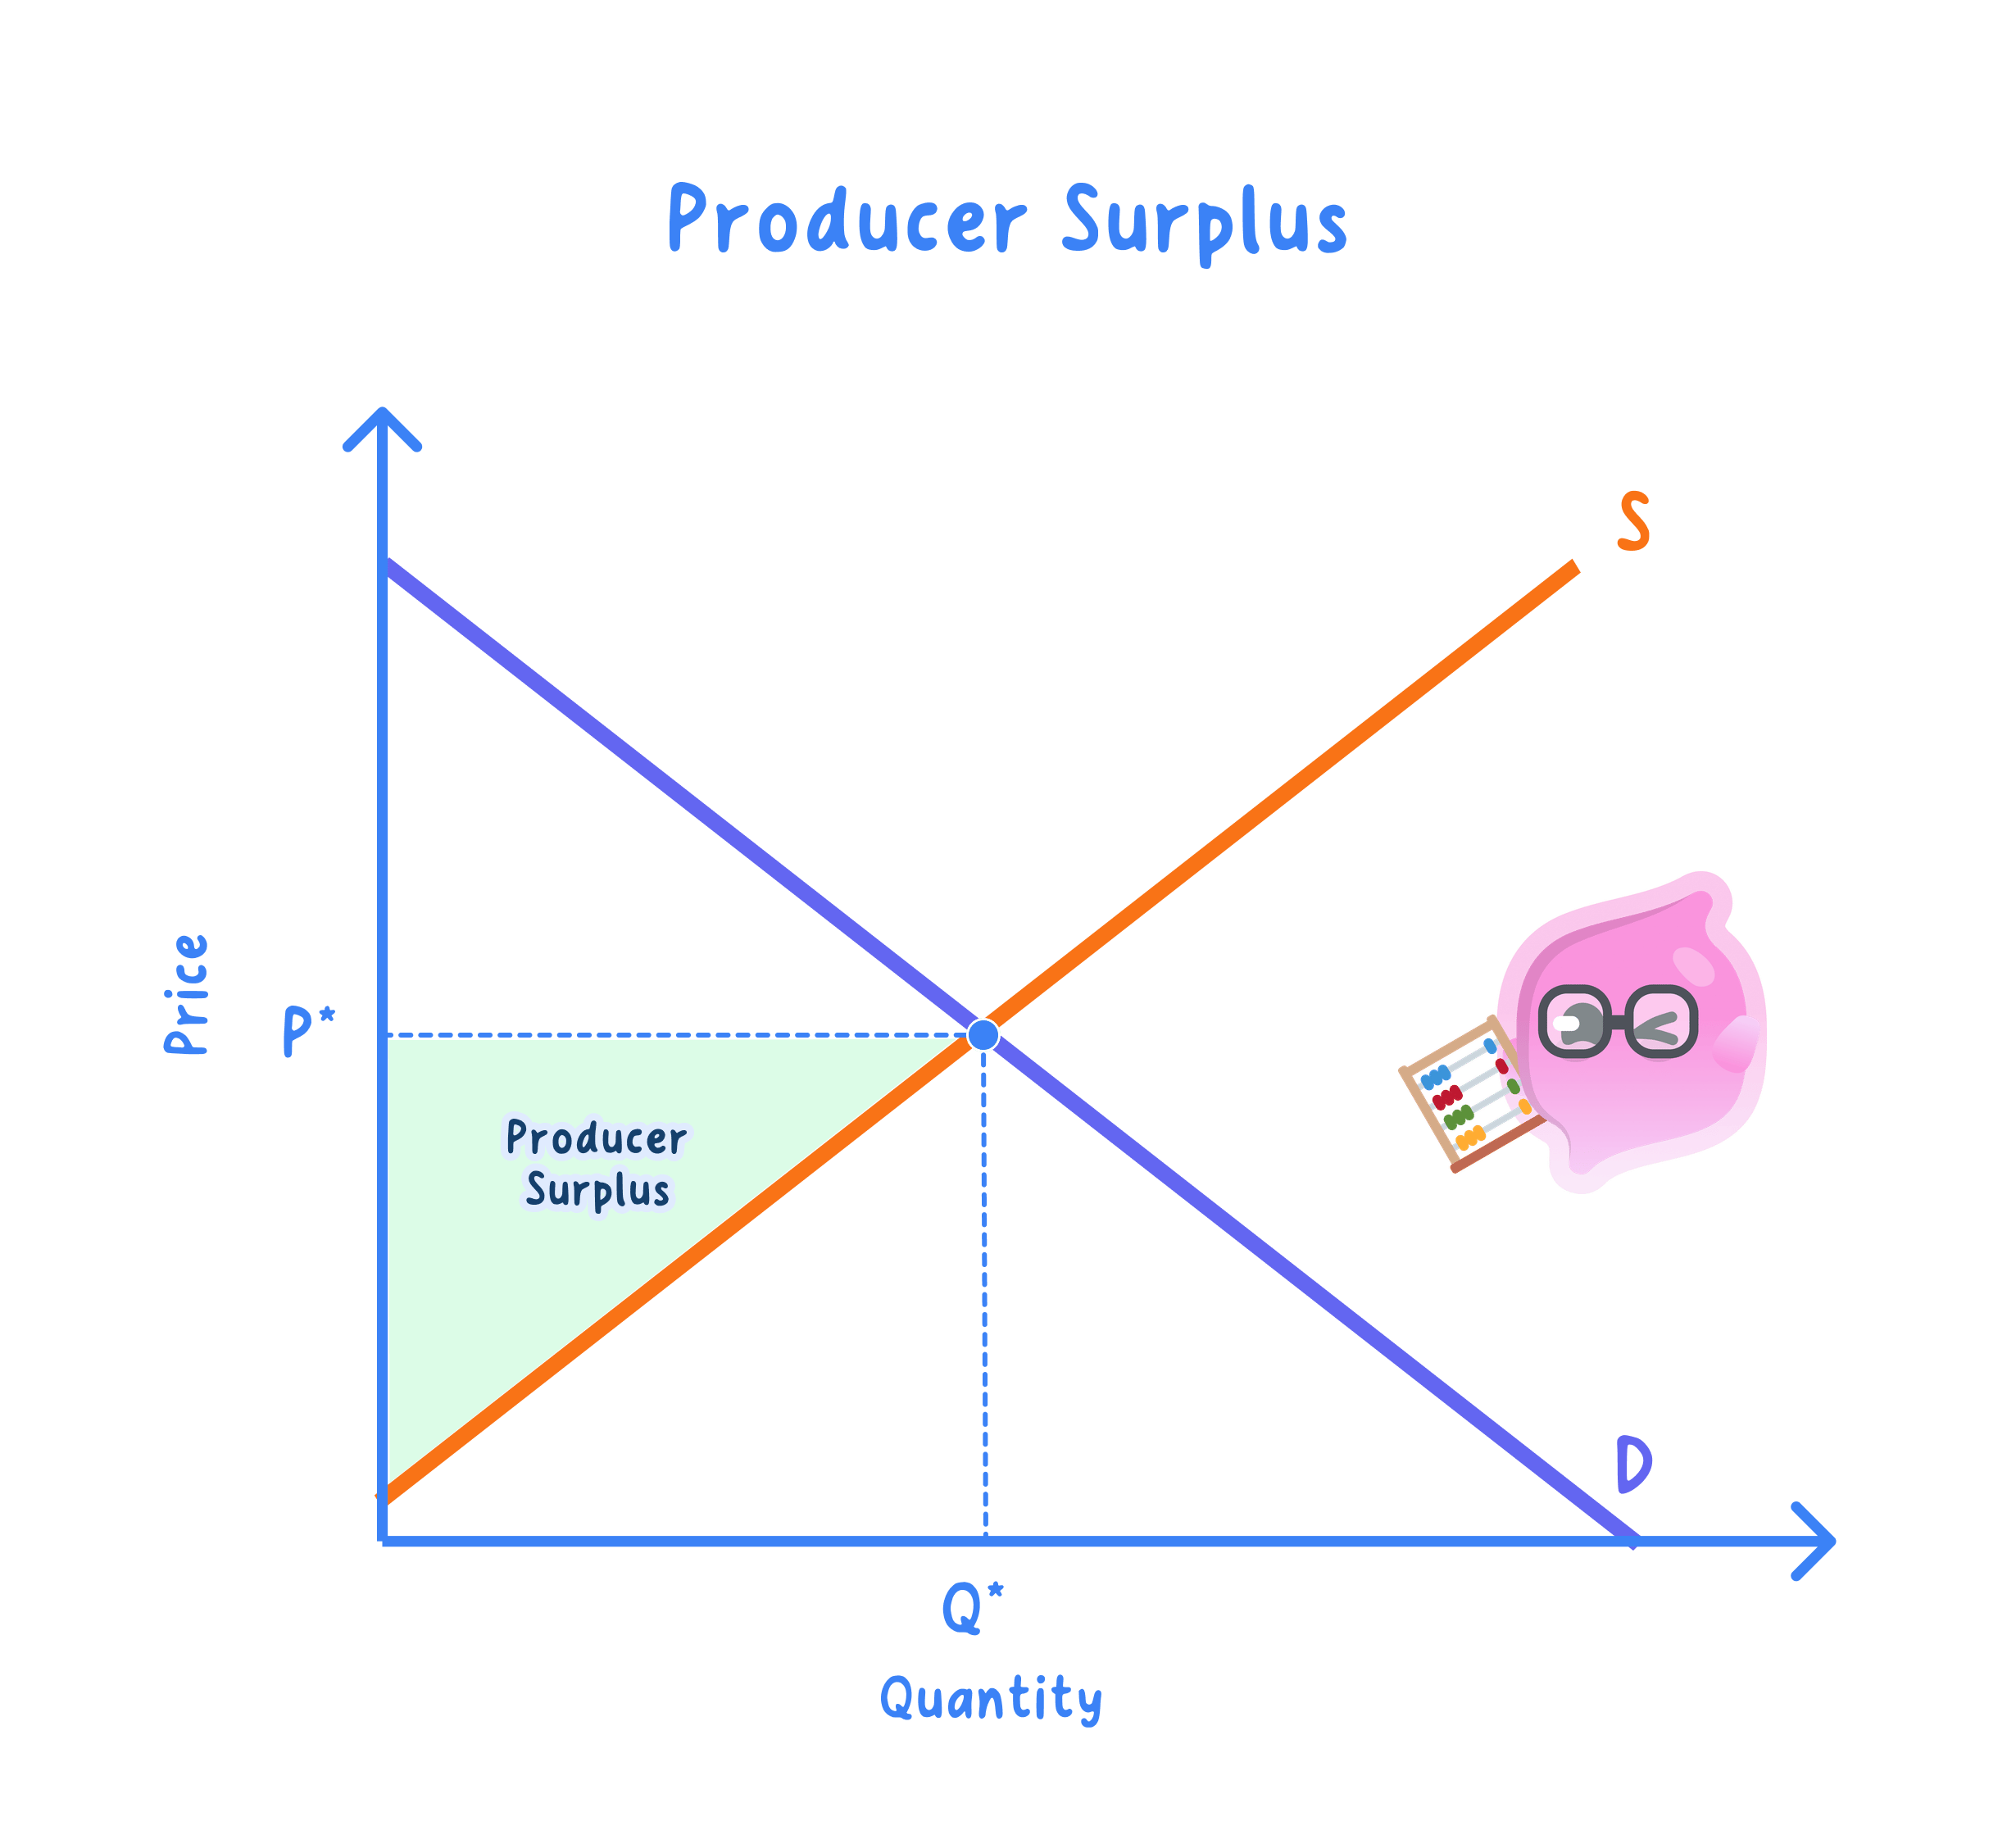
- Producer surplus is the area above the supply curve and below the price.
- Together they form the area between the two curves up to the equilibrium quantity.
Example
- Suppose the price is £5\pounds 5£5 and a buyer would have paid £8\pounds 8£8.
- That buyer enjoys a consumer surplus of £8−£5=£3\pounds 8 - \pounds 5 = \pounds 3£8−£5=£3.
- With equilibrium quantity 100 and a demand curve from £10\pounds 10£10, consumer surplus is 0.5×100×£5=£2500.5 \times 100 \times \pounds 5 = \pounds 2500.5×100×£5=£250.
Price Changes and Shifts Redistribute Surplus and Can Create Deadweight Loss
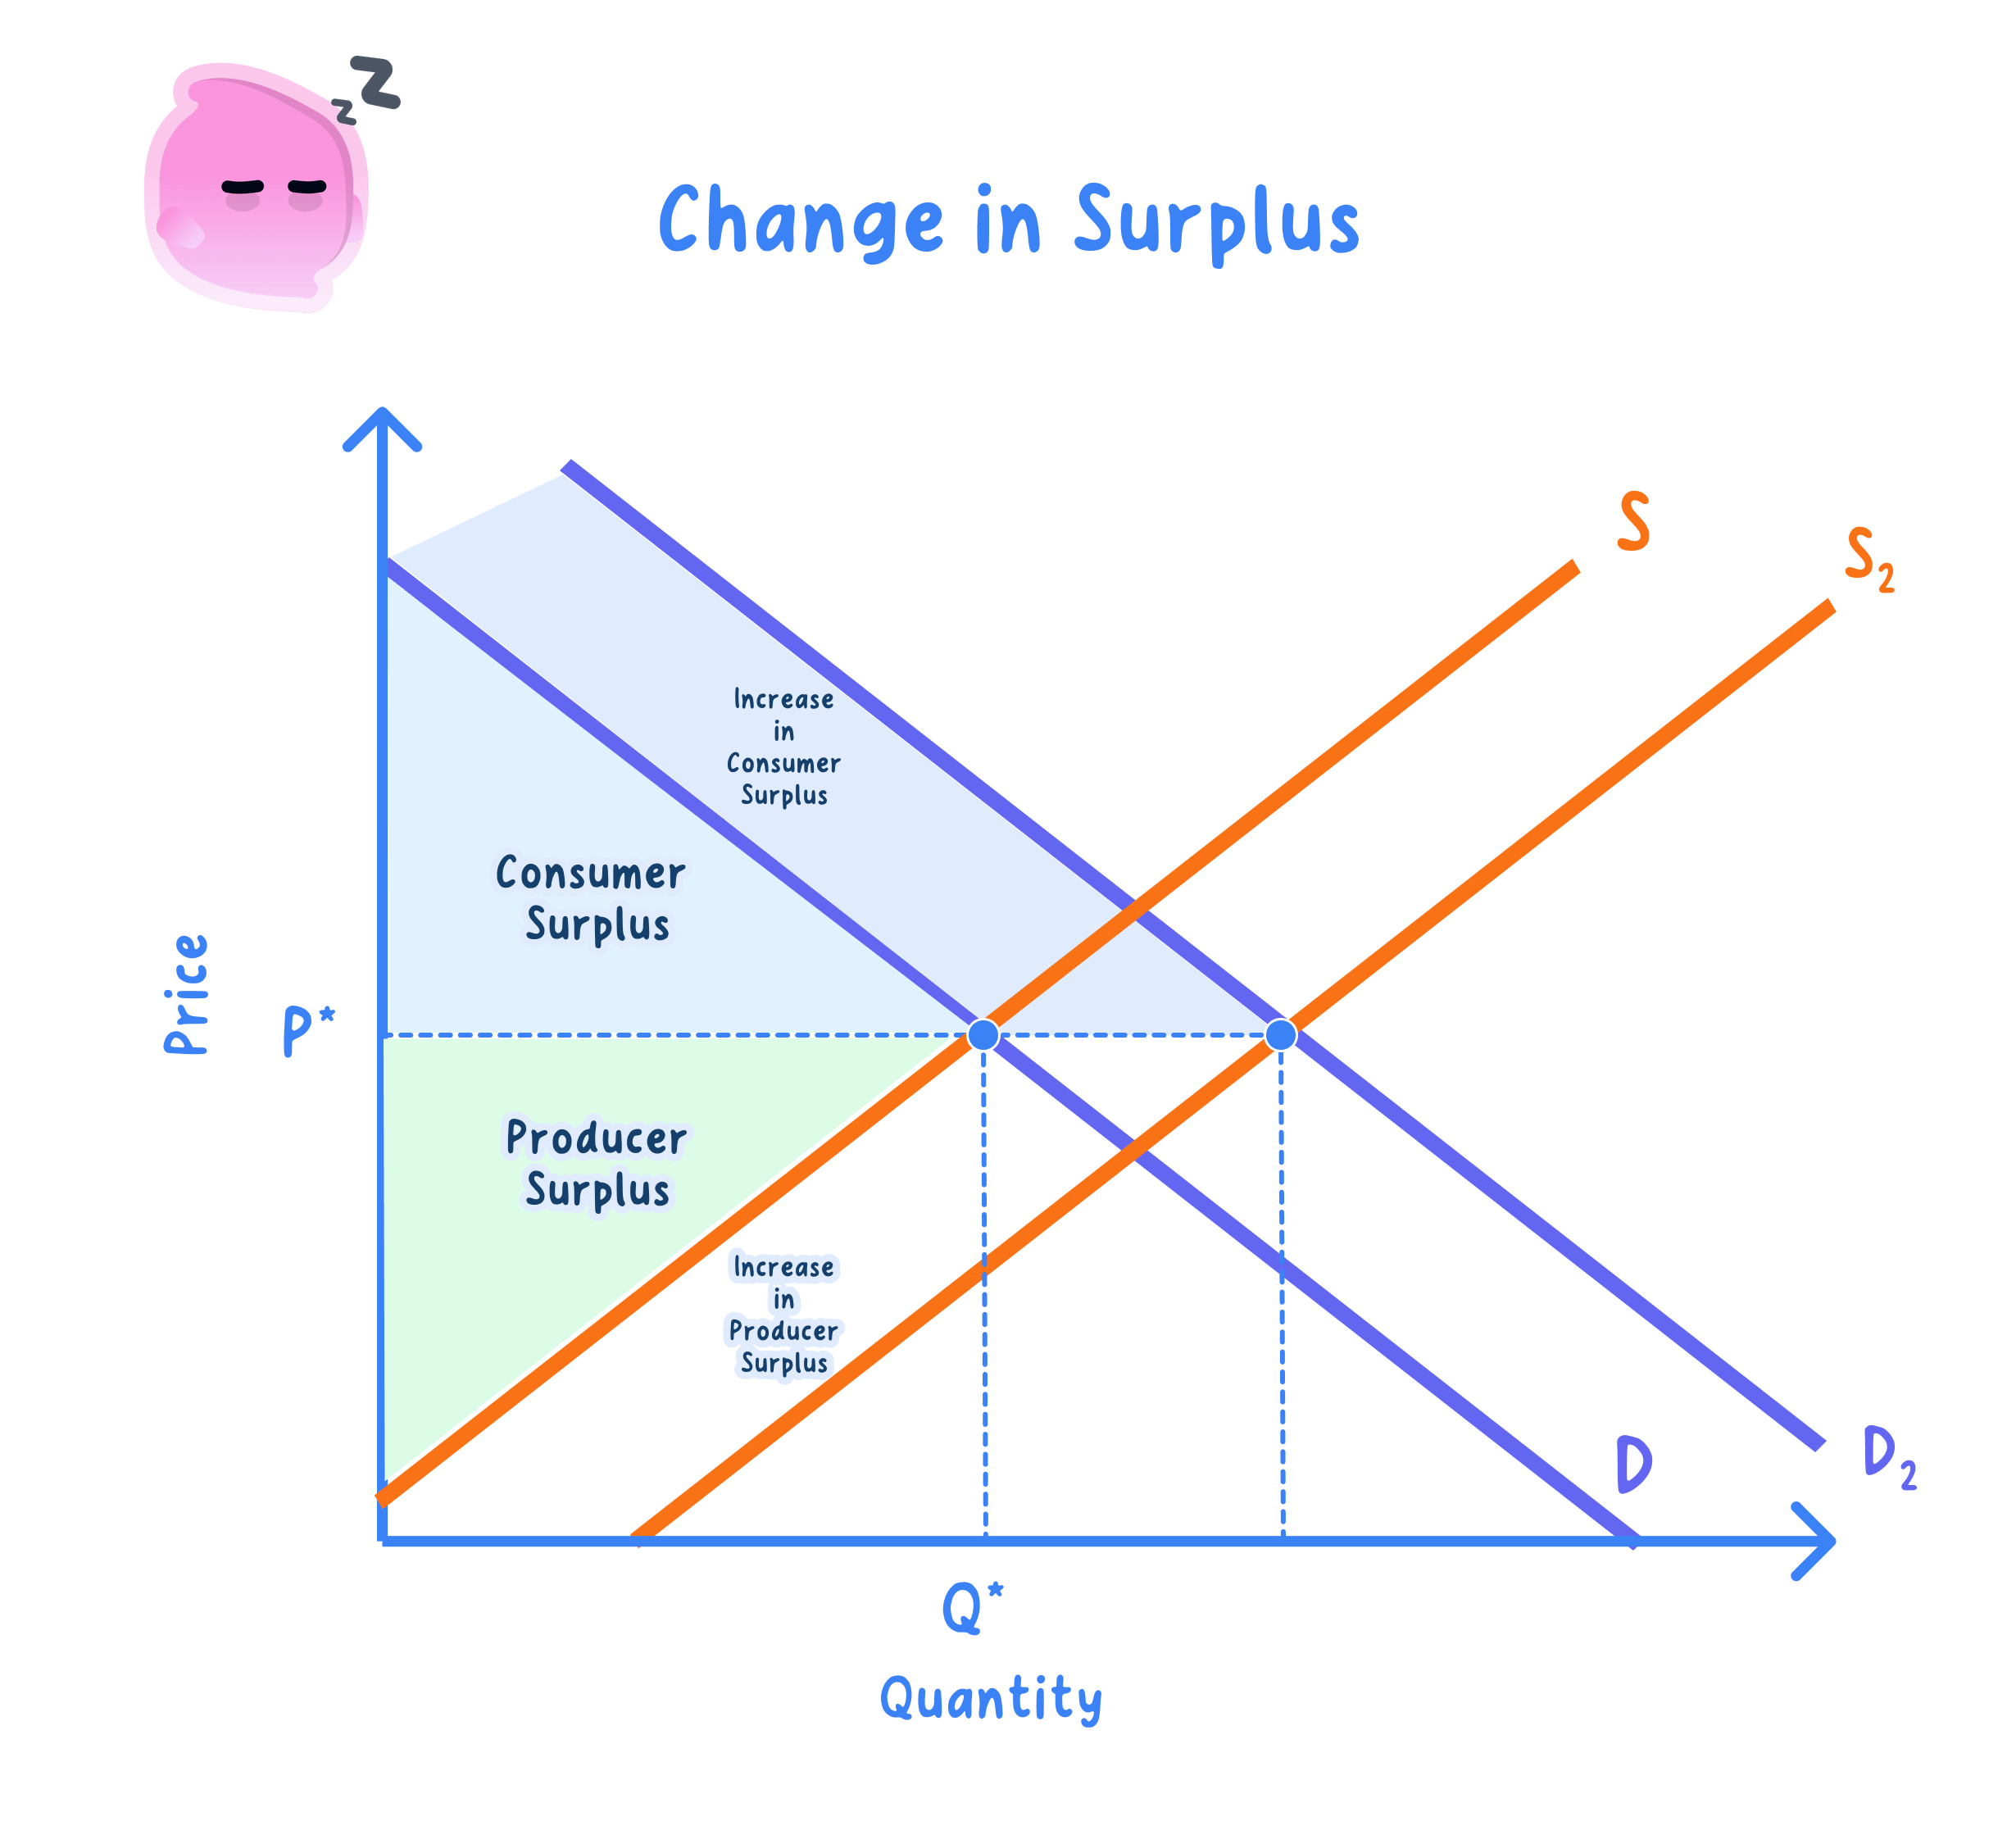
- A fall in price raises consumer surplus and lowers producer surplus.
- A rise in price does the reverse.
- An increase in supply lowers price, raising consumer surplus.
- Moving away from the free-market equilibrium creates a deadweight loss.
Case study
- A tax raises the price to buyers and lowers it for sellers, shrinking both surpluses.
- The lost welfare that goes to neither side is the deadweight loss.
- A subsidy or price control shifts surplus in a similar way.
Surplus Explains the Welfare Cost of Monopoly and the Effect of Price Discrimination
- A monopoly restricts output and raises price, transferring consumer surplus to producers and creating a deadweight welfare loss.
- Price discrimination lets a firm capture consumer surplus by charging each group closer to its willingness to pay.
- These are the main welfare applications of the surplus concepts.
The Size of Any Welfare Change Depends on Elasticity
- The size of each change depends on the elasticities of demand and supply.
- With inelastic demand, consumers bear more of a price change.
- With inelastic supply, producers bear more of it.
- On balance, the direction of the welfare change is clear from the shift, but its size depends on how elastic demand and supply are.
Label and Shade Each Surplus Area on the Diagram
Exam technique
- Draw the diagram and shade consumer and producer surplus separately.
- Show the new areas after a shift or price change.
- Link the size of the change to elasticity.
Common Mistake
- Do not treat the size of each surplus change as fixed.
- It depends on the elasticities of demand and supply.
Self review
- What is consumer surplus, and where is it shown on a diagram?
- What is producer surplus, and where is it shown?
- Where is total welfare maximised?
- How do monopoly and price discrimination affect consumer and producer surplus?
- What determines the size of a welfare change?
