2.2.2a Movements along and shifts of AD/AS
A Change in the Price Level Moves You Along AD and AS; Anything Else Shifts the Curve
Definition
Aggregate demand: the total planned spending on an economy's goods and services at each price level, made up of consumption, investment, government spending and net exports (C plus I plus G plus (X minus M)).
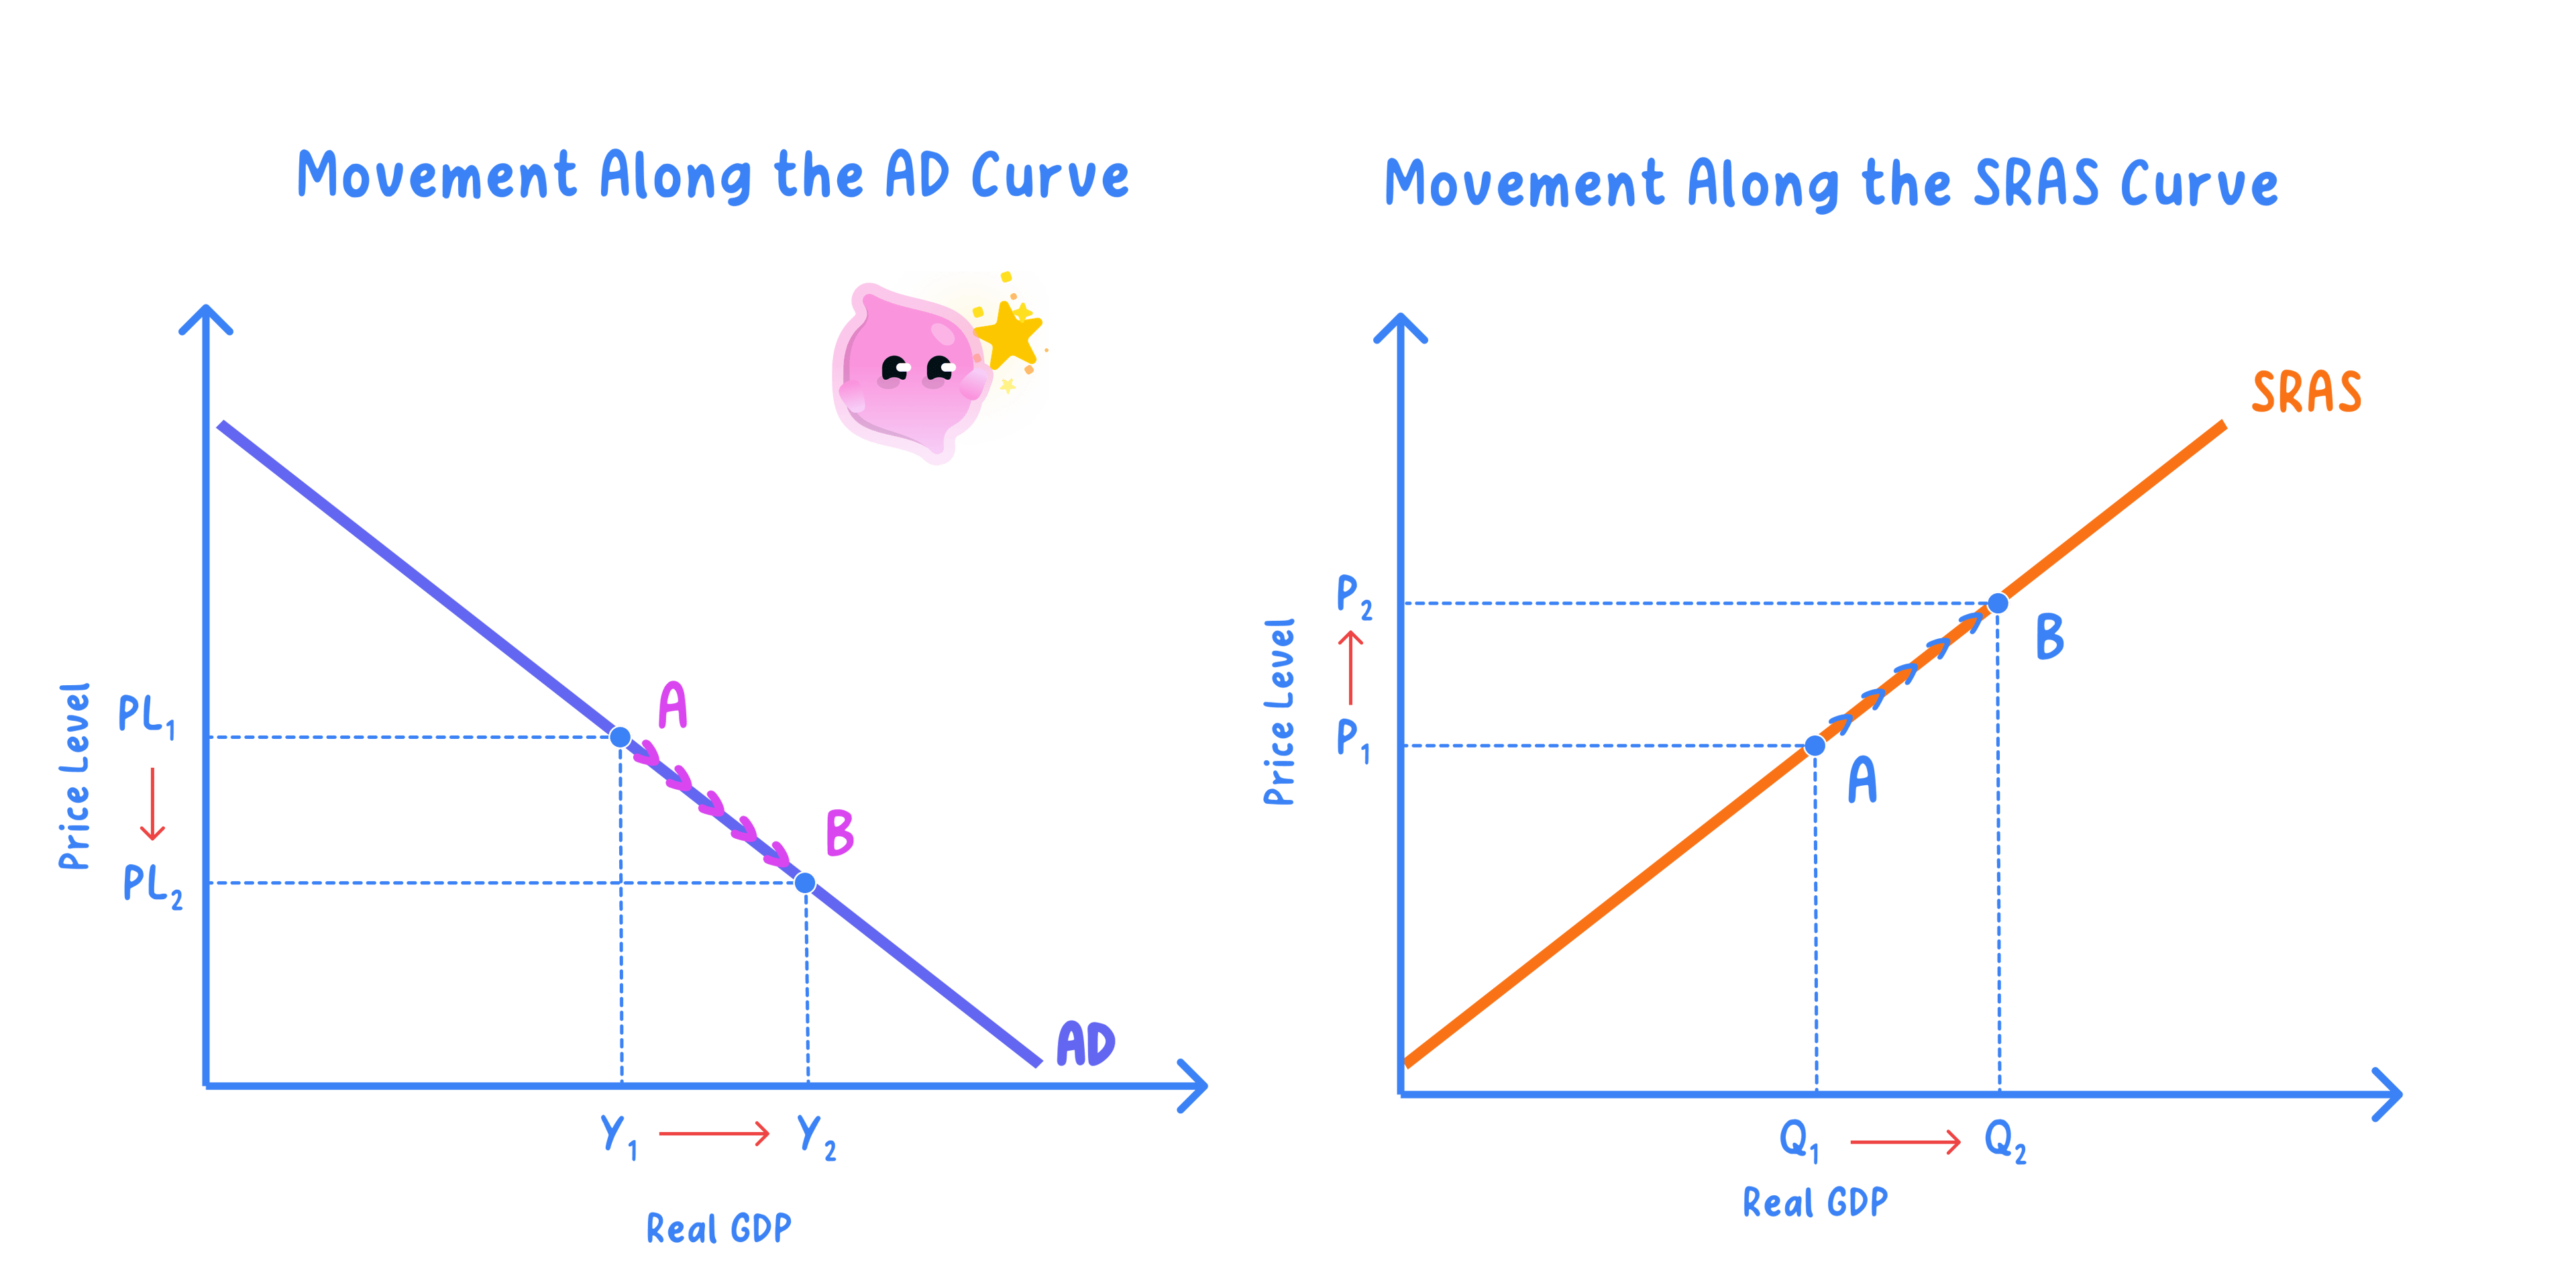
- Both the aggregate demand (AD) and aggregate supply (AS) curves are drawn with the average price level on the vertical axis and real output (real GDP) on the horizontal axis.
- A movement along the curve comes from a change in the price level.
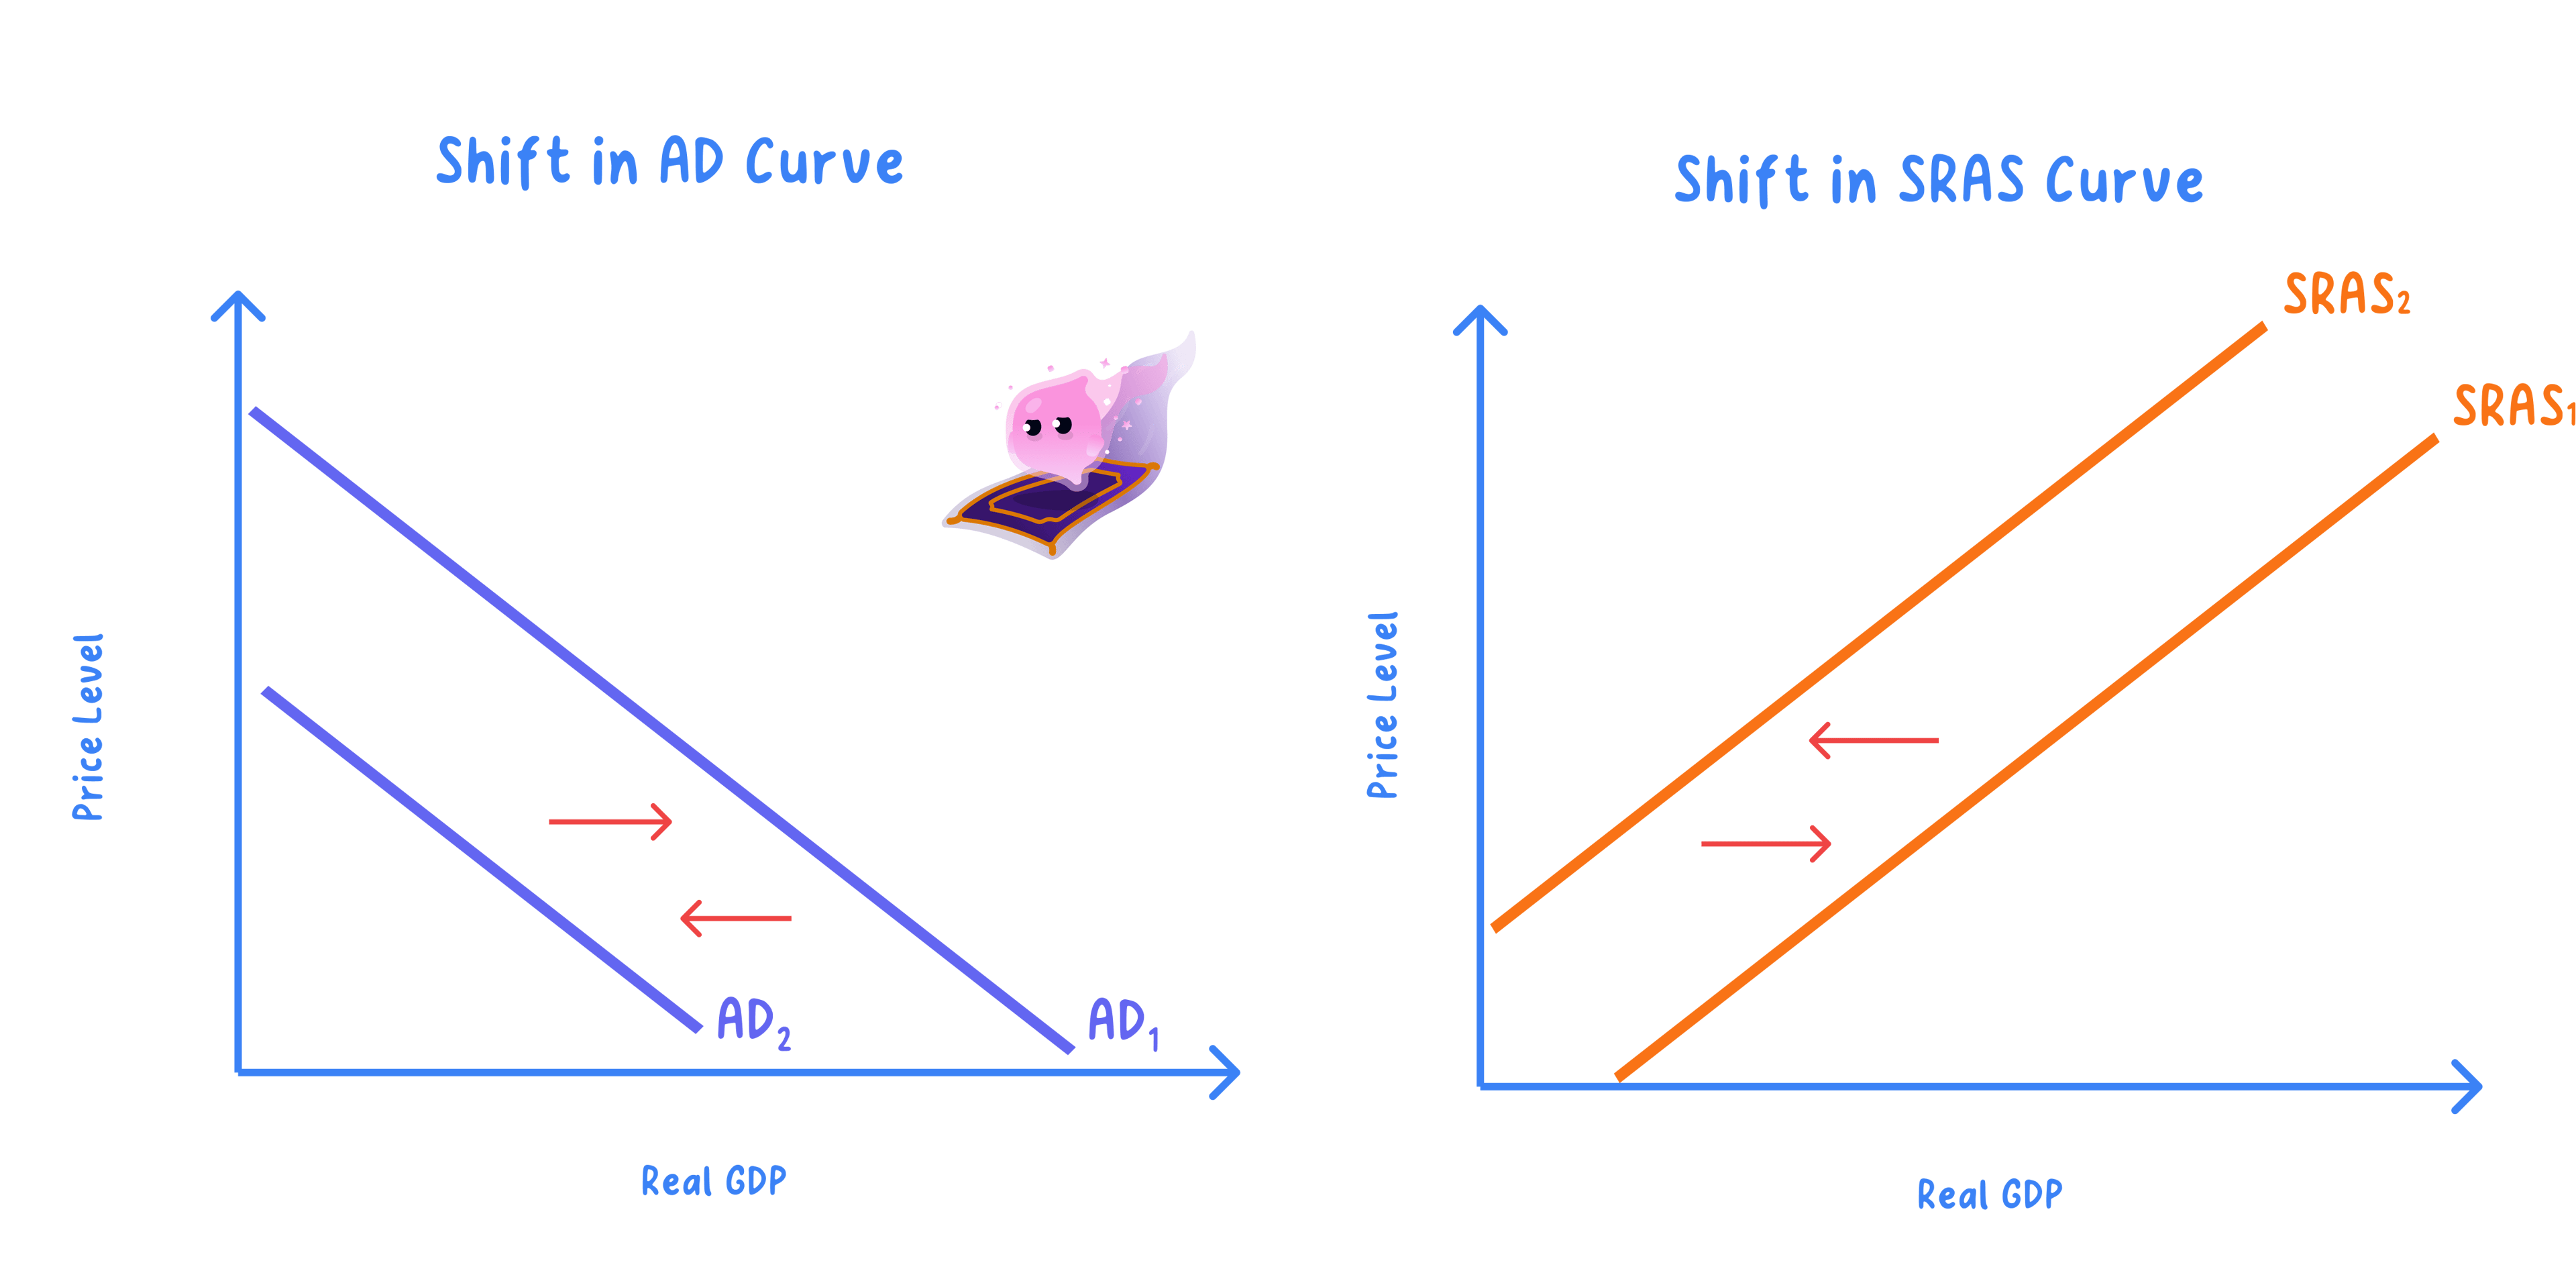
- A shift of the whole curve comes from a change in a non-price determinant, such as spending, costs or productive capacity.
Note
- A movement along the curve comes from a change in the price level.
- A shift comes from a change in a non-price determinant, so always ask what actually changed.
Aggregate Demand Shifts When Planned Spending Changes
- Aggregate demand is total planned spending in the economy: AD=C+I+G+(X−M)AD=C+I+G+(X-M)AD=C+I+G+(X−M).
- Higher C, I, G or net exports shift AD to the right.
- Falls in these components shift AD to the left.
- Changes in confidence, interest rates, income, taxation and the exchange rate move these components and so shift the whole AD curve.
Short-run AS Shifts When Firms' Costs Change
- Short-run aggregate supply (SRAS) shifts when firms' costs of production change, such as wages, raw material and energy prices, and business taxes.
- A rise in these costs shifts SRAS to the left; a fall shifts it to the right.
- Higher productivity lowers unit costs and can shift SRAS to the right.
Long-run AS Reflects Productive Capacity, Not Costs
- Long-run aggregate supply (LRAS) reflects the economy's productive capacity: the quantity and quality of its factors of production, technology, investment, education and skills, and regulation.
- These long-run capacity factors are different from the short-run cost factors that shift SRAS.
- Underlying (trend) economic growth is represented by a rightward shift in the long-run AS curve.
Example
- A rise in energy costs shifts short-run aggregate supply to the left.
- More investment in capital shifts long-run aggregate supply to the right.
Common Mistake
- The single most common error is confusing a movement along a curve with a shift of it.
- Only a change in the price level moves you along AD or AS; a change in spending, costs or capacity shifts the whole curve.
Say Which Curve Moves and Why
Exam technique
- Decide whether a change is a movement along the curve (a price-level change) or a shift (a non-price determinant).
- For a shift, state whether it moves AD, SRAS or LRAS, and in which direction.
- Label the axes average price level and real output.
Common Mistake
- Do not treat a change in the price level as a shift of the curve.
- A price-level change is a movement along the curve, and the axes are the average price level and real output, not price and quantity.
Self review
- What are the axes of the AD and AS curves?
- What causes a movement along a curve, and what causes a shift?
- State the aggregate demand identity and name a factor that shifts AD.
- Name two factors that shift short-run AS.
- What determines long-run AS, and how is underlying economic growth shown on the diagram?
2.2.2b Macroeconomic equilibrium and shocks
Equilibrium Is Where AD Meets AS and Fixes Output and the Price Level
Definition
Macroeconomic equilibrium: the point where aggregate demand equals aggregate supply, which determines the economy's equilibrium level of real output and the average price level.
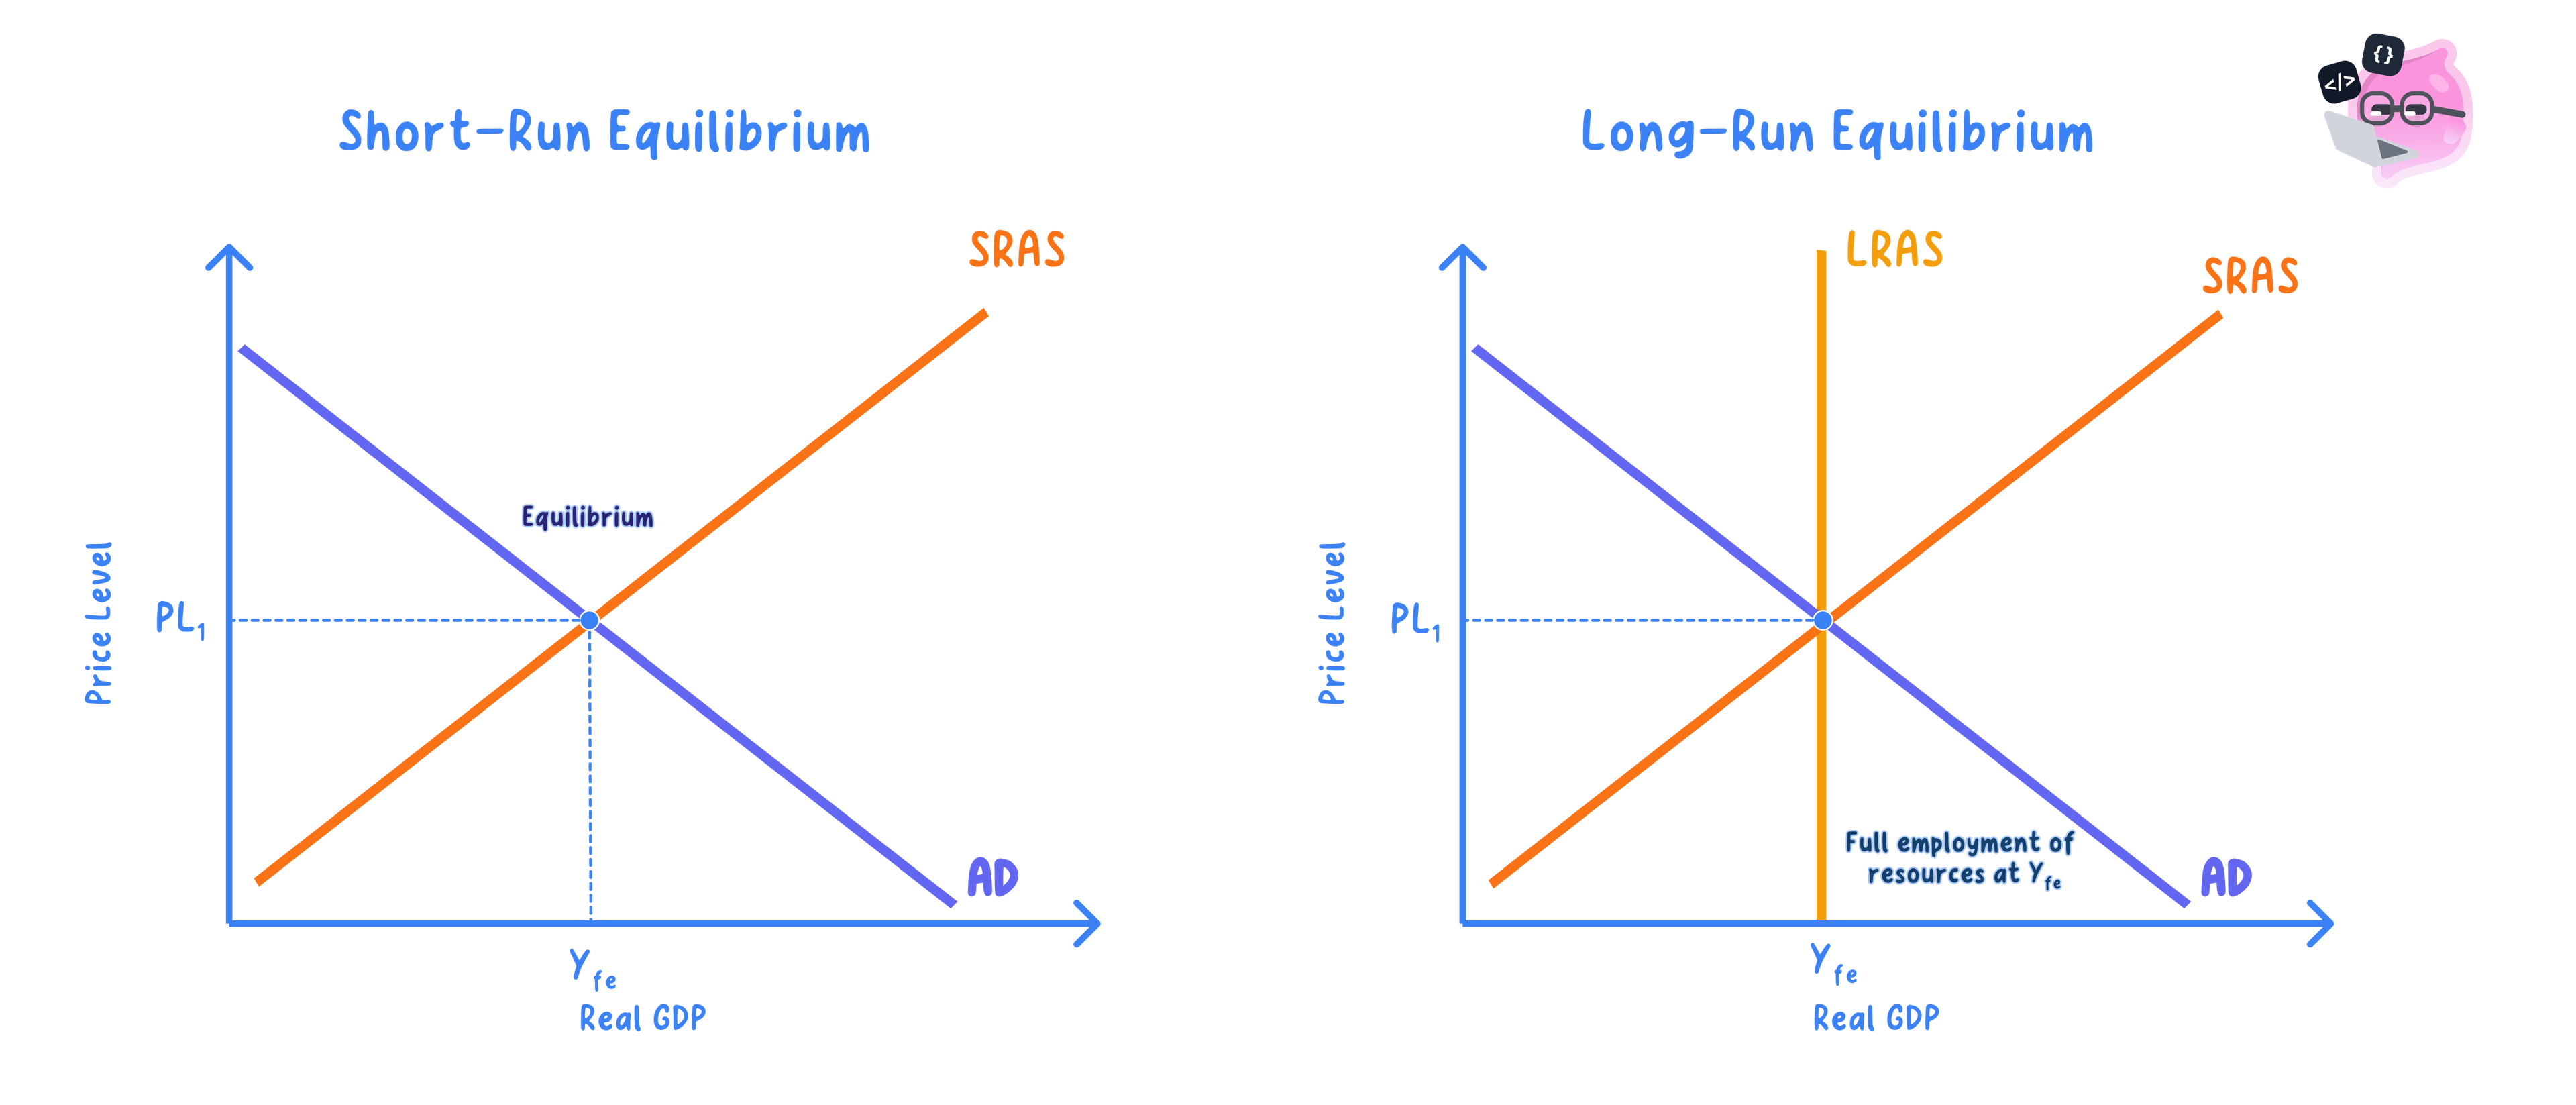
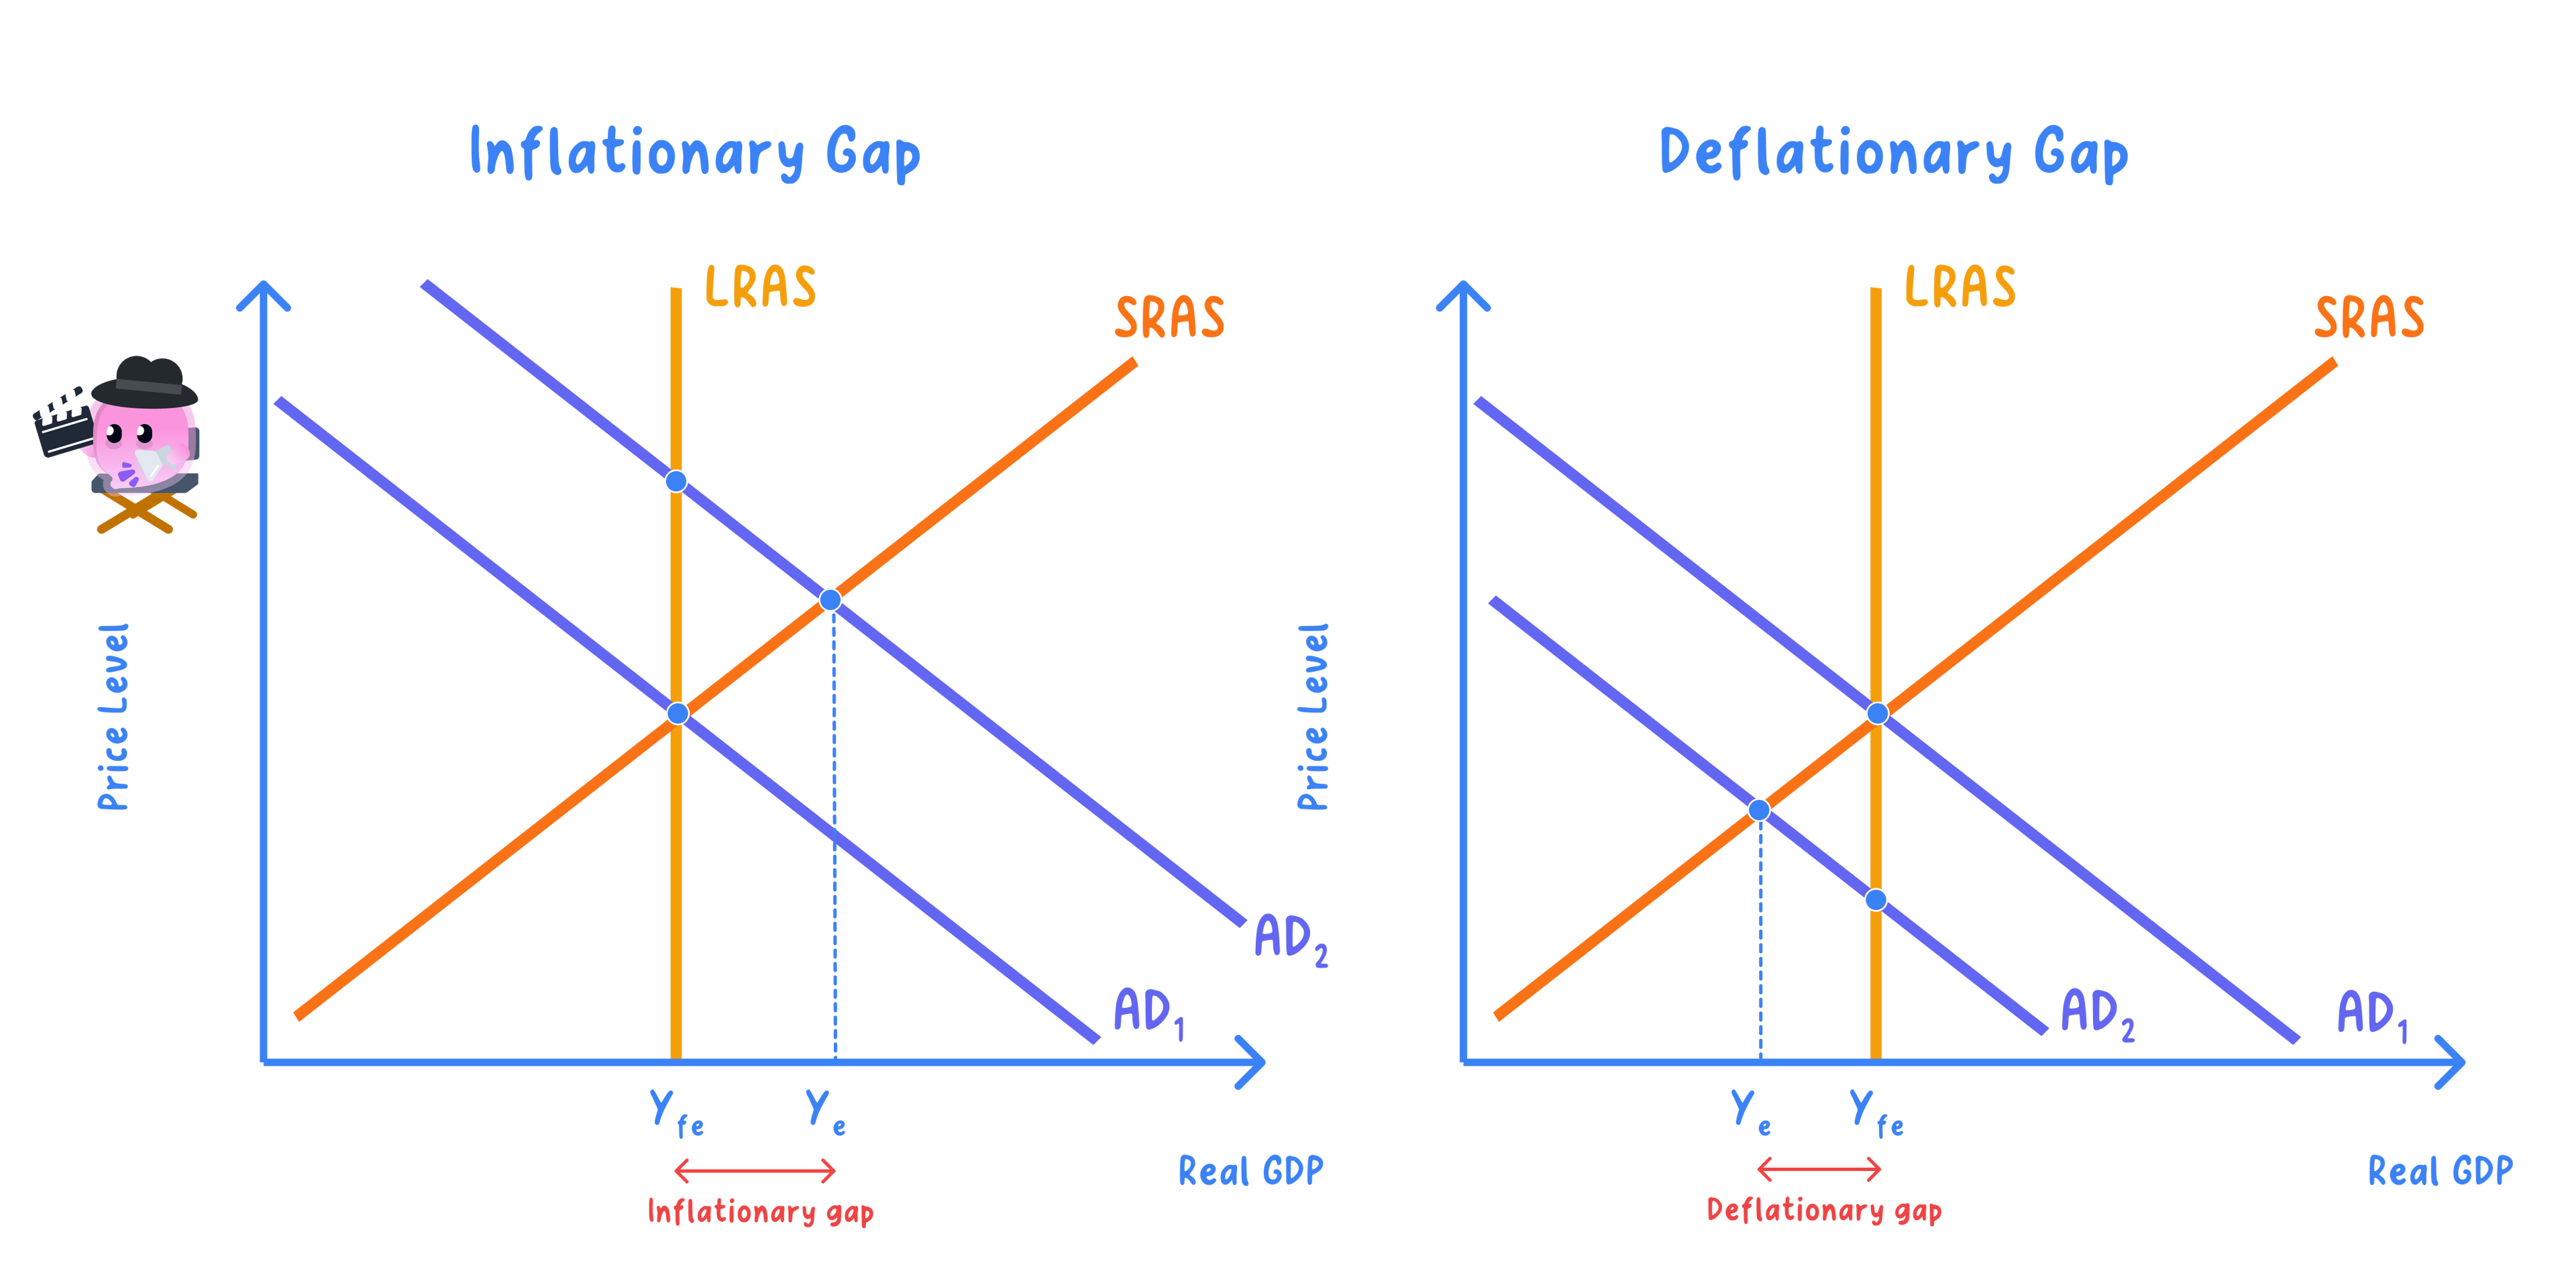
- Macroeconomic equilibrium is where aggregate demand equals aggregate supply.
- It sets the equilibrium level of real output and the price level.
- By implication it also shapes the level of employment.
Note
- Equilibrium fixes both real output and the average price level.
- A shift in AD or AS moves the economy to a new equilibrium.
The AD/AS Diagram Runs on the Average Price Level and Real Output
- The axes are the average price level on the vertical axis and real output on the horizontal axis.
- A rightward AD shift raises output and the price level.
- A rightward AS shift raises output and tends to lower the price level.
Example
- A demand-side shock shifts AD and moves both output and the price level in the same direction.
- A supply-side shock shifts AS and moves output and the price level in opposite directions.
Tracing a Demand-side Shock, Step by Step
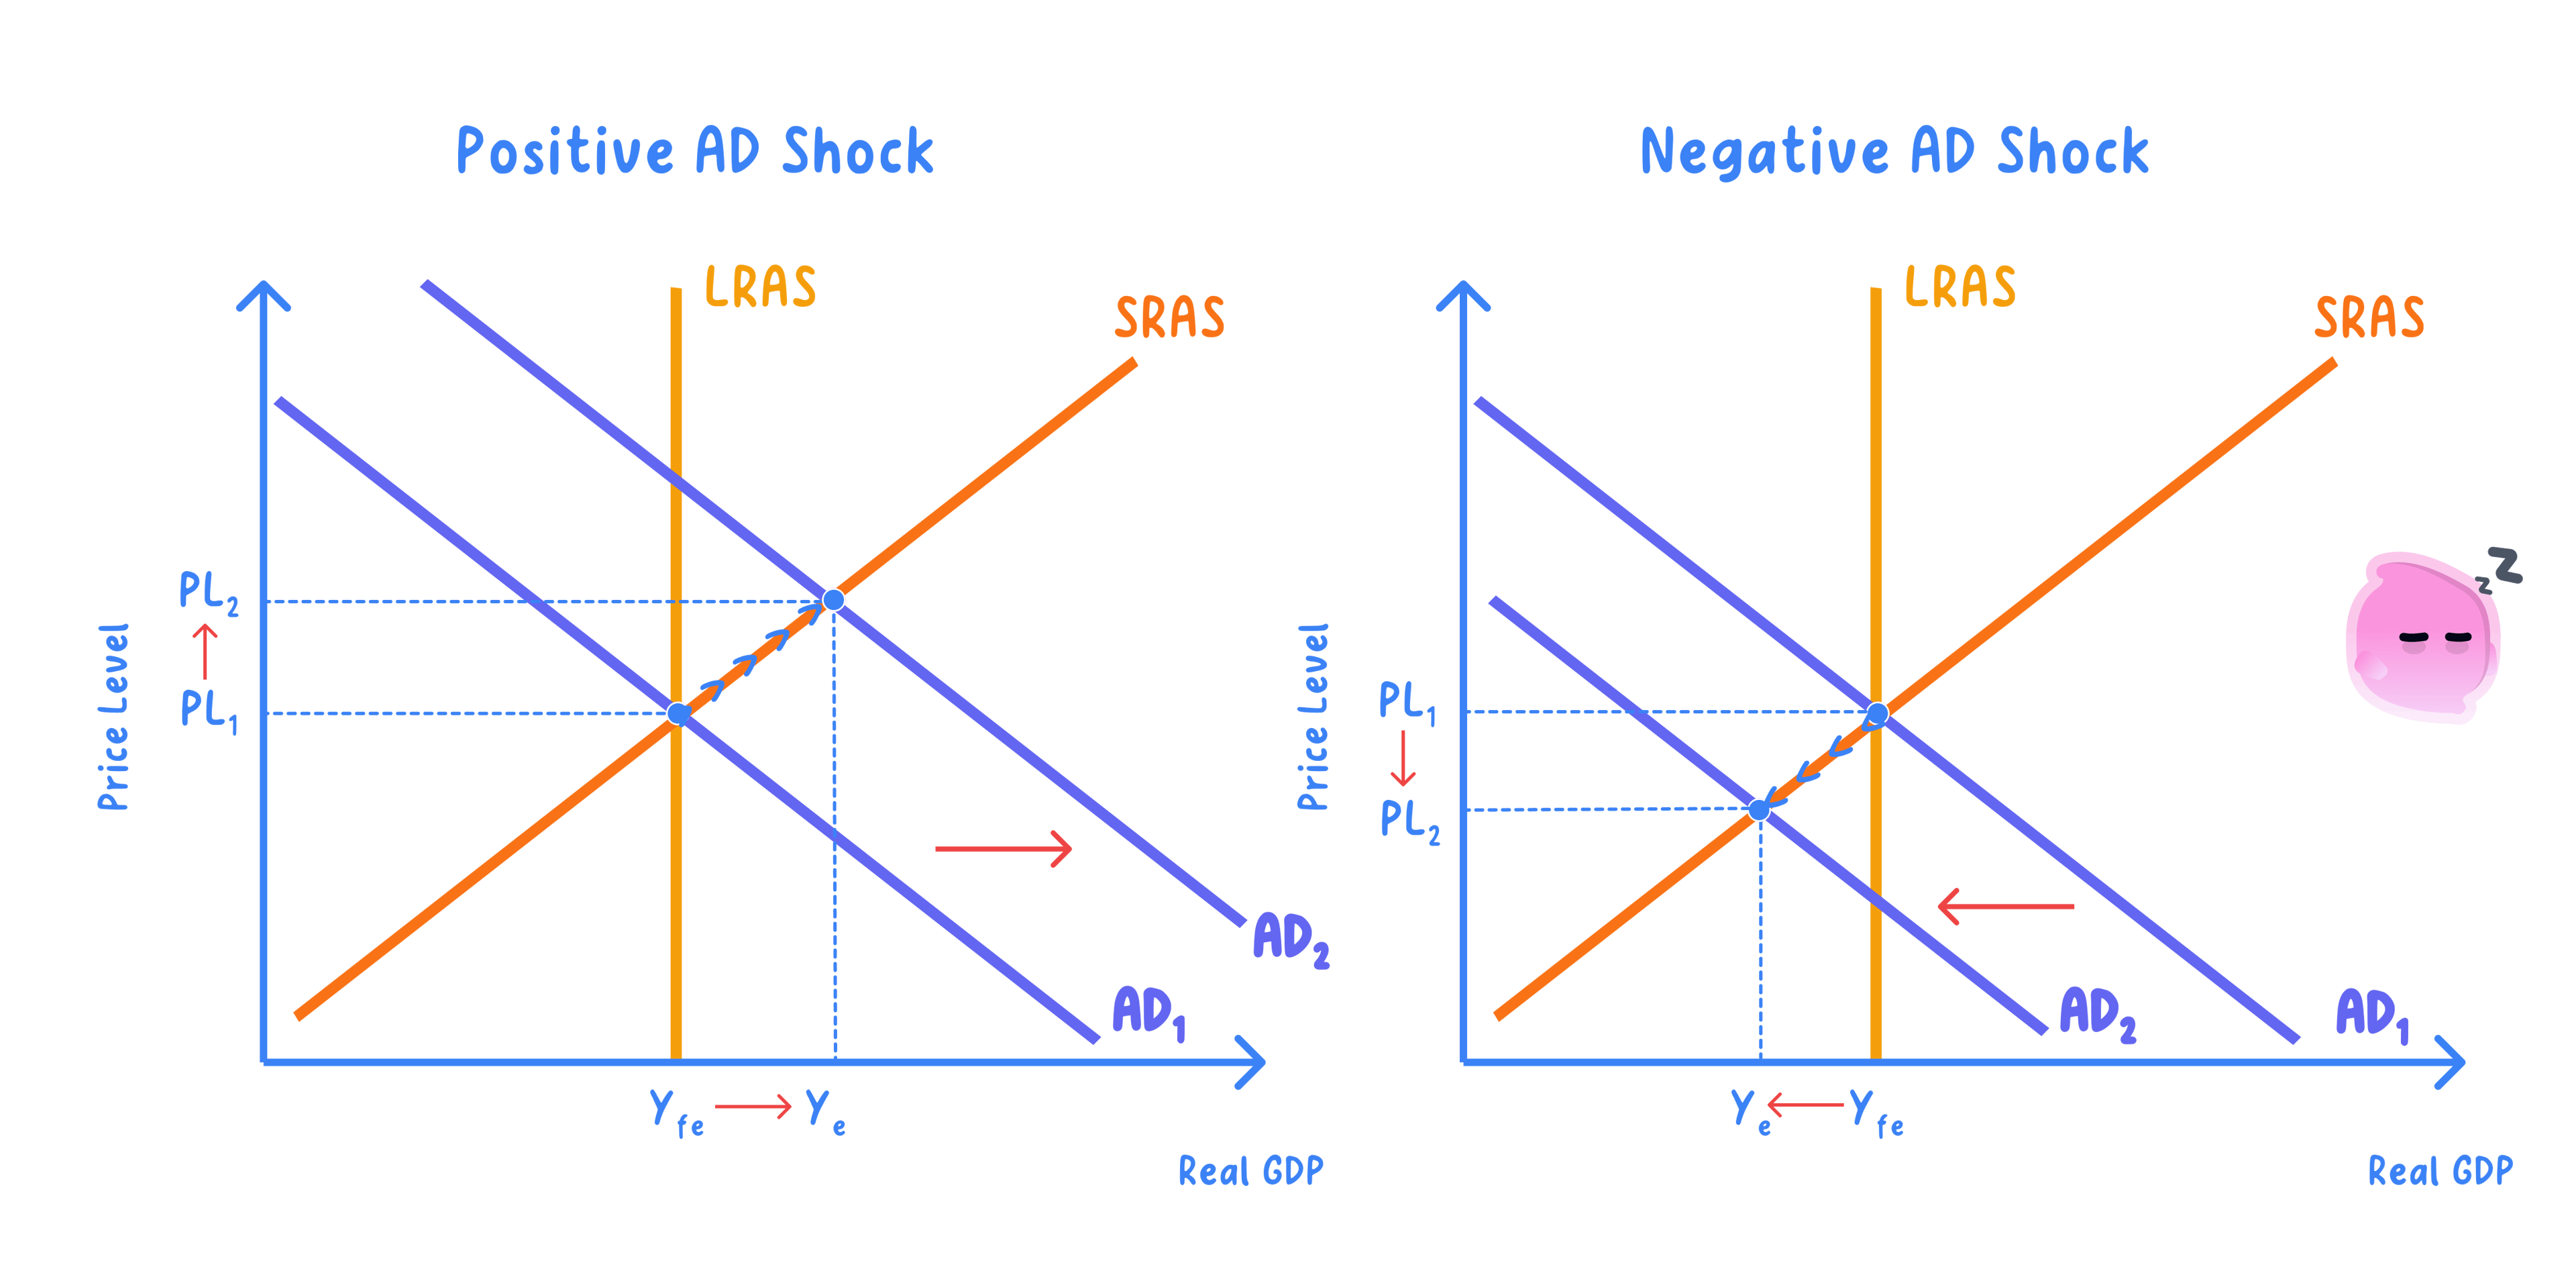
- Start at equilibrium where AD1 crosses SRAS, giving an initial price level and level of output.
- Suppose a fall in consumer and business confidence cuts C and I: this negative demand shock shifts AD left from AD1 to AD2.
- At the old price level there is now excess supply, so firms cut output and prices, moving down along SRAS.
- The new equilibrium has lower real output and a lower price level, so a negative demand shock brings recession, rising demand-deficient (cyclical) unemployment and easing inflation, as in the 2008 to 2009 downturn.
A Supply-side Shock Can Raise Prices and Cut Output at Once
- Start again at equilibrium where AD crosses SRAS1.
- Suppose a sharp rise in global energy prices raises firms' costs: this negative supply shock shifts SRAS left from SRAS1 to SRAS2.
- With AD unchanged, the new equilibrium sits at a higher price level but lower real output.
- This mix of rising prices and falling output is stagflation, seen in the UK after the 2022 energy price spike.
Analogy
- A demand shock is like pressing or easing the accelerator: output and prices move together.
- A negative supply shock is like the road suddenly getting steeper: it costs more to go the same distance, so prices rise while output falls.
Every Shift Moves Output and the Price Level, so Read Both
- Every shift changes both output and the price level.
- Reading only one misses half the effect.
- So trace both the output effect and the price effect from the diagram.
When AD and AS Shift at Once, Separate the Output and Price Effects
- AD and AS can move at the same time.
- The output effects may reinforce each other while the price effects offset.
- So the net effect on output and prices depends on the relative size of the two shifts.
Example
- A consumer boom shifts AD right and lifts the price level.
- A productivity gain shifts AS right and helps hold prices down, so output can rise strongly with little inflation.
Exam technique
- For any shock, state the effect on real output and on the price level separately.
- Label the axes average price level and real output, and mark the old and new equilibrium.
Common Mistake
- Do not read the diagram only for output and ignore the price level.
- A negative supply shock is the classic trap: output falls while prices rise.
Self review
- Where is macroeconomic equilibrium?
- What does it determine?
- What are the axes of the diagram?
- Trace what a negative demand shock does to output and the price level.
- Why does a negative supply shock cause stagflation?
