2.2.1a National income concepts
National Income Measures the Economy's Total Output, Income and Spending
Definition
National income: the total value of all goods and services produced in an economy over a given period, equal to the total of incomes earned by the factors of production and to total expenditure on output.
- National income is the total value of goods and services produced over a period.
- It equals the total of incomes earned by the factors of production.
- It is the central measure of overall economic activity, and the foundation of macroeconomic data on growth and living standards.
Note
- Output, income and expenditure are three views of the same total.
- In principle they give the same figure.
Output, Income and Spending Are Three Routes to the Same Total
- The output approach adds the value of what is produced.
- The income approach adds the incomes earned in producing it.
- The expenditure approach adds spending on the output, which underlies aggregate demand as C+I+G+(X−M)C+I+G+(X-M)C+I+G+(X−M).
Example
- Every pound of output becomes a pound of income for someone.
- That income is then spent, so the three totals match.
Real Values Strip out Inflation so Comparisons Over Time Are Meaningful
- Nominal values measure output at current prices.
- Real values are adjusted to remove inflation, at constant prices.
- Real GDP and real GDP per capita are the meaningful measures over time.
Note
- Value is a money total; volume is the quantity of output.
- A price index or deflator converts nominal to real figures.
Converting Nominal to Real Removes the Effect of Rising Prices
- The formula is real value=nominal value×100price index or deflator\text{real value}=\text{nominal value}\times\dfrac{100}{\text{price index or deflator}}real value=nominal value×price index or deflator100.
- As a quick check, real growth is roughly nominal growth minus the inflation rate: real growth≈nominal growth−inflation rate\text{real growth}\approx\text{nominal growth}-\text{inflation rate}real growth≈nominal growth−inflation rate.
- So a rise in the money value that comes only from higher prices is not real growth.
Example
- Worked example: nominal GDP is £2,400 billion and the GDP deflator is 120, with the base year set at 100.
- Real GDP at base-year prices equals £2,400bn×100120=£2,400bn×0.833=£2,000bn\pounds 2{,}400\text{bn}\times\dfrac{100}{120}=\pounds 2{,}400\text{bn}\times 0.833=\pounds 2{,}000\text{bn}£2,400bn×120100=£2,400bn×0.833=£2,000bn.
- So real output is worth £2,000 billion at base-year prices; the extra £400 billion in the nominal figure is only higher prices, not more goods and services.
- As a shortcut, if nominal GDP rises 5%5\%5% while inflation is 2%2\%2%, real growth is about 3%3\%3%.
Real National Income Is the Honest Gauge of Economic Performance
- Nominal figures can rise just because prices rise.
- Real figures show genuine changes in the volume of output.
- So economic performance is judged in real terms.
In the Exam, Deflate Before You Compare
Exam technique
- Convert nominal figures to real using the price index before comparing years.
- For a quick estimate of real growth, subtract the inflation rate from nominal growth.
Common Mistake
- Do not compare nominal figures across years without adjusting for inflation.
- That overstates real growth.
Self review
- Define national income.
- Do the output, income and expenditure methods give the same total?
- Define a nominal value and a real value.
- If nominal GDP is £2,100 billion and the deflator is 105, what is real GDP at base-year prices?
- Why is real national income the better guide to economic performance?
2.2.1b Circular flow, injections and withdrawals
Income, Output and Expenditure Are Three Views of One Circular Flow
Definition
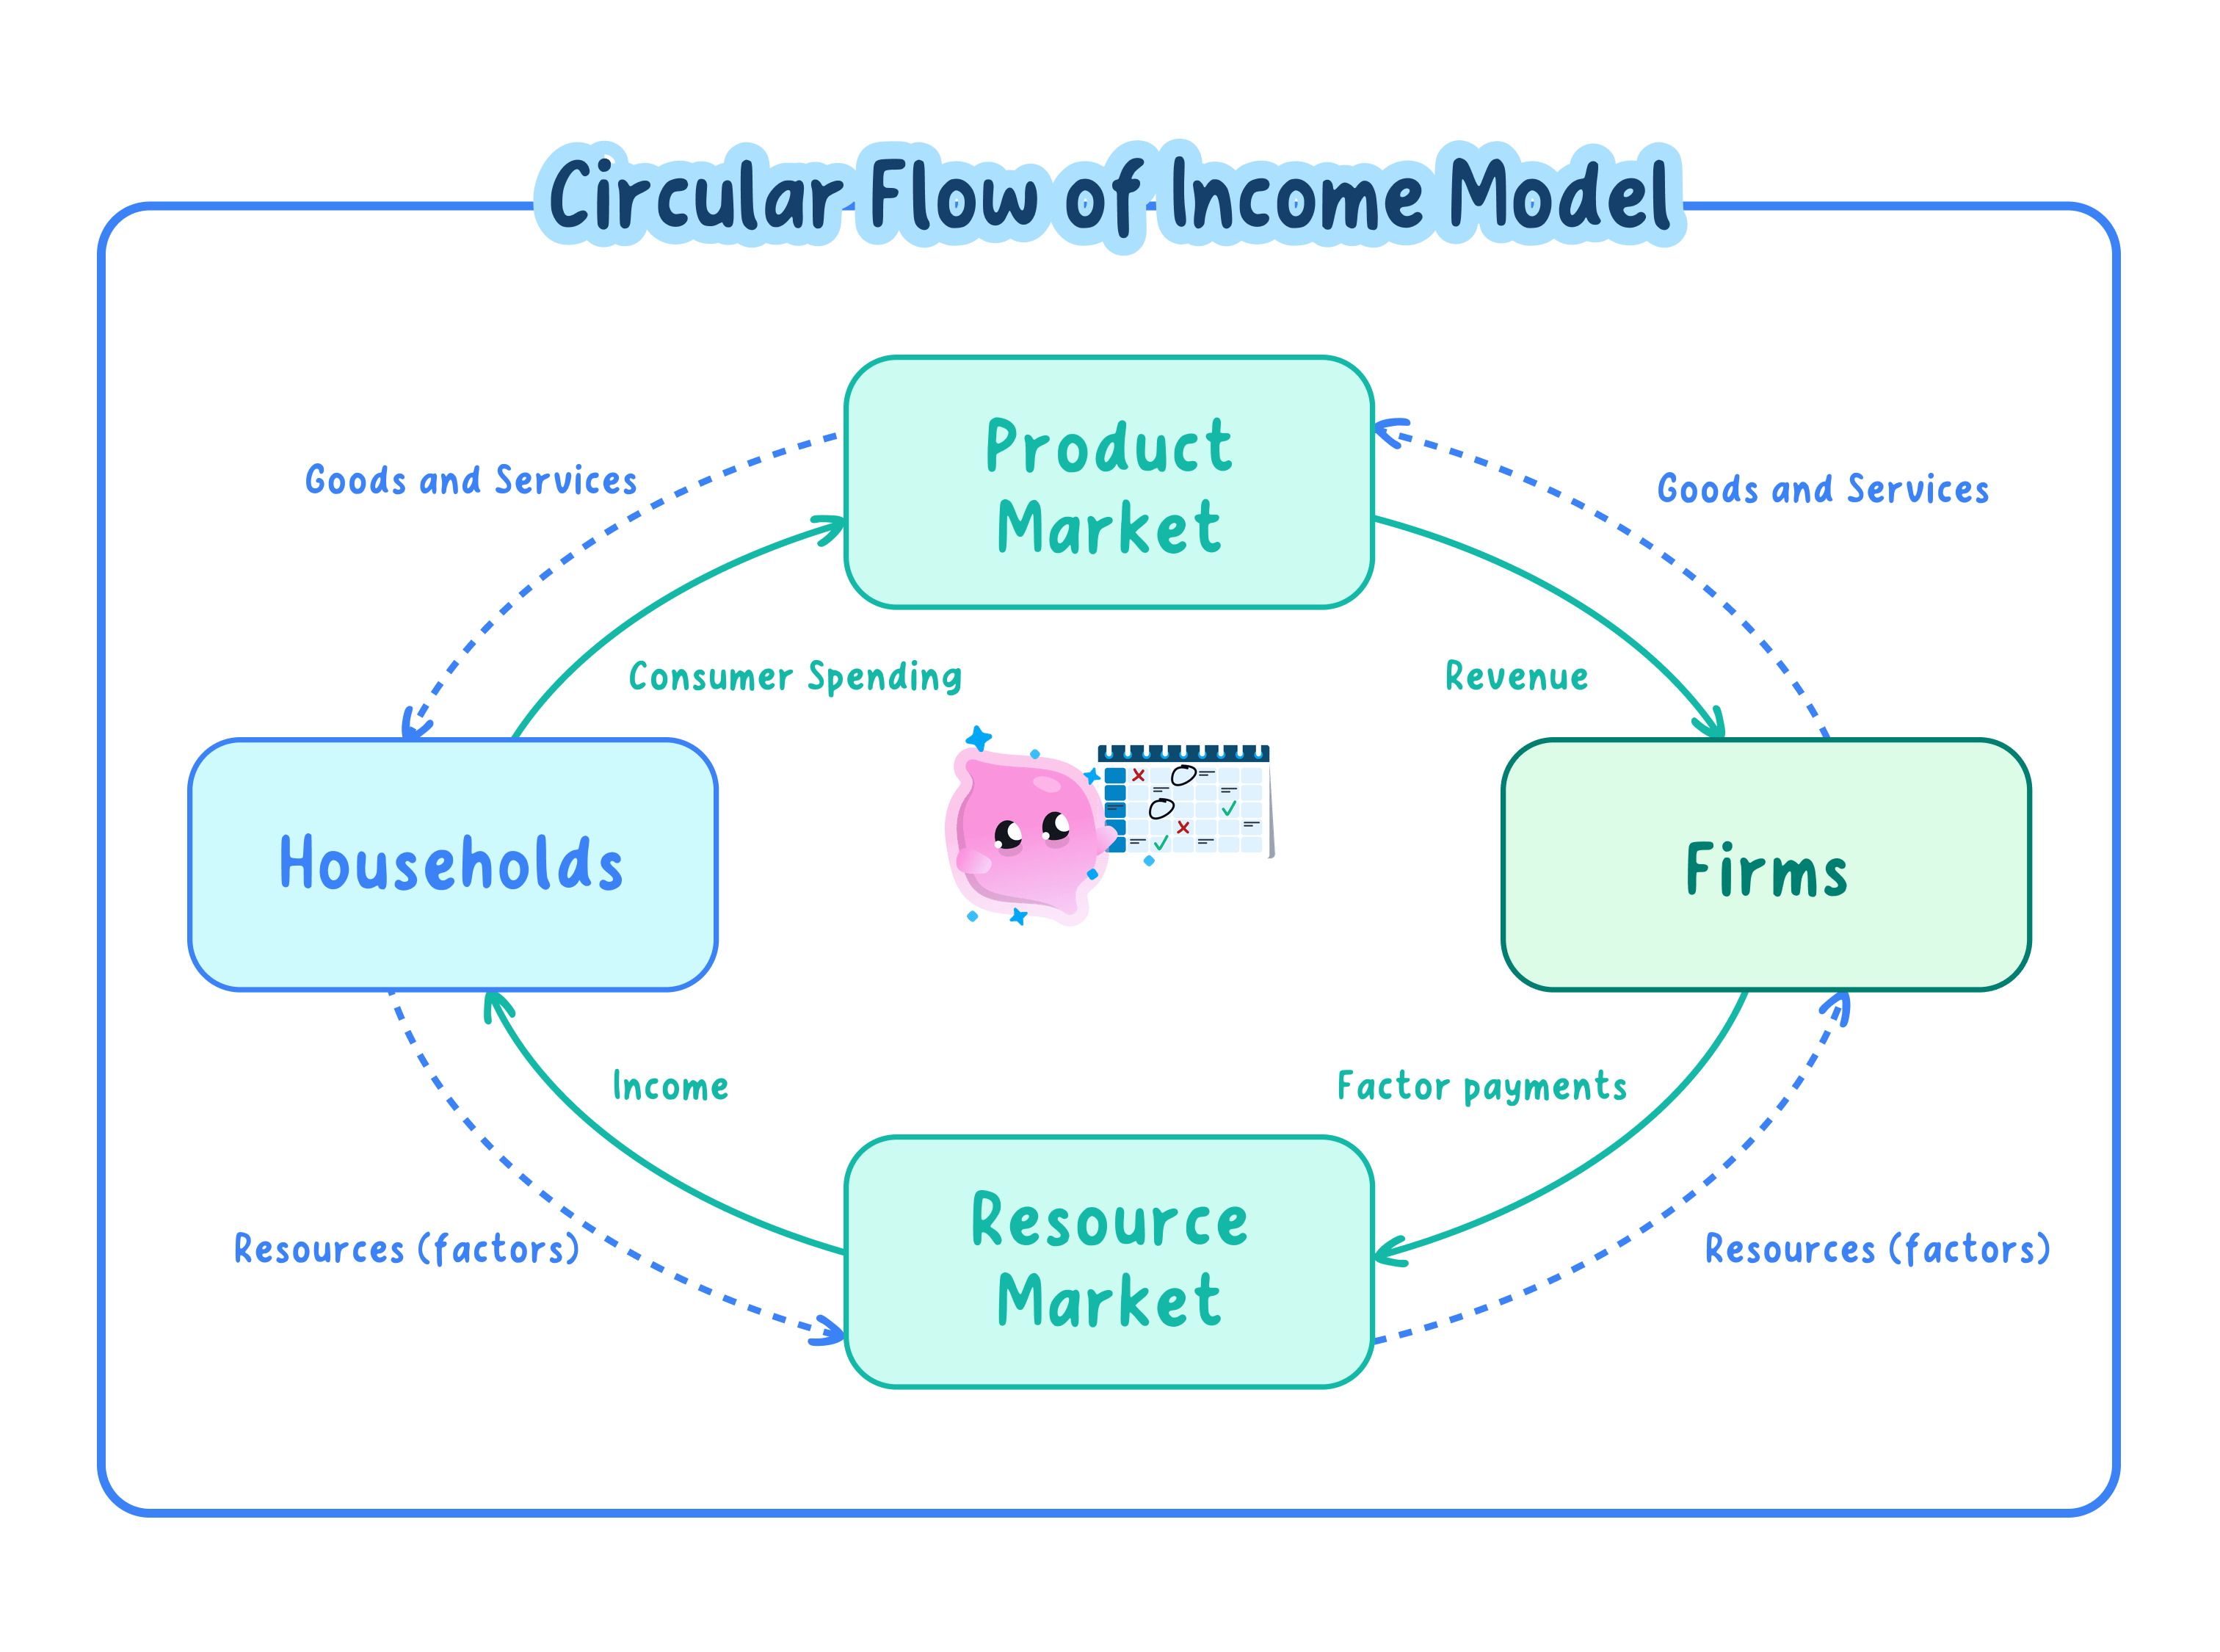
Circular flow of income: a model of the economy showing how income, output and expenditure move between households and firms, with government and the foreign sector added, so that income equals output equals expenditure.
- The circular flow of income shows income, output and expenditure moving between households and firms.
- The full model adds the government and the foreign sector.
- It rests on the identity that income=output=expenditure\text{income}=\text{output}=\text{expenditure}income=output=expenditure.
Note
- A real flow of factors and goods runs one way.
- A matching money flow of incomes and spending runs the other way.
Households and Firms Form the Simplest Circular Flow
- Households supply factors of production to firms.
- Firms pay factor incomes such as wages and profit.
- Households spend that income on the firms' goods and services.
Example
- A worker's wage from a firm returns to firms as consumer spending.
- Add government and the foreign sector to reach the full model.
Output, Income and Expenditure All Measure the Same Total
- Output is the value of what firms produce.
- Income is what households earn from producing it.
- Expenditure is the spending on that output, so all three are equal.
Show Both the Real Flow and the Money Flow
Exam technique
- Draw the real flow and the matching money flow in opposite directions.
- Start with two sectors, then add government and the foreign sector.
Common Mistake
- Do not treat the three measures of national income as different things.
- They are three ways of measuring the same flow.
Injections Add Income to the Flow While Withdrawals Drain It Away
- Injections add income to the circular flow.
- They are investment, government spending and exports.
- Withdrawals drain income away, and are saving, taxation and imports.
Note
- Injections add to the flow: investment, government spending and exports.
- Withdrawals remove from the flow: saving, taxation and imports.
Saving, Taxation and Imports Each Remove Income Differently
- Saving is income households set aside rather than spend.
- Taxation removes income to the government.
- Spending on imports sends income abroad rather than to domestic firms.
Example
- Buying a foreign-made car is a withdrawal from the domestic flow.
- A firm building a new factory is an injection of investment.
The Balance of Injections and Withdrawals Drives National Income
- Injections raise the flow of income.
- Withdrawals lower it.
- So the balance between them drives national income.
Classify Each Item Before You Use It
Exam technique
- Sort each item into an injection or a withdrawal before using it.
- Remember investment, government spending and exports add in.
Common Mistake
- Do not misclassify an item, such as treating imports as an injection.
- Imports are a withdrawal because the income goes abroad.
Income Settles Where Injections Equal Withdrawals, Not Always at Full Employment
- Equilibrium in the circular flow is where planned injections equal planned withdrawals.
- This gives a stable equilibrium level of national income.
- That level need not be the full employment level, where all resources are fully employed.
Note
- Income is stable when planned injections equal planned withdrawals.
- This equilibrium can sit below full employment.
A Change in Injections Shifts Income to a New Equilibrium
- A rise in injections lifts income above the old level.
- As income rises, withdrawals rise with it.
- Income settles where injections and withdrawals are equal again.
Example
- A rise in business investment moves the economy to a higher equilibrium.
- A fall in saving raises spending and lifts income too.
The Final Change in Income Exceeds the Initial Injection
- The final change in income is larger than the initial injection.
- This is because spending recirculates through the flow.
- So a change in injections previews the multiplier.
Example
- Worked example: suppose firms inject an extra £10 billion of investment, and half of each extra pound of income is withdrawn as saving, tax or imports.
- Income keeps rising until the extra withdrawals equal the £10 billion injection, which happens once income has risen by £20 billion.
- The final rise of £20 billion is double the £10 billion injection (£10bn×2=£20bn\pounds 10\text{bn}\times 2=\pounds 20\text{bn}£10bn×2=£20bn): this is the multiplier, examined fully in 2.2.4.
Equate Injections and Withdrawals to Find Equilibrium
Exam technique
- Define equilibrium as planned injections equal to planned withdrawals.
- Trace how a change in one of them moves income to a new level.
Common Mistake
- Do not assume the equilibrium level of income is the full employment level.
- Equilibrium can settle below full employment.
Self review
- When is the circular flow in equilibrium?
- Why need equilibrium not be full employment?
- What happens to income when injections rise?
- How does this preview the multiplier?
