

Reaction kinetics is the study of how fast chemical reactions occur and the molecular pathways by which they take place. Understanding how to measure and control these rates is vital for everything from biochemical systems to industrial chemical synthesis.
What you'll learn
- How reactant concentration and gas pressure affect the frequency of successful collisions.
- How to measure reaction rates experimentally and calculate them from graph gradients.
- The differences between homogeneous and heterogeneous catalysts and their industrial importance.
- How to use Boltzmann distributions to explain the effects of temperature and catalysts on reaction rates.
1. Simple Collision Theory
For a chemical reaction to occur, the reacting particles must collide. However, simply bumping into each other is not enough. Only a small fraction of collisions lead to a reaction. These are called successful (or effective) collisions.
Collision Theory
For a collision to be successful and lead to a reaction, the colliding particles must:
- Collide with the correct orientation so that the reacting atoms align properly.
- Possess a minimum amount of kinetic energy, known as the activation energy (EaE_aEa).
Activation Energy,
The minimum energy required for a collision to result in a chemical reaction by breaking the existing chemical bonds in the reactants.
Concentration and Pressure
- Concentration: When you increase the concentration of a solution, there are more reacting particles packed into the same unit volume. This reduces the average distance between particles, leading to more frequent collisions (more collisions per second). Consequently, the rate of successful collisions increases, and the overall reaction rate increases.
- Gas Pressure: Increasing the pressure of a gaseous system compresses the gas molecules into a smaller volume. This increases the concentration of gas molecules (more molecules per unit volume), leading to more frequent collisions and an increased rate of reaction.
'More collisions' vs 'More frequent collisions'
Do not simply write "there are more collisions" at a higher concentration. You must explicitly state that there are more frequent collisions or more collisions per unit time. Rate is a measure of change over time, so the time aspect is essential to secure the marks.
2. Measuring and Calculating Reaction Rates
To find the rate of a reaction experimentally, we must monitor how a physical quantity changes over time (PAG 9). The chosen method depends on the nature of the reactants and products:
- Gas volume: If a gas is produced (e.g., carbon dioxide from a carbonate and an acid), we can collect it in a gas syringe and record the volume at regular time intervals.
- Mass loss: If a heavy gas like CO2CO_2CO2 escapes from an open flask, we can place the reaction vessel on a digital balance and measure the decrease in mass over time.
- Colorimetry: If a reaction involves a colour change (such as the iodination of propanone), we can use a colorimeter to monitor how the absorbance of light changes with time.
Calculating Rates from Graphs (M3.1, M3.2, M3.5)
When you plot your experimental data (e.g., volume of gas against time), you will obtain a curve. The rate of the reaction at any given moment is equal to the gradient of the curve at that specific time.
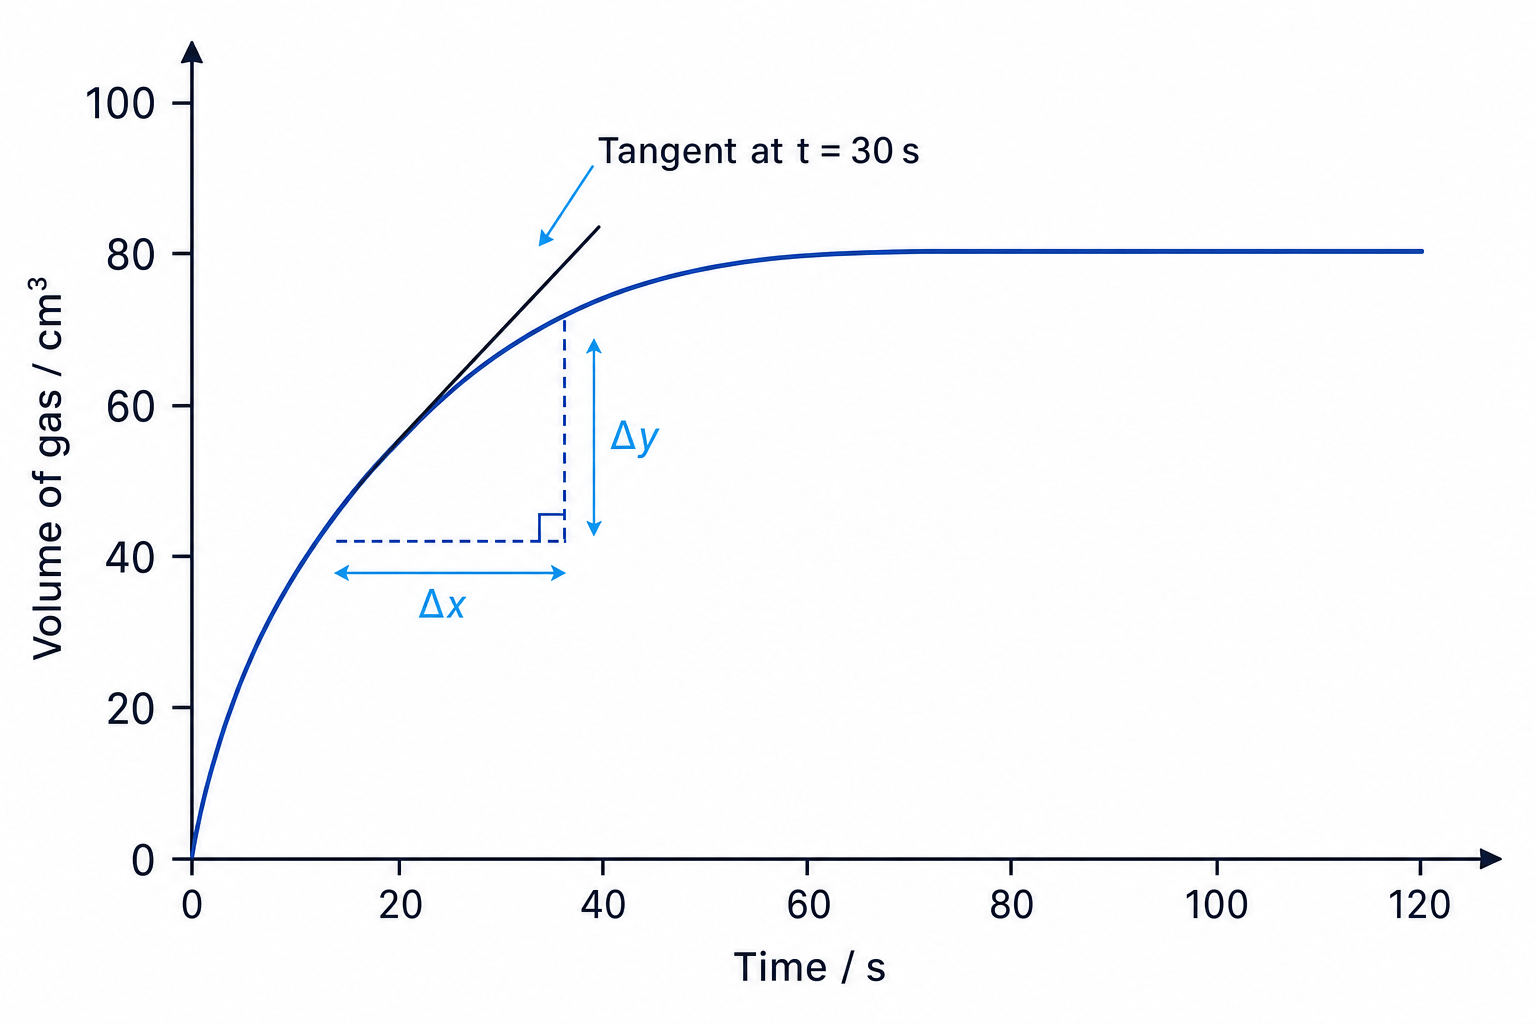
- Initial rate: The rate at the very start of the reaction (t=0t = 0t=0). This is when the reaction is fastest because the concentration of reactants is at its maximum.
- Rate at time ttt: To find the rate at any specific time, you must draw a straight tangent to the curve at that point and calculate its gradient.
Calculating reaction rate from a tangent
A student monitors the reaction between magnesium and excess hydrochloric acid by collecting the hydrogen gas produced:
Mg(s)+2HCl(aq)→MgCl2(aq)+H2(g) \text{Mg}(s) + 2\text{HCl}(aq) \rightarrow \text{MgCl}_2(aq) + \text{H}_2(g) Mg(s)+2HCl(aq)→MgCl2(aq)+H2(g)A graph of volume of gas (yyy-axis in cm3\text{cm}^3cm3) against time (xxx-axis in s\text{s}s) is plotted. Calculate the initial rate of reaction (t=0 st = 0\text{ s}t=0 s) given that a tangent drawn at the origin passes through the points (0,0)(0, 0)(0,0) and (45,72)(45, 72)(45,72).
-
Identify the coordinates on the tangent line: The coordinates are (x1,y1)=(0,0)(x_1, y_1) = (0, 0)(x1,y1)=(0,0) and (x2,y2)=(45,72)(x_2, y_2) = (45, 72)(x2,y2)=(45,72).
-
Calculate the change in yyy (Δy\Delta yΔy) and the change in xxx (Δx\Delta xΔx):
- Substitute the values into the gradient equation:
Drawing tangents accurately
When drawing a tangent in your exam, use a clear plastic ruler. Place the ruler on the curve at the specified point and adjust it so that the space between the ruler and the curve is balanced equally on both sides of the point. Draw a long line to minimise errors when reading coordinates off the axes.
3. Catalysts
Catalyst
A substance that increases the rate of a chemical reaction without being used up in the overall process. It does this by providing an alternative reaction pathway with a lower activation energy.
The impact of a catalyst on the energy barrier of a reaction can be illustrated using an enthalpy reaction profile:
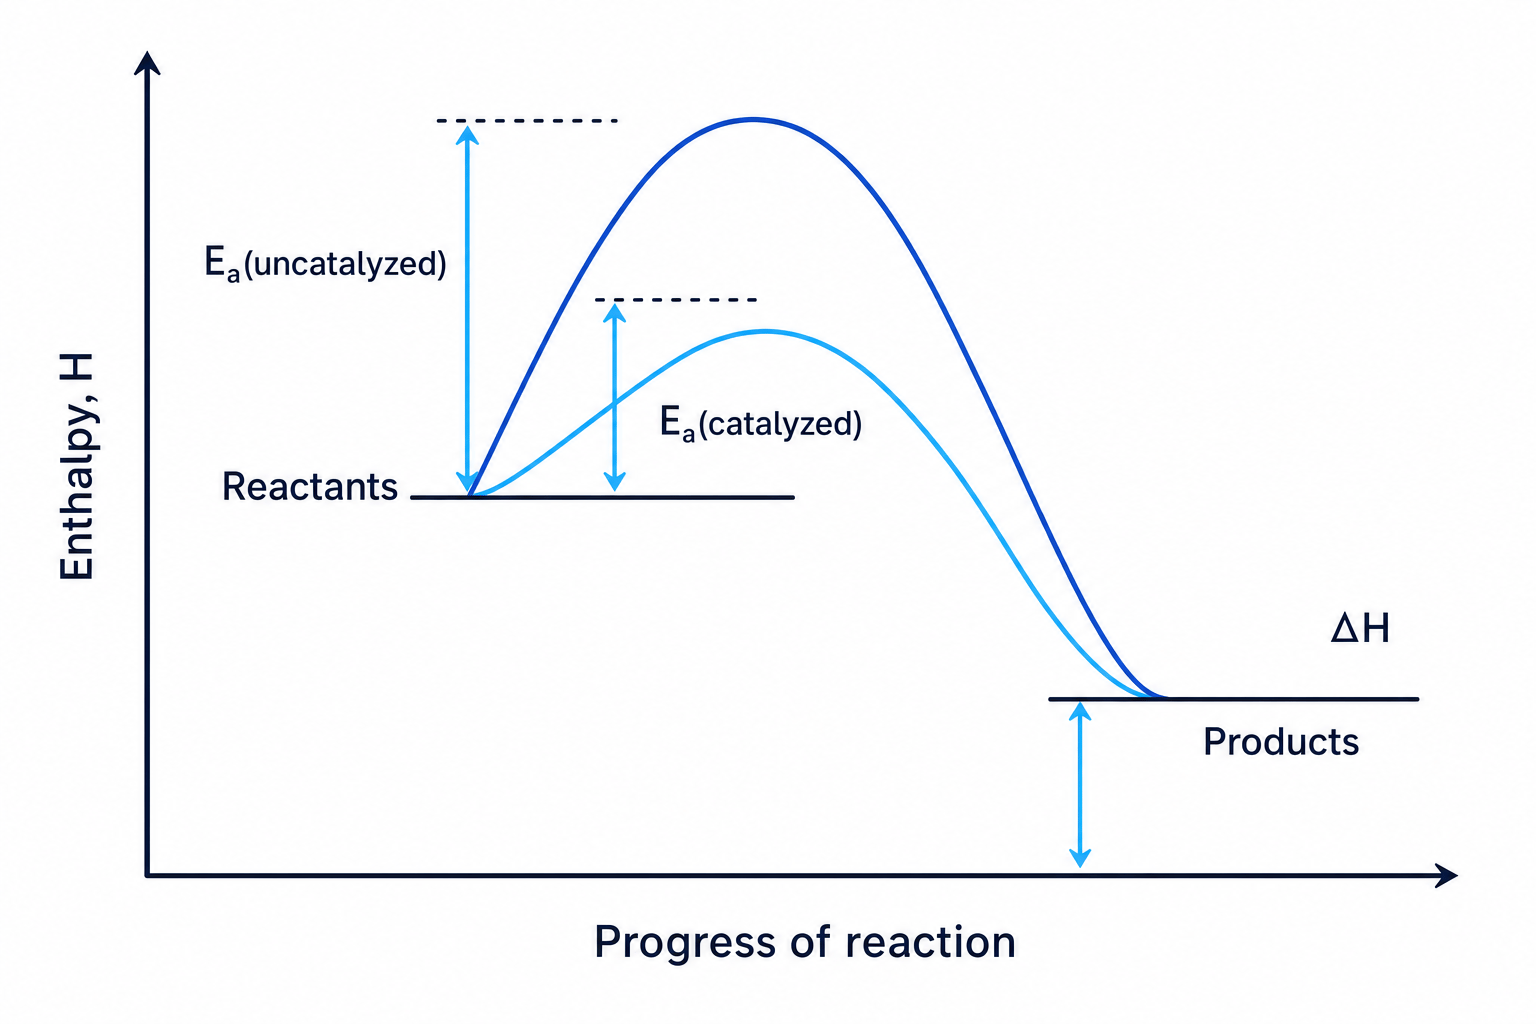
Note that the catalyst does not change the overall enthalpy change (ΔH\Delta HΔH) of the reaction; it only reduces the energy barrier (EaE_aEa) that the reactants must overcome to form products.
Types of Catalysts
-
Homogeneous Catalysts: The catalyst is in the same physical state (phase) as the reactants.
- Example: Aqueous acid catalysts (H+(aq)H^+(aq)H+(aq)) in the esterification of liquid carboxylic acids and alcohols.
- Mechanism: Usually react with one of the reactants to form an intermediate, which then decomposes or reacts further to regenerate the catalyst.
-
Heterogeneous Catalysts: The catalyst is in a different physical state (phase) from the reactants.
- Example: Solid iron (Fe(s)Fe(s)Fe(s)) in the Haber process to synthesise ammonia from gaseous nitrogen and hydrogen.
- Mechanism: Reactant molecules are adsorbed (bonded weakly) onto active sites on the solid catalyst surface. Bonds within the reactant molecules are weakened, allowing them to react. The product molecules then desorb (break away) from the surface.
Economic & environmental benefits of catalysts
In industrial chemical processes, catalysts are crucial for sustainability:
- Lowering energy demand: By lowering EaE_aEa, reactions can run at much lower temperatures and pressures. This dramatically reduces the amount of fossil fuels burned to heat industrial reactors.
- Reducing greenhouse gases: Less combustion of fossil fuels directly results in lower CO2\text{CO}_2CO2 emissions.
- Improving atom economy: Catalysts often enable alternative, highly selective pathways that produce fewer unwanted side products.
However, many catalysts (such as heavy transition metals like platinum, rhodium, or cobalt) are toxic. Industrial chemists must carefully weigh their economic and environmental benefits against the environmental impacts of mining, processing, and disposing of these metals safely.
4. The Boltzmann Distribution
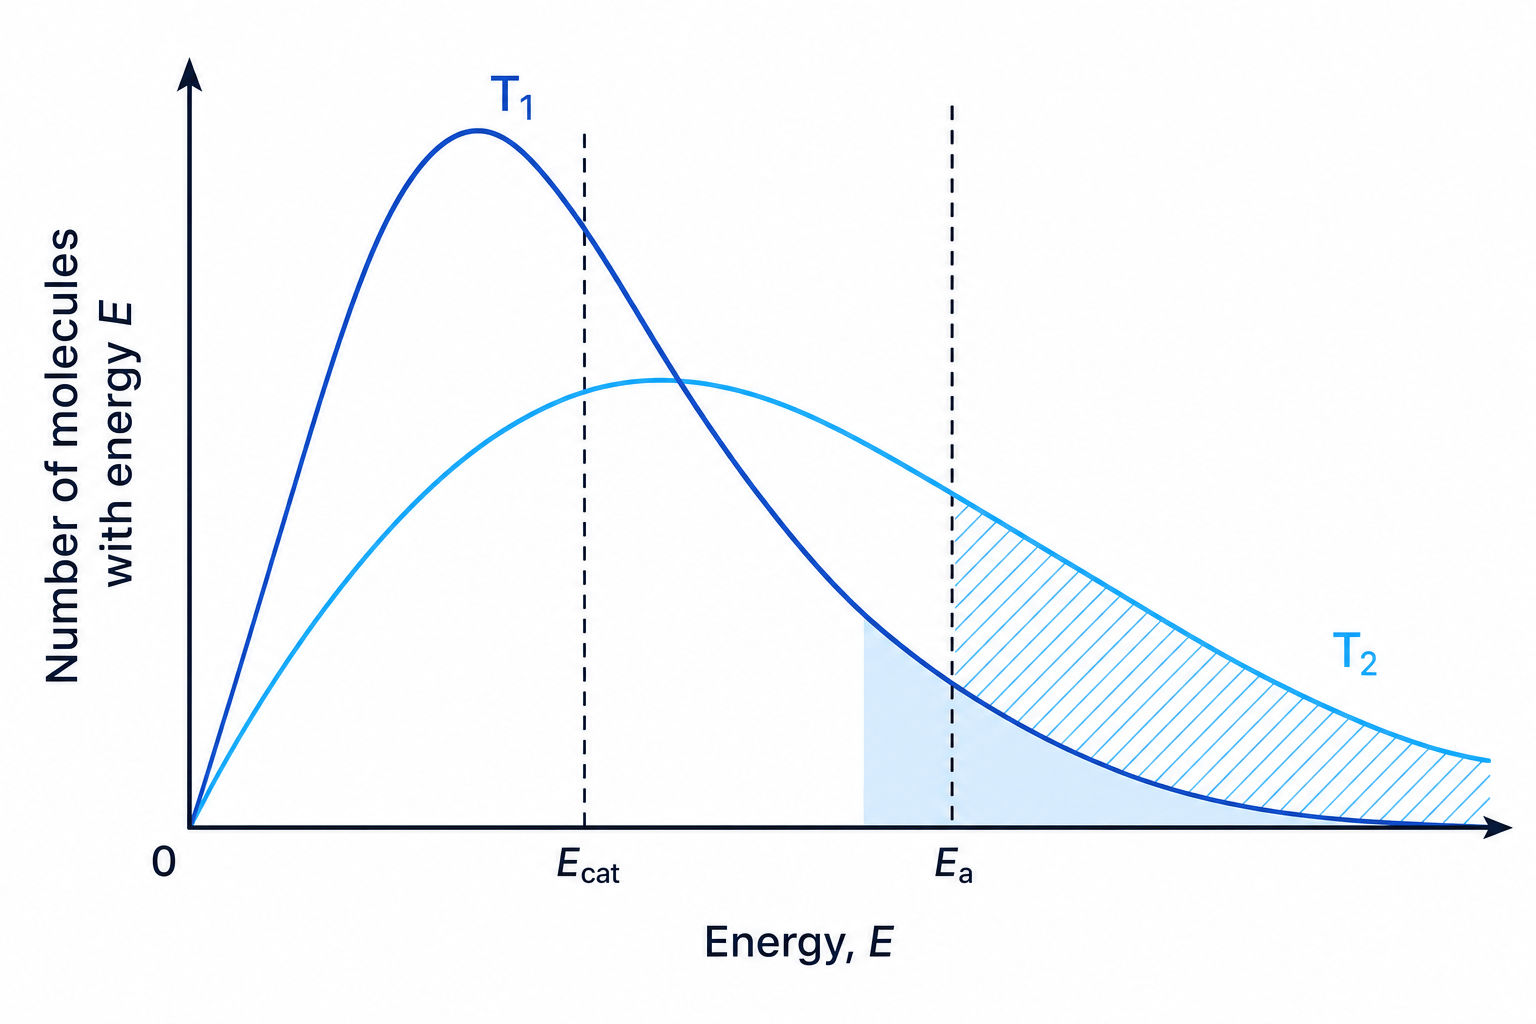
In any gas or liquid, the particles are in constant motion and colliding continuously. As they collide, they transfer kinetic energy. Consequently, different molecules have different amounts of energy. The Boltzmann distribution is a probability distribution that shows the spread of kinetic energies of molecules in a gas or liquid at a given temperature.
Key Features of the Curve
- Starts at the origin (0,0)(0,0)(0,0): No molecules have zero kinetic energy.
- The peak: This represents the most probable energy of a molecule in the sample.
- Asymptotic to the xxx-axis: The curve approaches but never actually touches the horizontal axis because there is no theoretical upper limit to the energy a single molecule can possess.
- Area under the curve: This represents the total number of molecules in the sample. This area remains constant unless you add or remove particles.
Effect of Temperature
When a system is heated from a lower temperature T1T_1T1 to a higher temperature T2T_2T2 (T2>T1T_2 > T_1T2>T1):
- The average kinetic energy of the molecules increases, causing the entire distribution to shift to the right.
- Because the total number of molecules is constant, the peak must become lower and flatter to maintain the same area under the curve.
- The vertical activation energy line (EaE_aEa) remains in the same position.
- The key consequence is that a much larger proportion of molecules now have kinetic energy equal to or greater than the activation energy (E≥EaE \ge E_aE≥Ea). This is represented by the shaded area under the T2T_2T2 curve to the right of EaE_aEa.
Because a far greater fraction of collisions are successful, the rate of reaction increases dramatically.
The main driver of temperature effects
While higher temperatures do increase the frequency of collisions (because particles move faster), this effect is tiny compared to the massive increase in the proportion of molecules that have E≥EaE \ge E_aE≥Ea. In exam explanations, always focus on the proportion of molecules exceeding the activation energy.
Effect of a Catalyst
When a catalyst is added to a system, the temperature does not change, so the Boltzmann distribution curve remains identical.
Instead, the catalyst lowers the activation energy from EaE_aEa to EcatE_{cat}Ecat (shifting the EaE_aEa line to the left):
- The threshold for a successful collision is now lower.
- Therefore, a larger proportion of molecules have sufficient energy to react (E≥EcatE \ge E_{cat}E≥Ecat), as shown by the increased area under the curve to the right of EcatE_{cat}Ecat.
- This leads to a higher rate of successful collisions, increasing the reaction rate.
In the exam
- Be precise with Boltzmann axes: Always label the yyy-axis as "Number of molecules with energy EEE" (or "Fraction of molecules...") and the xxx-axis as "Energy" (or "Kinetic energy"). Never label the yyy-axis as "Rate" or "Time".
- Make T2 cross T1 only once: When drawing a higher temperature curve, ensure it starts at the origin, peaks lower and to the right of the original curve, crosses the original curve exactly once, and remains higher than the original curve at high energies.
- Use the magic words "per unit time": Whenever you talk about collision frequency or reaction rate, use phrases like "number of successful collisions per unit time" or "rate of successful collisions". Do not just say "there are more successful collisions".
Check yourself
- Can you draw a Boltzmann distribution curve showing a reaction at room temperature, and show how the shaded area changes when a catalyst is introduced?
- Why does the Boltzmann distribution curve never touch the xxx-axis at high energies?
- Explain why a heterogeneous catalyst is often used as a fine mesh or powder rather than a single solid block.
