A student investigates the rate of the acid-catalysed hydrolysis of ethyl ethanoate.
The student mixes 10.0 cm310.0\text{ cm}^310.0 cm3 of 0.020 mol dm−30.020\text{ mol dm}^{-3}0.020 mol dm−3 ethyl ethanoate with 10.0 cm310.0\text{ cm}^310.0 cm3 of 2.0 mol dm−32.0\text{ mol dm}^{-3}2.0 mol dm−3 hydrochloric acid (acting as the catalyst in large excess). Because the acid is in template excess, the reaction is effectively zero-order with respect to hydrogen ions.
The concentration of ethyl ethanoate is monitored over time, and the student plots a graph of concentration of ethyl ethanoate against time as shown below:
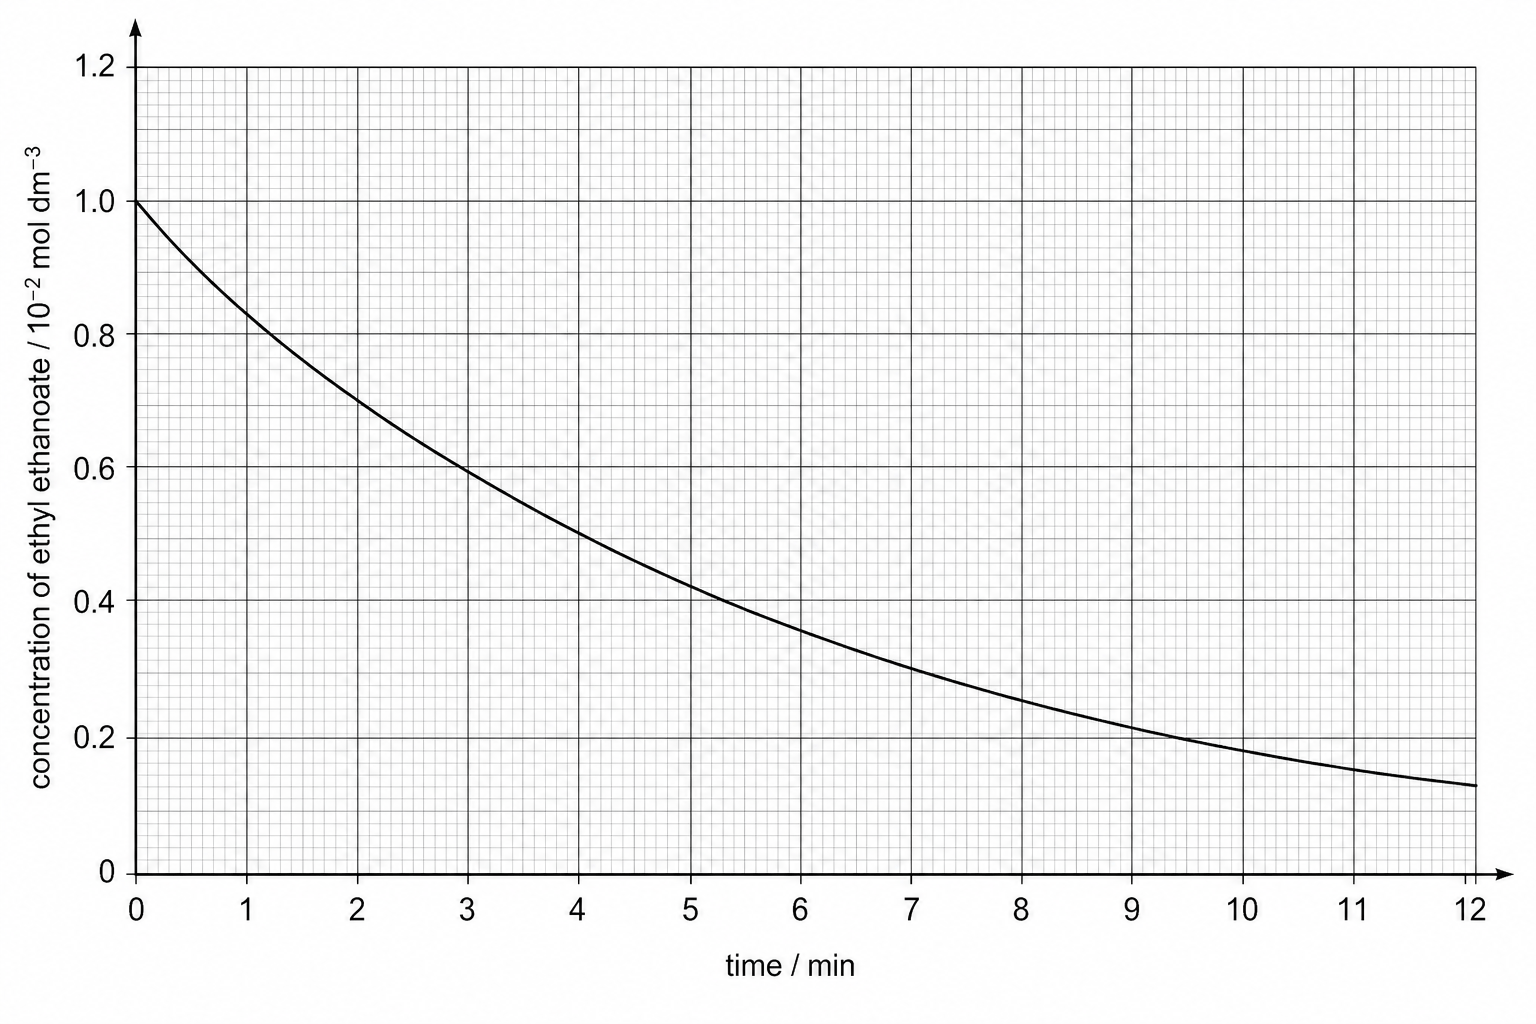
Using collision theory, explain why the gradient of the curve decreases over time.
Use the graph to determine:

