

What you'll learn
- How to obtain reaction rates from concentration–time graphs.
- How initial-rate experiments and rate–concentration graphs reveal reaction order.
- How to build a rate equation and calculate the rate constant, including its units.
- How orders of reaction can give evidence about the rate-determining step in a mechanism.
The big idea: rate equations come from experiments
This is one of the A-Level only kinetics ideas: the balanced chemical equation tells you the overall reacting ratio, but it does not usually tell you how the rate depends on concentration.
Rate of reaction
The rate of reaction is the change in concentration of a reactant or product per unit time, usually in mol dm⁻³ s⁻¹. For a reactant being used up, the concentration gradient is negative, so the rate is normally quoted as a positive value.
For a reaction involving reactants A and B, a typical rate equation is:
rate=k[A]m[B]n\text{rate}=k[A]^m[B]^nrate=k[A]m[B]nSquare brackets mean concentration in mol dm⁻³.
Order and rate constant
The order with respect to A is the power mmm in the rate equation. The order with respect to B is nnn. The overall order is m+nm+nm+n. The rate constant, kkk, is the constant of proportionality at a fixed temperature.
Do not use the balanced equation for orders
Orders of reaction are experimentally determined. They are not copied from the stoichiometric coefficients in the overall equation unless the data proves they match.
Predicting a rate change
For the rate equation rate=k[A][B]2\text{rate}=k[A][B]^2rate=k[A][B]2, work out what happens to the rate if [A][A][A] is doubled and [B][B][B] is halved.
- Convert the concentration changes into factors: [A][A][A] changes by a factor of 2, while [B][B][B] changes by a factor of 12\frac{1}{2}21.
- Apply the powers in the rate equation: the rate factor is 2×(12)22 \times \left(\frac{1}{2}\right)^22×(21)2.
- Simplify the factor: 2×14=122 \times \frac{1}{4}=\frac{1}{2}2×41=21, so the rate halves.
Getting rates from concentration–time graphs
A concentration–time graph shows how the concentration of one substance changes as the reaction proceeds. The rate at any instant is found from the gradient of a tangent to the curve at that time.
The tangent at time zero gives the initial rate. Initial rates are especially useful because the concentrations are still very close to the starting concentrations.
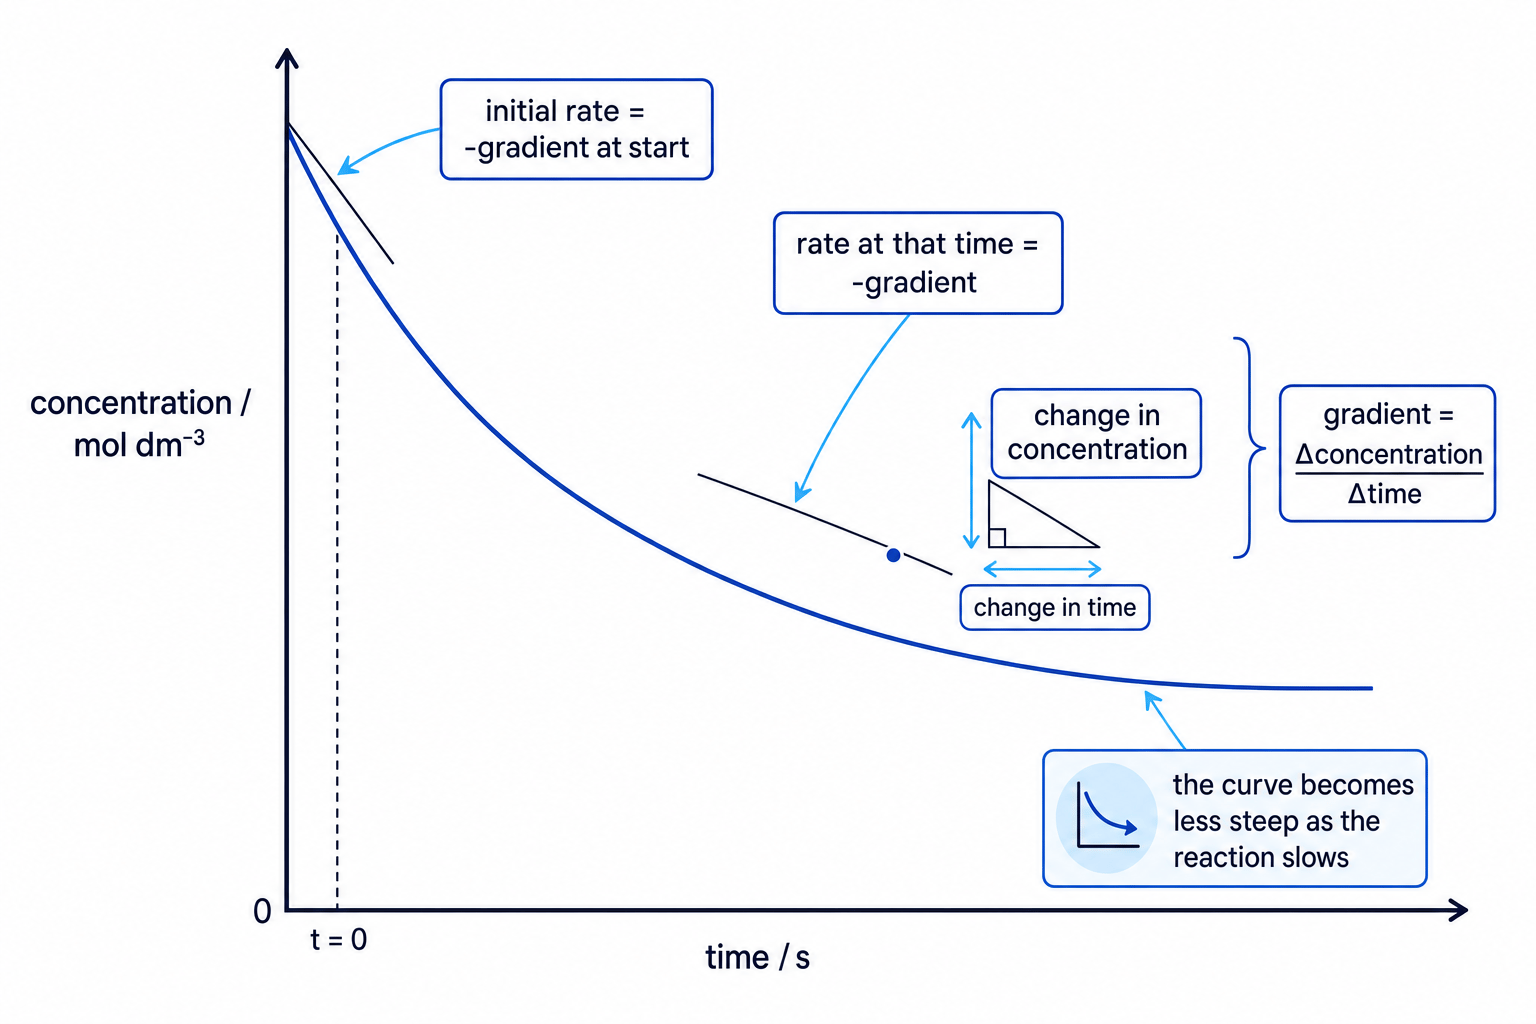
For a reactant:
rate=−gradient of concentration-time graph\text{rate}=-\text{gradient of concentration-time graph}rate=−gradient of concentration-time graphThe minus sign is used because the reactant concentration decreases, giving a negative gradient.
Calculating rate from a tangent
A tangent to a reactant concentration–time curve passes through two convenient points: 0 s, 0.092 mol dm⁻³ and 40 s, 0.052 mol dm⁻³. Calculate the rate at that time.
- Calculate the gradient of the tangent: gradient=0.052−0.09240−0=−1.00×10⁻³ mol dm−3 s−1\text{gradient}=\frac{0.052-0.092}{40-0}=-1.00 \times 10^{-3}\ \text{mol dm}^{-3}\ \text{s}^{-1}gradient=40−00.052−0.092=−1.00×10⁻³ mol dm−3 s−1.
- Since the graph is for a reactant being used up, take the negative of the gradient: rate=−(−1.00×10⁻³)\text{rate}=-(-1.00 \times 10^{-3})rate=−(−1.00×10⁻³).
- The rate is 1.00×10⁻³ mol dm−3 s−11.00 \times 10^{-3}\ \text{mol dm}^{-3}\ \text{s}^{-1}1.00×10⁻³ mol dm−3 s−1.
Using a chord instead of a tangent
A chord between two points on the curve gives an average rate over that time interval. An instantaneous rate needs a tangent drawn at the exact time.
Required practical 7: measuring rates
Required practical 7
You need to be able to describe measuring rate by both an initial rate method and a continuous monitoring method, while controlling variables such as temperature and total volume.
Initial rate method
In an initial rate method, you run several experiments with different starting concentrations and measure a rate close to the start of each reaction.
A common approach is a clock reaction, such as an iodine clock. If each experiment is timed until the same visible endpoint, the same amount of product has formed each time. Therefore:
initial rate∝1t\text{initial rate} \propto \frac{1}{t}initial rate∝t1where ttt is the time to reach the fixed endpoint.
Using clock reaction times
In two clock experiments, only the initial concentration of A is changed. In experiment 1, [A]=0.100 mol dm−3[A]=0.100\ \text{mol dm}^{-3}[A]=0.100 mol dm−3 and the time is 80.0 s. In experiment 2, [A]=0.200 mol dm−3[A]=0.200\ \text{mol dm}^{-3}[A]=0.200 mol dm−3 and the time is 40.0 s. Deduce the order with respect to A.
- Compare the initial rates using reciprocal time: rate2rate1=1/40.01/80.0=2\frac{\text{rate}_2}{\text{rate}_1}=\frac{1/40.0}{1/80.0}=2rate1rate2=1/80.01/40.0=2.
- Compare the concentrations: [A][A][A] doubles from 0.100 mol dm⁻³ to 0.200 mol dm⁻³.
- Doubling [A][A][A] doubles the rate, so the reaction is first order with respect to A.
Continuous monitoring method
In a continuous monitoring method, one experiment is followed throughout. You might measure gas volume with a gas syringe, mass loss on a balance, absorbance with a colorimeter, pH, or conductivity.
This gives a concentration–time or amount–time graph. You can then draw tangents to find rates at different times.
Practical control
Keep temperature constant, use the same total volume where appropriate, and repeat measurements. Rate is very temperature-sensitive, so small temperature changes can spoil the pattern.
Deducing order from rate–concentration data
To find the order with respect to one reactant, compare experiments where only that reactant’s concentration changes.
The three common A-Level cases are zero order, first order and second order.
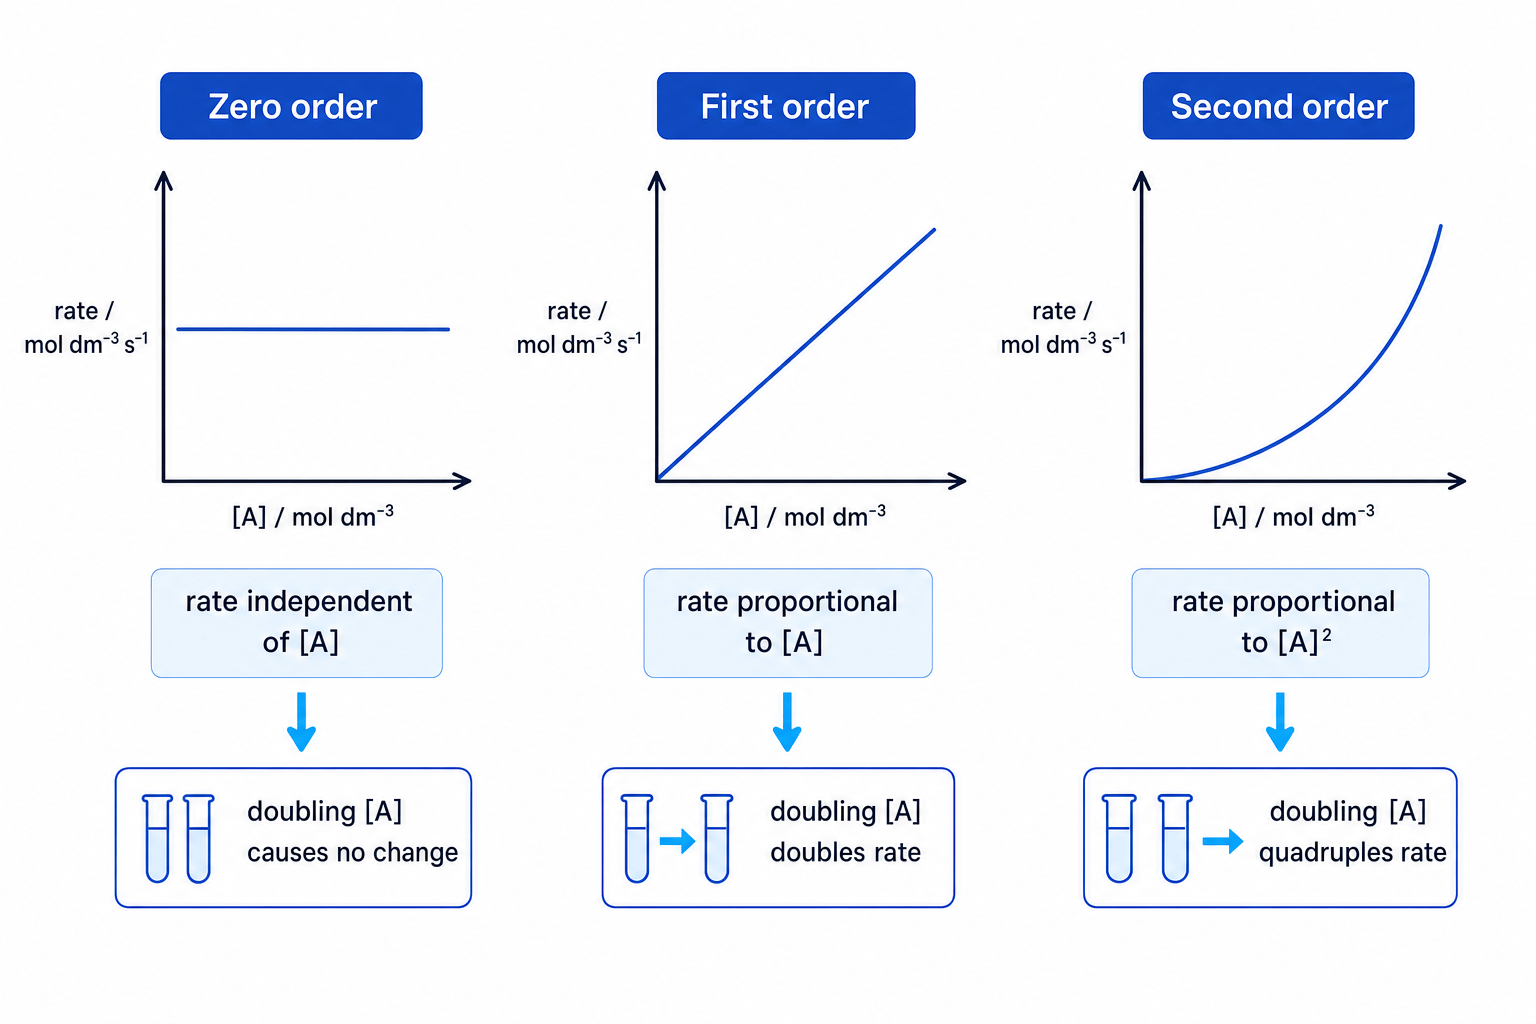
- Zero order: changing the concentration has no effect on rate.
- First order: doubling the concentration doubles the rate.
- Second order: doubling the concentration quadruples the rate.
You can also recognise them from rate–concentration graphs:
- Zero order gives a horizontal line.
- First order gives a straight line through the origin.
- Second order gives an upward curve; plotting rate against concentration squared would give a straight line.
Deducing orders and calculating k
Initial-rate data are collected for a reaction involving A and B:
Experiment 1: [A]=0.100 mol dm−3[A]=0.100\ \text{mol dm}^{-3}[A]=0.100 mol dm−3, [B]=0.100 mol dm−3[B]=0.100\ \text{mol dm}^{-3}[B]=0.100 mol dm−3, rate =2.50×10⁻⁵ mol dm−3 s−1=2.50 \times 10^{-5}\ \text{mol dm}^{-3}\ \text{s}^{-1}=2.50×10⁻⁵ mol dm−3 s−1.
Experiment 2: [A]=0.200 mol dm−3[A]=0.200\ \text{mol dm}^{-3}[A]=0.200 mol dm−3, [B]=0.100 mol dm−3[B]=0.100\ \text{mol dm}^{-3}[B]=0.100 mol dm−3, rate =1.00×10⁻⁴ mol dm−3 s−1=1.00 \times 10^{-4}\ \text{mol dm}^{-3}\ \text{s}^{-1}=1.00×10⁻⁴ mol dm−3 s−1.
Experiment 3: [A]=0.200 mol dm−3[A]=0.200\ \text{mol dm}^{-3}[A]=0.200 mol dm−3, [B]=0.300 mol dm−3[B]=0.300\ \text{mol dm}^{-3}[B]=0.300 mol dm−3, rate =3.00×10⁻⁴ mol dm−3 s−1=3.00 \times 10^{-4}\ \text{mol dm}^{-3}\ \text{s}^{-1}=3.00×10⁻⁴ mol dm−3 s−1.
- Compare experiments 1 and 2: [A][A][A] doubles while [B][B][B] stays constant, and the rate increases by a factor of 4. Therefore the order with respect to A is 2.
- Compare experiments 2 and 3: [B][B][B] triples while [A][A][A] stays constant, and the rate also triples. Therefore the order with respect to B is 1.
- Write the rate equation using these orders: rate=k[A]2[B]\text{rate}=k[A]^2[B]rate=k[A]2[B].
- Substitute experiment 2 into the rate equation: 1.00×10−4=k(0.200)2(0.100)1.00 \times 10^{-4}=k(0.200)^2(0.100)1.00×10−4=k(0.200)2(0.100), so k=2.50×10⁻²k=2.50 \times 10^{-2}k=2.50×10⁻².
- Work out the units from rate unitsconcentration units3\frac{\text{rate units}}{\text{concentration units}^{3}}concentration units3rate units, giving k=2.50×10⁻² dm6 mol−2 s−1k=2.50 \times 10^{-2}\ \text{dm}^{6}\ \text{mol}^{-2}\ \text{s}^{-1}k=2.50×10⁻² dm6 mol−2 s−1.
Changing two concentrations at once
If two reactant concentrations change between experiments, you cannot directly identify the order for one reactant. Choose pairs where all other concentrations are constant.
Units of the rate constant
The units of kkk depend on the overall order.
units of k=units of rate(units of concentration)overall order\text{units of }k=\frac{\text{units of rate}}{(\text{units of concentration})^{\text{overall order}}}units of k=(units of concentration)overall orderunits of rateUseful results:
- Overall order zero: mol dm⁻³ s⁻¹
- Overall order one: s⁻¹
- Overall order two: dm³ mol⁻¹ s⁻¹
- Overall order three: dm⁶ mol⁻² s⁻¹
Special case: zero-order concentration–time graphs
For a zero-order reaction with respect to A:
rate=k[A]0=k\text{rate}=k[A]^0=krate=k[A]0=kSo the rate is constant while the reaction conditions remain suitable. A concentration–time graph for A is a straight line, and for a reactant:
k=−gradientk=-\text{gradient}k=−gradientFinding k from a zero-order graph
A reactant concentration falls linearly from 0.120 mol dm⁻³ to 0.060 mol dm⁻³ in 300 s. Find kkk.
- Calculate the gradient of the concentration–time graph: gradient=0.060−0.120300=−2.00×10⁻⁴ mol dm−3 s−1\text{gradient}=\frac{0.060-0.120}{300}=-2.00 \times 10^{-4}\ \text{mol dm}^{-3}\ \text{s}^{-1}gradient=3000.060−0.120=−2.00×10⁻⁴ mol dm−3 s−1.
- For a reactant, the rate is the negative of the gradient: rate=2.00×10⁻⁴ mol dm−3 s−1\text{rate}=2.00 \times 10^{-4}\ \text{mol dm}^{-3}\ \text{s}^{-1}rate=2.00×10⁻⁴ mol dm−3 s−1.
- Since the reaction is zero order, rate=k\text{rate}=krate=k, so k=2.00×10⁻⁴ mol dm−3 s−1k=2.00 \times 10^{-4}\ \text{mol dm}^{-3}\ \text{s}^{-1}k=2.00×10⁻⁴ mol dm−3 s−1.
Using orders to suggest a mechanism
A mechanism is a sequence of smaller steps that explains how a reaction happens. The rate-determining step is the slowest step; it limits the rate of the overall reaction.
Rate-determining step
The rate-determining step is the slowest step in a reaction mechanism. Species involved in or before this step can appear in the rate equation.
If a reactant is zero order, changing its concentration does not affect the rate, so it is unlikely to be involved in the rate-determining step under those conditions.
Identifying a possible rate-determining step
For the overall reaction of X, Y and Z, experiments give rate=k[X][Y]\text{rate}=k[X][Y]rate=k[X][Y]. Decide which proposed slow step is more consistent.
Mechanism A: X + Y → intermediate is slow, then intermediate + Z → products is fast.
Mechanism B: Y + Z → intermediate is slow, then intermediate + X → products is fast.
- Interpret the rate equation: X is first order, Y is first order, and Z is zero order.
- Mechanism A has X and Y in the slow step, which matches the species that affect the rate.
- Mechanism B has Z in the slow step, but Z does not appear in the rate equation, so mechanism B is less consistent.
Mechanisms are supported, not proved
A rate equation can rule out unsuitable mechanisms and support a possible one, but it does not prove that one mechanism is uniquely correct.
In the exam
- When using data, compare two experiments where only one reactant concentration changes.
- Convert concentration changes and rate changes into factors, then match them to zero, first or second order.
- Always write the full rate equation before calculating kkk.
- Give units for kkk, and remember they depend on the overall order.
- For mechanisms, compare the species in the rate equation with the proposed rate-determining step.
Check yourself
- If doubling [A][A][A] causes no change in rate, what is the order with respect to A?
- How would you find an initial rate from a concentration–time graph?
- Why can’t you usually deduce the rate equation from the balanced chemical equation?
