

What you'll learn
- How to choose apparatus for reliable quantitative measurements.
- How key practical techniques work: serial dilutions, colorimetry, microscopy, chromatography, aseptic technique and field sampling.
- How to record observations using scientific drawings and annotations.
- How safety, ethics and ICT fit into practical biology.
The big picture: practical skills
This part of OCR A Biology is about your transferable practical toolkit. Across at least 12 assessed practicals, you show that you can plan, carry out, record, analyse and evaluate biological investigations safely.
In written exams, you may be given an unfamiliar practical. The aim is not to memorise one “perfect method”, but to explain why particular apparatus and techniques are suitable.
Quantitative and qualitative data
Quantitative data are numerical measurements with units, such as temperature in °C or time in s. Qualitative data are descriptive observations, such as “the solution turned lilac”.
1. Recording quantitative measurements
A good measurement needs the right apparatus, a suitable unit, and sensible attention to uncertainty.
Resolution, accuracy and precision
Resolution is the smallest change an instrument can detect. Accuracy means closeness to the true value. Precision means repeat measurements are close to each other.
| Quantity measured | Suitable apparatus | Good practical habit |
|---|---|---|
| Mass | Balance | Zero or tare before use; record to the balance resolution. |
| Time | Stopwatch or data logger | Use seconds; repeat to reduce reaction-time error. |
| Volume | Measuring cylinder, pipette, burette, volumetric flask | Use pipettes/flasks for accurate fixed volumes; read the meniscus at eye level. |
| Temperature | Thermometer, temperature probe, water bath | Allow the probe to equilibrate before recording. |
| Length | Ruler, calipers, microscope graticule | Choose a scale suitable for the object size. |
| pH | pH meter or pH probe | Calibrate using buffer solutions; rinse the probe between samples. |
Match apparatus to the question
The “best” apparatus is not always the most complicated one: it is the apparatus that measures the dependent variable with enough precision for the investigation.
2. Instrumentation: colorimeters and potometers
An instrument is apparatus that detects or records a measurement, often using a sensor or optical system.
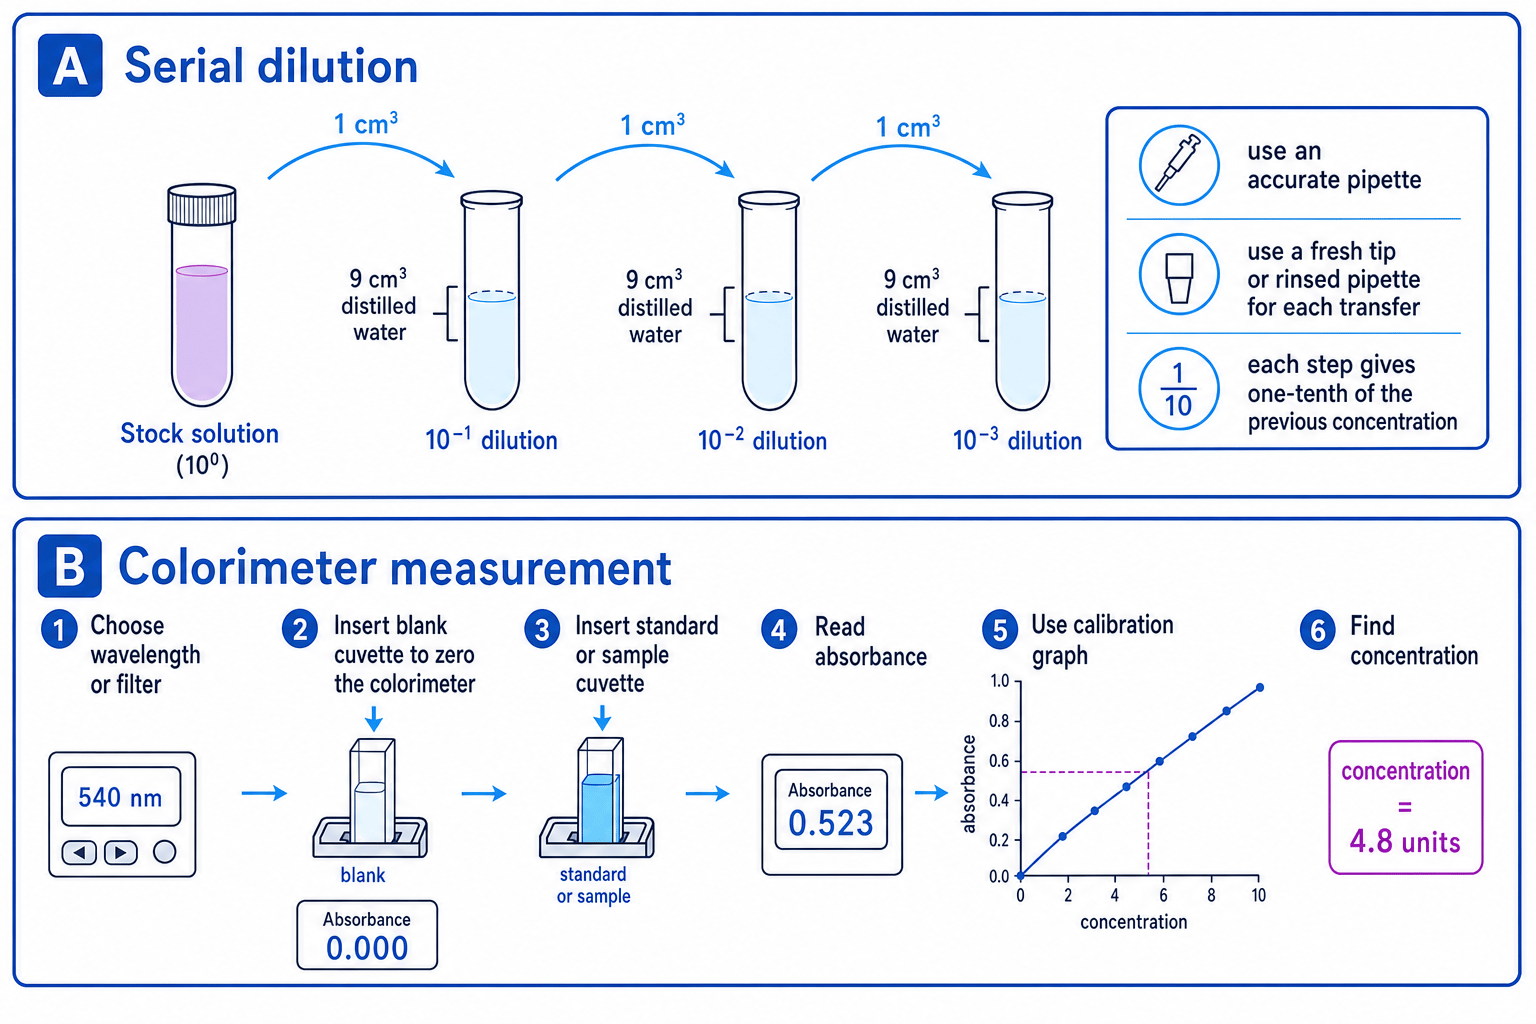
A colorimeter measures how much light passes through a coloured solution. It is often used to estimate concentration by comparing absorbance with a calibration curve made from known standards. You usually choose a suitable filter or wavelength, zero the colorimeter with a blank, then measure the samples.
A potometer estimates the rate of water uptake by a plant shoot. A bubble moves along a capillary tube as water is taken up. This can be used as an estimate of transpiration rate if the apparatus is airtight and conditions are controlled.
Potometers do not directly measure transpiration
A potometer measures water uptake, not water loss from the leaves directly. It is a useful estimate because most absorbed water is lost by transpiration, but some is used in photosynthesis or maintaining turgor.
3. Laboratory glassware and serial dilutions
Different glassware gives different levels of precision. Beakers are for rough volumes. Measuring cylinders are better, but volumetric pipettes, burettes and volumetric flasks are used when volume accuracy matters.
Serial dilution
A serial dilution is a step-by-step dilution where each tube is diluted from the previous tube, often by the same factor each time.
Serial dilutions are useful when you need a range of concentrations, for example to make standards for a colorimeter calibration curve.
Planning a serial dilution
You need to make a solution of 0.0100 mol dm−30.0100\ \text{mol dm}^{-3}0.0100 mol dm−3 from a stock solution of 1.00 mol dm−31.00\ \text{mol dm}^{-3}1.00 mol dm−3.
-
Work out the overall dilution needed: 0.0100 mol dm−31.00 mol dm−3=0.0100=10−2\frac{0.0100\ \text{mol dm}^{-3}}{1.00\ \text{mol dm}^{-3}} = 0.0100 = 10^{-2}1.00 mol dm−30.0100 mol dm−3=0.0100=10−2, so the stock must be diluted one hundredfold.
-
Make the first tenfold dilution by pipetting 1.00 cm31.00\ \text{cm}^31.00 cm3 of stock into 9.00 cm39.00\ \text{cm}^39.00 cm3 of distilled water, giving 0.100 mol dm−30.100\ \text{mol dm}^{-3}0.100 mol dm−3.
-
Make the second tenfold dilution by pipetting 1.00 cm31.00\ \text{cm}^31.00 cm3 of the 0.100 mol dm−30.100\ \text{mol dm}^{-3}0.100 mol dm−3 solution into 9.00 cm39.00\ \text{cm}^39.00 cm3 of distilled water, giving 0.0100 mol dm−30.0100\ \text{mol dm}^{-3}0.0100 mol dm−3.
4. Light microscopy and graticules
A light microscope uses visible light and lenses to magnify a specimen. Start on low power to find and centre the specimen, then move to high power for detail. At high power, use the fine focus only.
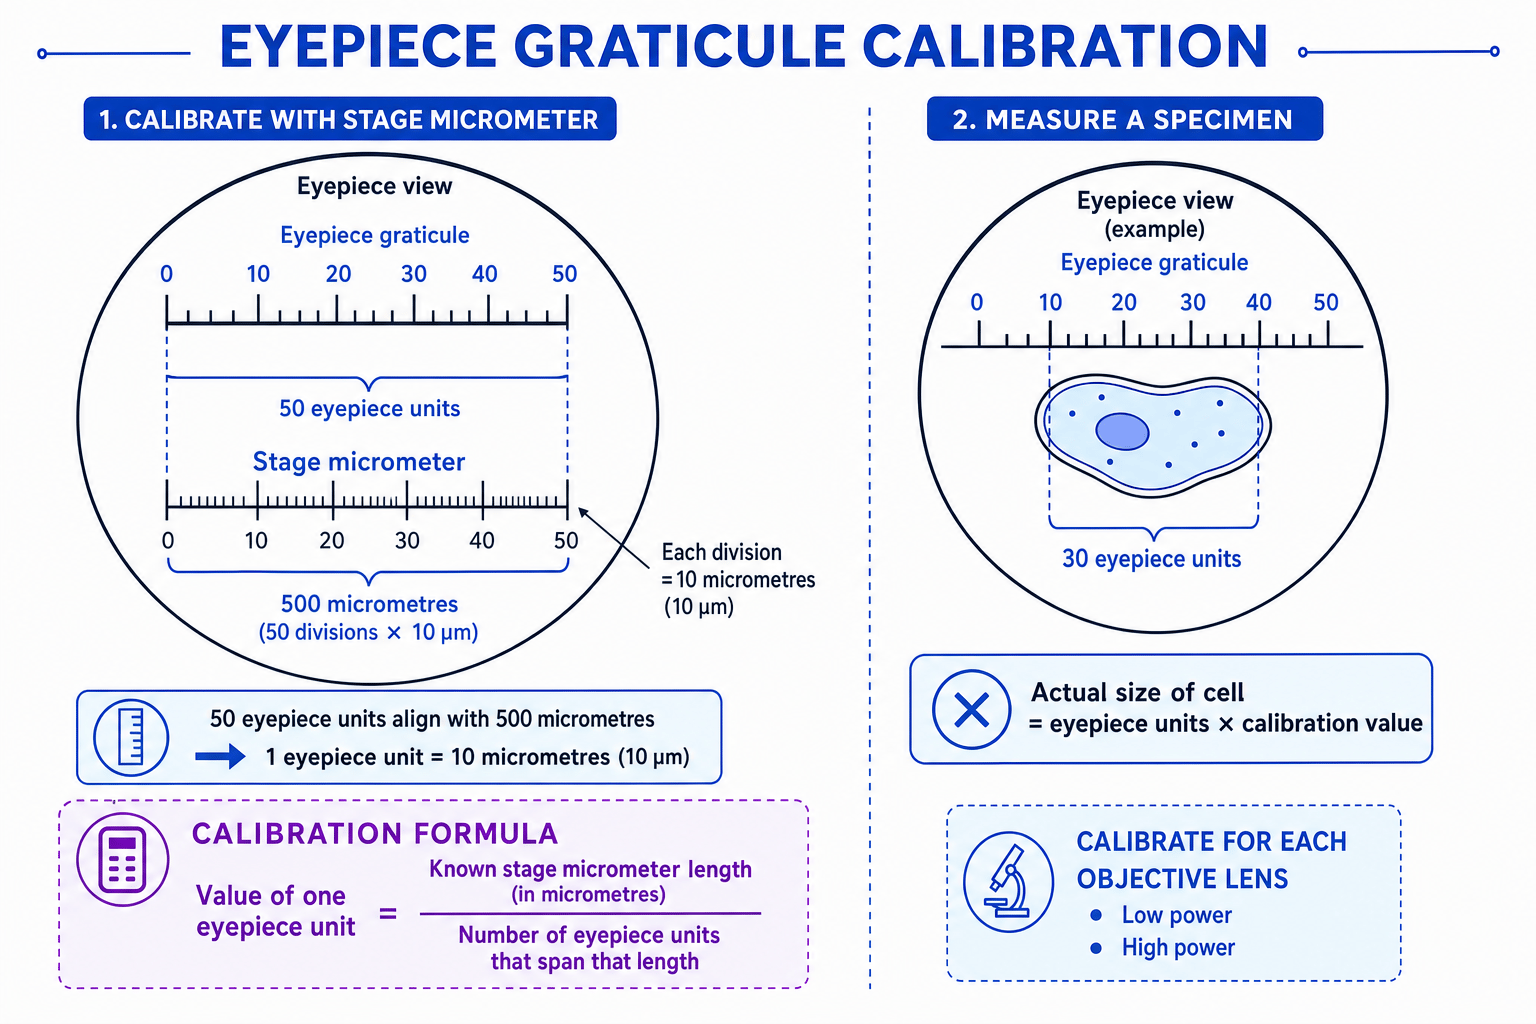
An eyepiece graticule is a scale in the eyepiece. Its divisions have no fixed size until you calibrate them using a stage micrometer, which has a real scale in micrometres.
Calibrating a graticule
At high power, 40 eyepiece graticule units line up with 100 μm100\ \mu\text{m}100 μm on a stage micrometer. A cell then spans 18 eyepiece units.
-
Calculate the value of one eyepiece unit: 100 μm40=2.5 μm per unit\frac{100\ \mu\text{m}}{40} = 2.5\ \mu\text{m per unit}40100 μm=2.5 μm per unit.
-
Convert the cell measurement into a real length: 18 units×2.5 μm per unit=45 μm18\ \text{units} \times 2.5\ \mu\text{m per unit} = 45\ \mu\text{m}18 units×2.5 μm per unit=45 μm.
-
Use this calibration only for that objective lens; if you change magnification, the graticule must be recalibrated.
5. Scientific drawings from observations
A scientific drawing is a clear record of what you actually observed, not an idealised textbook diagram.
Good biological drawings should be:
- large, clear and drawn with single continuous lines;
- unshaded, unless shading is specifically required;
- labelled using ruled label lines that do not cross;
- given a title and, where possible, a scale bar or magnification;
- annotated with useful observed features.
Annotation
An annotation is a brief explanatory note added to a drawing, such as “thickened lignified wall” or “nucleus visible at cell edge”. It gives more information than a label alone.
6. Qualitative reagents for biological molecules
Qualitative tests show whether a substance is present. They do not give an exact concentration unless combined with standards or instrumentation.
| Molecule tested | Reagent or method | Positive result |
|---|---|---|
| Starch | Iodine solution | Orange-brown to blue-black |
| Reducing sugar | Benedict’s reagent, heated in a water bath | Blue to green, yellow, orange or brick-red precipitate |
| Non-reducing sugar | Hydrolyse with dilute acid, neutralise, then Benedict’s test | Positive Benedict’s result after hydrolysis |
| Protein | Biuret reagent | Blue to lilac or purple |
| Lipid | Ethanol emulsion test, then add water | White or milky emulsion |
Use controls
A negative control, such as distilled water, helps you check that any colour change is due to the biological molecule rather than contamination or the reagent itself.
7. Separating biological compounds
Chromatography separates substances because they differ in solubility in the mobile phase and attraction to the stationary phase. In paper chromatography the stationary phase is paper; in thin layer chromatography it is a thin coated plate.
You draw a pencil baseline, add small spots of sample, place the paper or plate in solvent below the baseline, and allow the solvent front to move. The Rf value can help compare separated substances under the same conditions.
Calculating an Rf value
A pigment moves 42 mm from the baseline. The solvent front moves 70 mm.
-
Use the formula Rf=distance moved by spotdistance moved by solvent frontR_f = \frac{\text{distance moved by spot}}{\text{distance moved by solvent front}}Rf=distance moved by solvent frontdistance moved by spot.
-
Substitute the measurements: Rf=42 mm70 mm=0.60R_f = \frac{42\ \text{mm}}{70\ \text{mm}} = 0.60Rf=70 mm42 mm=0.60.
-
State that the Rf value has no units because the distance units cancel.
Electrophoresis separates charged biological molecules using an electric field, usually through a gel. DNA fragments move towards the positive electrode because their phosphate groups make them negatively charged; smaller fragments usually travel further through the gel.
8. Safe and ethical use of organisms
When working with living organisms, you must reduce harm and stress. This applies whether you are measuring plant or animal responses or physiological functions.
Response and physiological function
A response is a change in behaviour or growth caused by a stimulus, such as woodlice moving away from light. A physiological function is a body process, such as heart rate, ventilation rate or transpiration.
Good practice includes using suitable environmental conditions, avoiding harmful extremes, using the minimum stress needed, and returning organisms only when safe and permitted. For human participants, use informed consent, anonymity and the right to stop.
9. Aseptic technique and microbiology
Aseptic technique prevents contamination of cultures, people and the environment. It is used with agar plates, which contain solid nutrient medium, and broth, which is liquid nutrient medium.
Typical aseptic habits include disinfecting the bench, sterilising inoculating loops or using sterile disposables, opening lids for the shortest possible time, taping agar plates without fully sealing them, incubating school cultures at about 25 °C, and sterilising cultures before disposal.
Sealing agar plates completely
Do not fully seal an agar plate all the way around. Complete sealing can encourage anaerobic conditions, which may favour growth of harmful anaerobic microorganisms.
10. Dissection of plant and animal organs
Dissection uses instruments such as scalpels, scissors, forceps and mounted needles to expose internal structures. You may dissect plant organs, such as flowers, or animal organs, such as hearts or kidneys.
Work on a dissecting board, cut away from your fingers, use sharp instruments carefully, keep tissues damp if needed, and dispose of biological material safely. The point is careful observation, not simply “cutting it open”.
11. Sampling techniques in fieldwork
A sample is a manageable subset of a larger population or habitat. Fieldwork sampling should reduce bias and be large enough to represent the area.
Use random sampling when the habitat is fairly uniform: random numbers can place quadrats. Use systematic sampling when there is an environmental gradient: place quadrats along a transect line.
Estimating abundance from quadrats
A student samples 12 quadrats. Each quadrat is 0.50 m by 0.50 m. The total number of plants counted is 84. The whole area is 60 m².
-
Calculate the mean number per quadrat: 8412=7.0 plants per quadrat\frac{84}{12} = 7.0\ \text{plants per quadrat}1284=7.0 plants per quadrat.
-
Calculate quadrat area: 0.50 m×0.50 m=0.25 m20.50\ \text{m} \times 0.50\ \text{m} = 0.25\ \text{m}^20.50 m×0.50 m=0.25 m2.
-
Calculate density: 7.0 plants0.25 m2=28 plants m−2\frac{7.0\ \text{plants}}{0.25\ \text{m}^2} = 28\ \text{plants m}^{-2}0.25 m27.0 plants=28 plants m−2, then estimate the total population: 28 plants m−2×60 m2=1680 plants28\ \text{plants m}^{-2} \times 60\ \text{m}^2 = 1680\ \text{plants}28 plants m−2×60 m2=1680 plants.
12. ICT in practical biology
ICT can improve data collection and analysis. A data logger can record temperature, pH, oxygen concentration, carbon dioxide concentration or light intensity at set time intervals. This is useful for long experiments or rapid changes where human timing would be unreliable.
Software can process data by calculating means, plotting graphs, drawing lines of best fit and identifying patterns. Computer models can test how changing variables might affect a system, but the model is only as good as its assumptions and input data.
In the exam
-
Match each apparatus choice to the variable being measured, the required precision, and the unit.
-
For an unfamiliar practical, identify the independent variable, dependent variable, control variables, repeats, safety issues and ethical issues.
-
When using a calculation, show the formula, substitute values with units, and finish with a sensible rounded answer.
-
When evaluating, separate random error, systematic error, validity, reliability and limitations of the method.
Check yourself
- Why must an eyepiece graticule be calibrated separately for each objective lens?
- Which glassware would you choose to measure an accurate fixed volume, and why?
- How would you sample plant abundance fairly along a light-intensity gradient?
