PED along the curve
Definition
Price elasticity of demand (PED): the responsiveness of quantity demanded to a change in the good's own price, found by comparing the percentage change in quantity demanded with the percentage change in price.
PED=% ΔQd% ΔP \text{PED} = \dfrac{\%\,\Delta Q_d}{\%\,\Delta P} PED=%ΔP%ΔQd- A straight-line demand curve has a constant slope, but its price elasticity of demand is not constant.
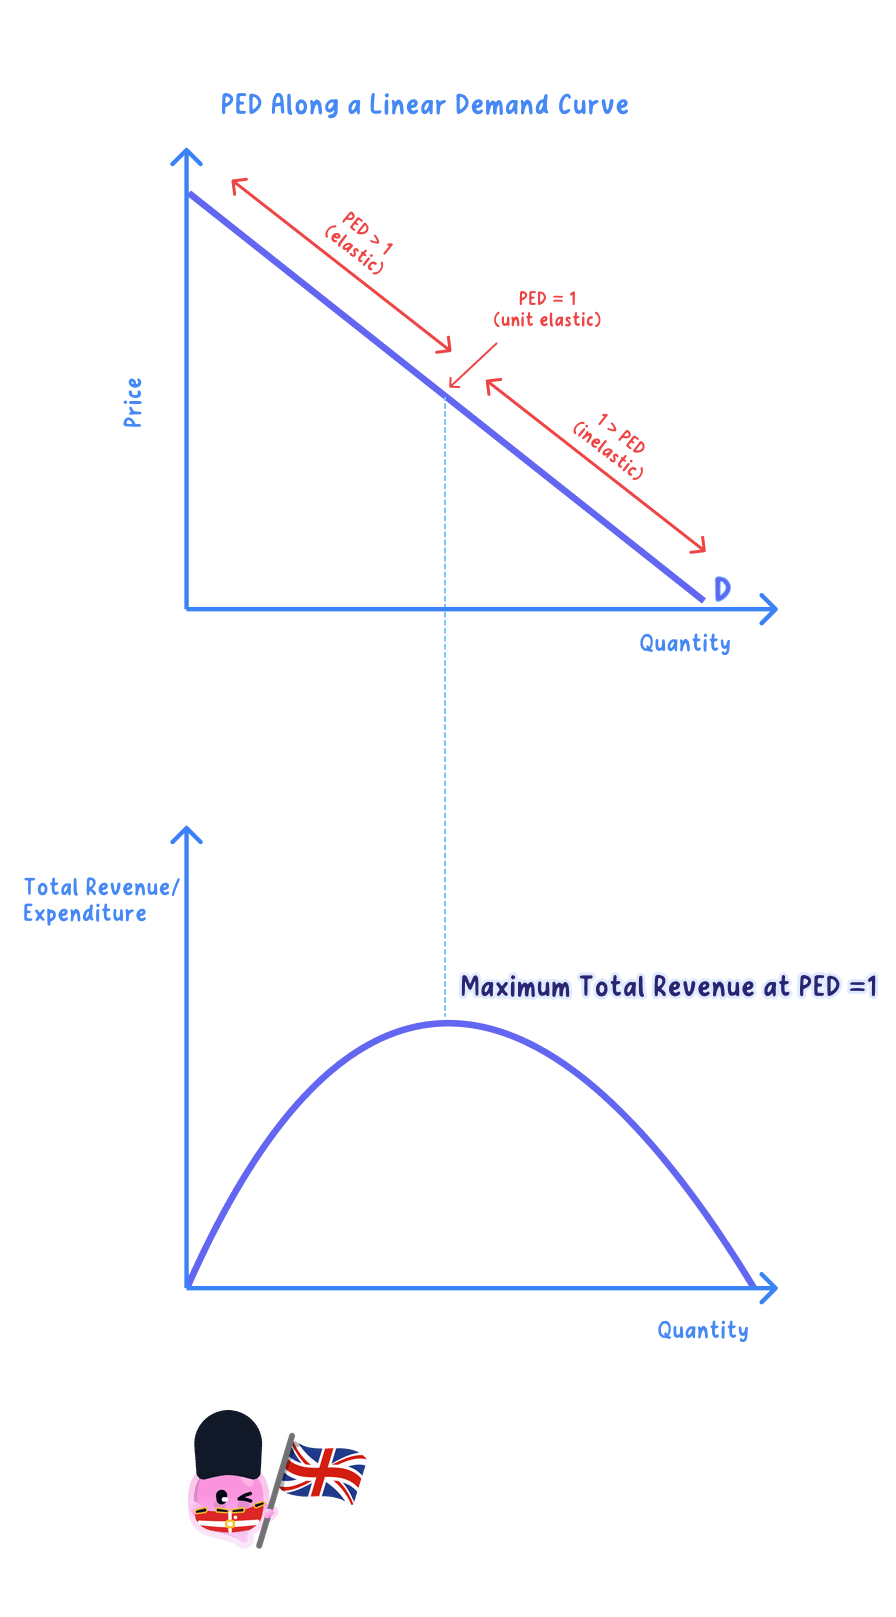
- PED falls steadily in size as you move down the curve from the top to the bottom.
- Demand is elastic in the upper half, unit elastic at the midpoint and inelastic in the lower half.
Key Idea
- A constant slope does not mean a constant elasticity, because elasticity depends on proportional changes that differ at every point.
- So the same curve can be elastic in its upper region and inelastic in its lower region.
Slope versus elasticity
- Slope measures the absolute change in price for a given absolute change in quantity, and it stays the same on a straight line.
- Elasticity instead compares the percentage change in quantity with the percentage change in price.
- Because the starting price and quantity change as you move along the curve, those percentage changes, and therefore PED, change too.
Elasticity down the curve
- Upper section (high price, low quantity)
- A small percentage price cut brings a large percentage rise in quantity, so demand is elastic and PED is greater than 1 in size.
- Midpoint
- The percentage changes are equal, so demand is unit elastic and PED equals 1 in size.
- Lower section (low price, high quantity)
- A large percentage price cut brings only a small percentage rise in quantity, so demand is inelastic and PED is less than 1 in size.
Example
- Take the demand curve Qd = 10 − P, running from a price of £10 (quantity 0) down to a price of £0 (quantity 10).
- Near the top, at £9 and quantity 1, a £1 price cut raises quantity from 1 to 2 (a rise of 100%) while price falls by about 11%.
- The size is 9.0, so demand is highly elastic.
- At the midpoint, £5 and quantity 5, a £1 price cut raises quantity from 5 to 6, so the percentage rise in quantity matches the percentage fall in price.
- The size is 1.0, so demand is unit elastic.
- Near the bottom, at £1 and quantity 9, a £1 price cut raises quantity from 9 to 10 (a rise of about 11%) while price falls by 100%.
- The size is 0.11, so demand is highly inelastic.
- So PED falls in size from towards infinity at the top, through 1 at the midpoint, to 0 at the bottom, even though the slope never changes.
Note
- At a high price the quantity is small, so any change in quantity is a large proportion of it, making the percentage change in quantity large and demand elastic.
- At a low price the quantity is large, so the same change is a small proportion and demand is inelastic.
Link to total revenue
TR=P×Q TR = P \times Q TR=P×Q- Total revenue is price times quantity, shown as the rectangle under a point on the curve.
- Cutting price in the elastic upper section raises total revenue, because quantity rises by a larger percentage than price falls.
- Cutting price in the inelastic lower section lowers total revenue, because quantity rises by a smaller percentage than price falls.
- Total revenue therefore peaks at the midpoint, where PED equals 1 in size.
Pricing implications
- A firm's best price move depends on where it currently sits on its demand curve: a streaming service priced high (elastic region) can raise revenue by cutting price and winning many more subscribers, while a rail operator on an inelastic commuter route raises revenue by raising fares.
- There is no single rule that a price cut always helps or always hurts revenue; it depends on the elasticity at the current price.
- The firm must locate its current elasticity before deciding whether to raise or cut price.
Exam technique
- State clearly that a constant slope does not mean a constant elasticity.
- Locate the point on the curve before judging whether demand is elastic or inelastic.
- Remember that PED equals 1 in size at the midpoint, where total revenue is maximised.
Common Mistake
- Do not assume a straight-line demand curve has a single elasticity, because PED falls from elastic at the top to inelastic at the bottom.
- Do not confuse slope with elasticity, because slope uses absolute changes while elasticity uses proportional changes.
Self review
- Is PED constant along a straight-line demand curve?
- Where on the curve is demand elastic, and where is it inelastic?
- What is the value of PED at the midpoint?
- Why does elasticity fall as price falls along the curve?
- At which point on the curve is total revenue maximised?
