Shape of the AS Curve
Definition
Short-run aggregate supply (SRAS): the total real output firms plan to supply at each average price level while money wages and other input costs stay fixed.
Long-run aggregate supply (LRAS): the real output the economy can produce once all input prices, including wages, have fully adjusted, so it reflects productive capacity rather than demand.
- The macro axes are the average price level (vertical) and real output (horizontal), not the price and quantity of one good.
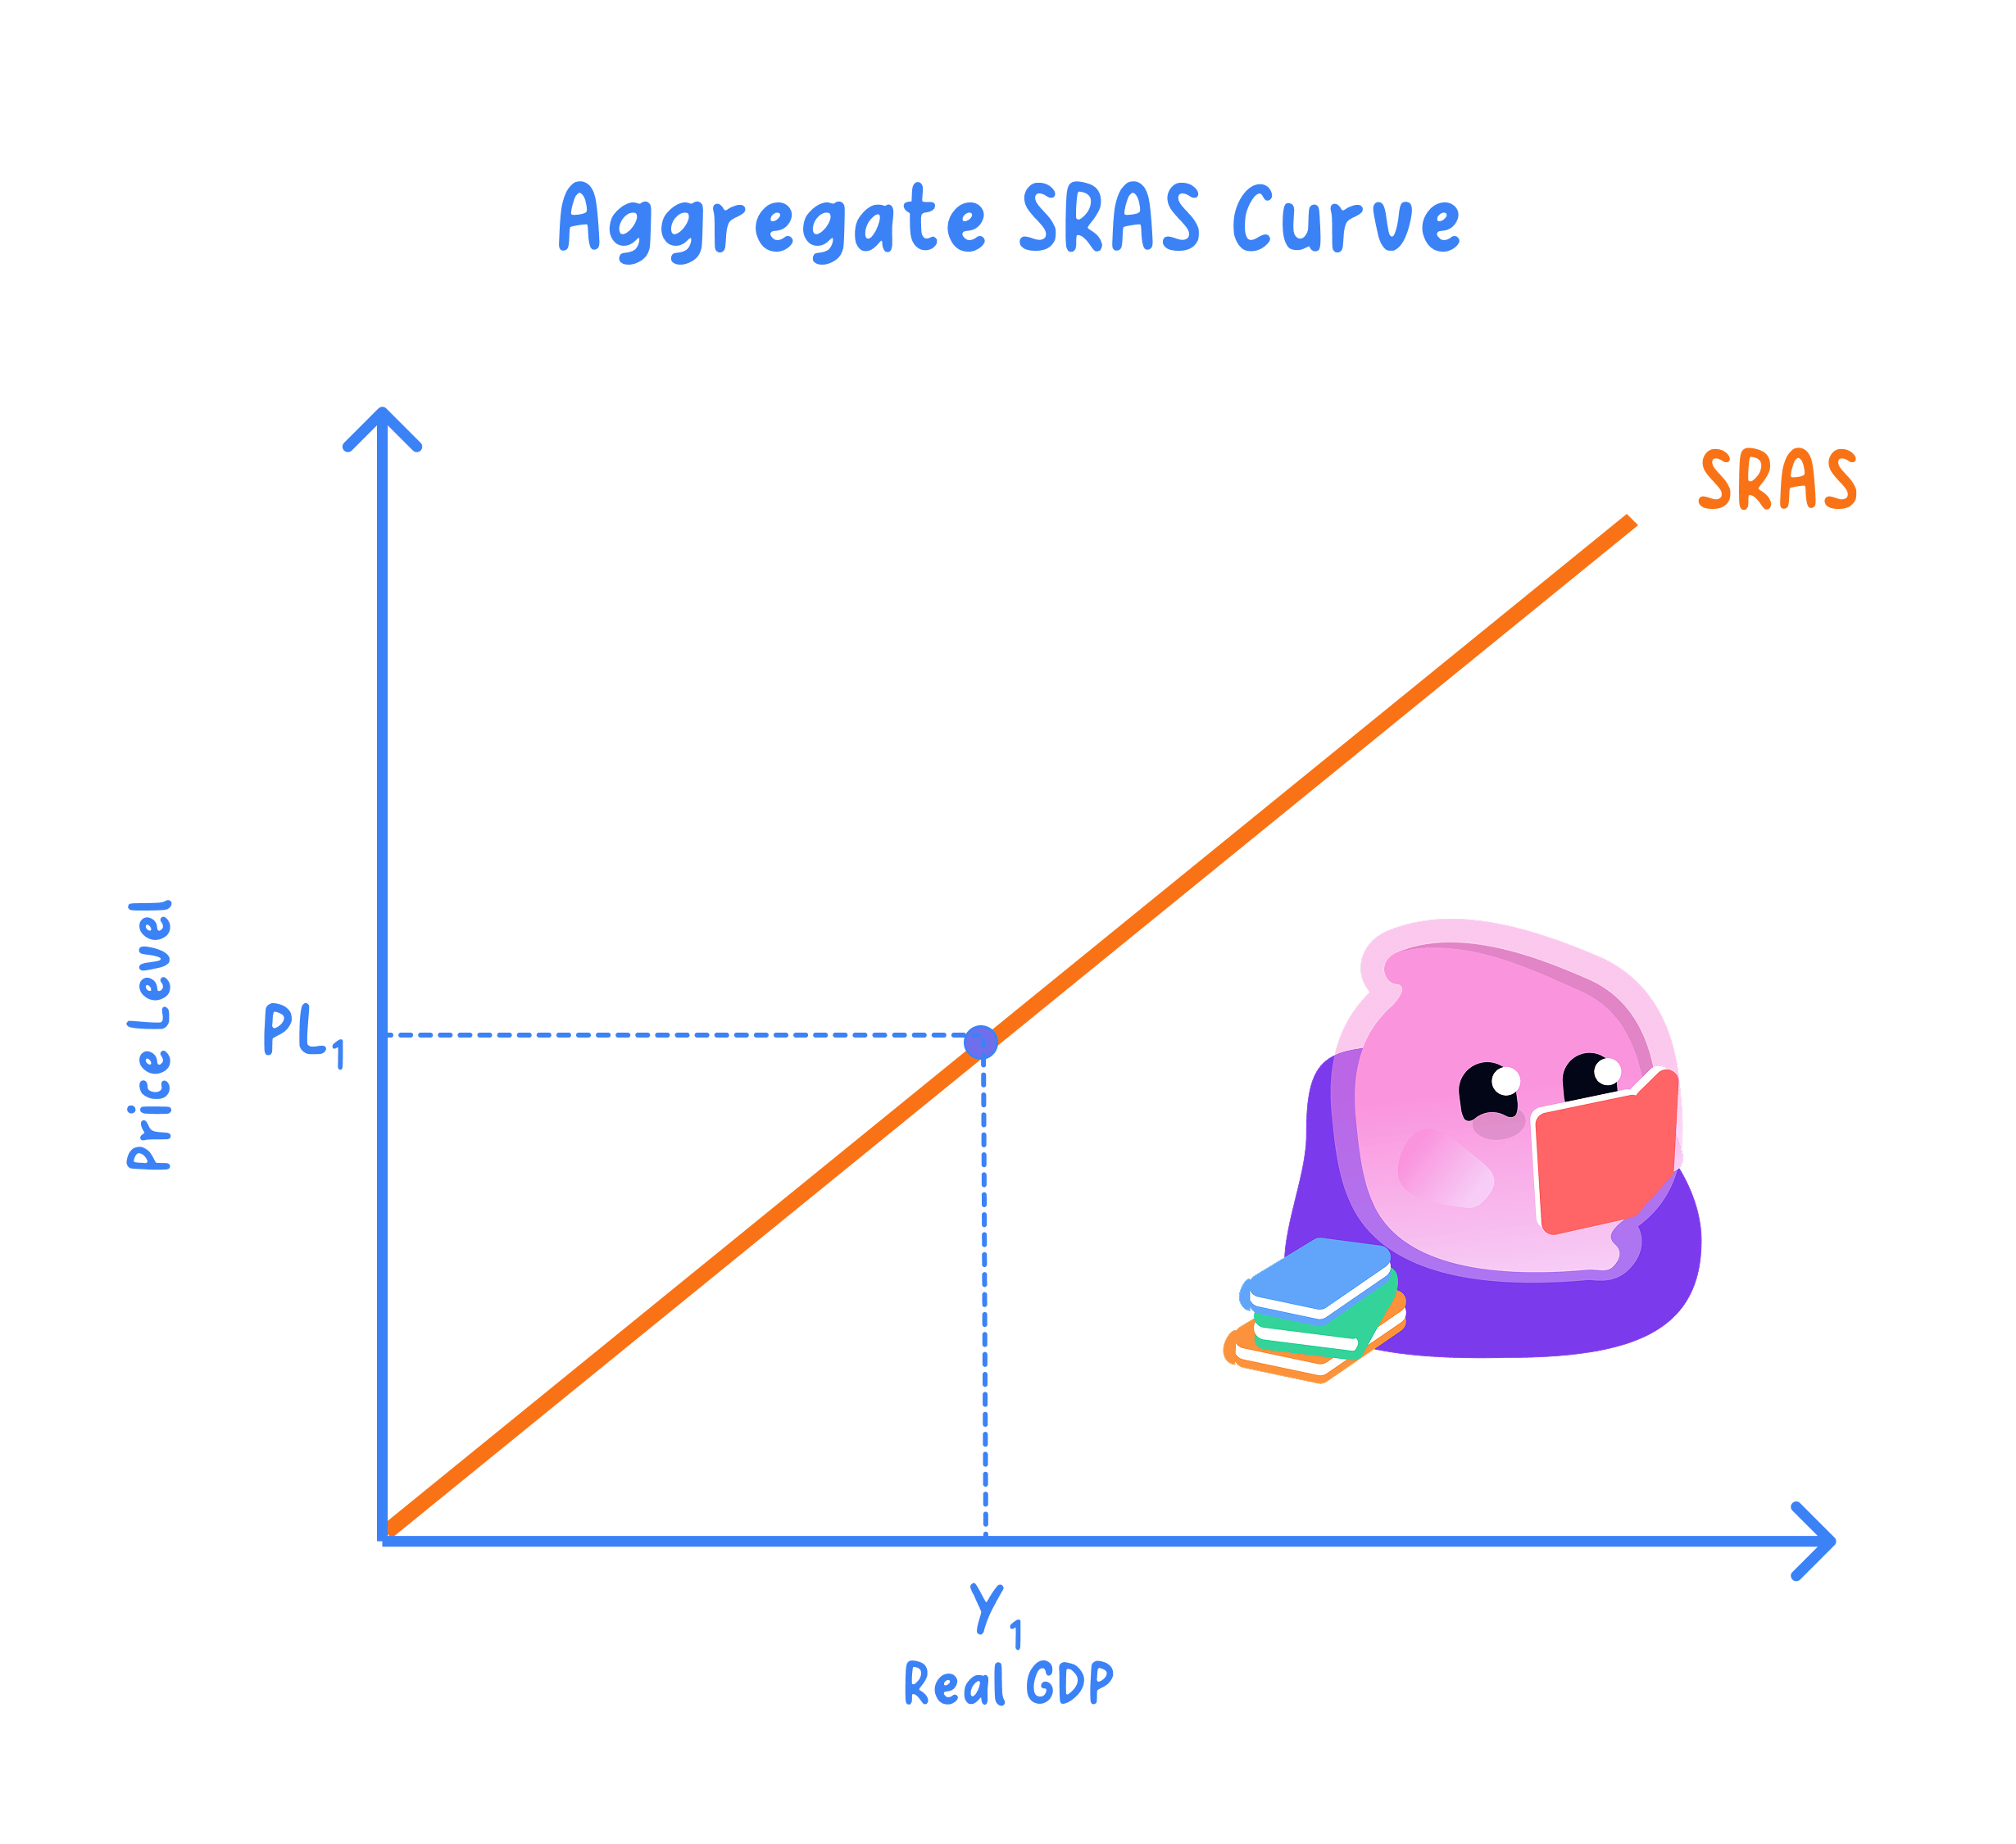
- SRAS is upward sloping, drawn as a straight line or a sweeping curve.
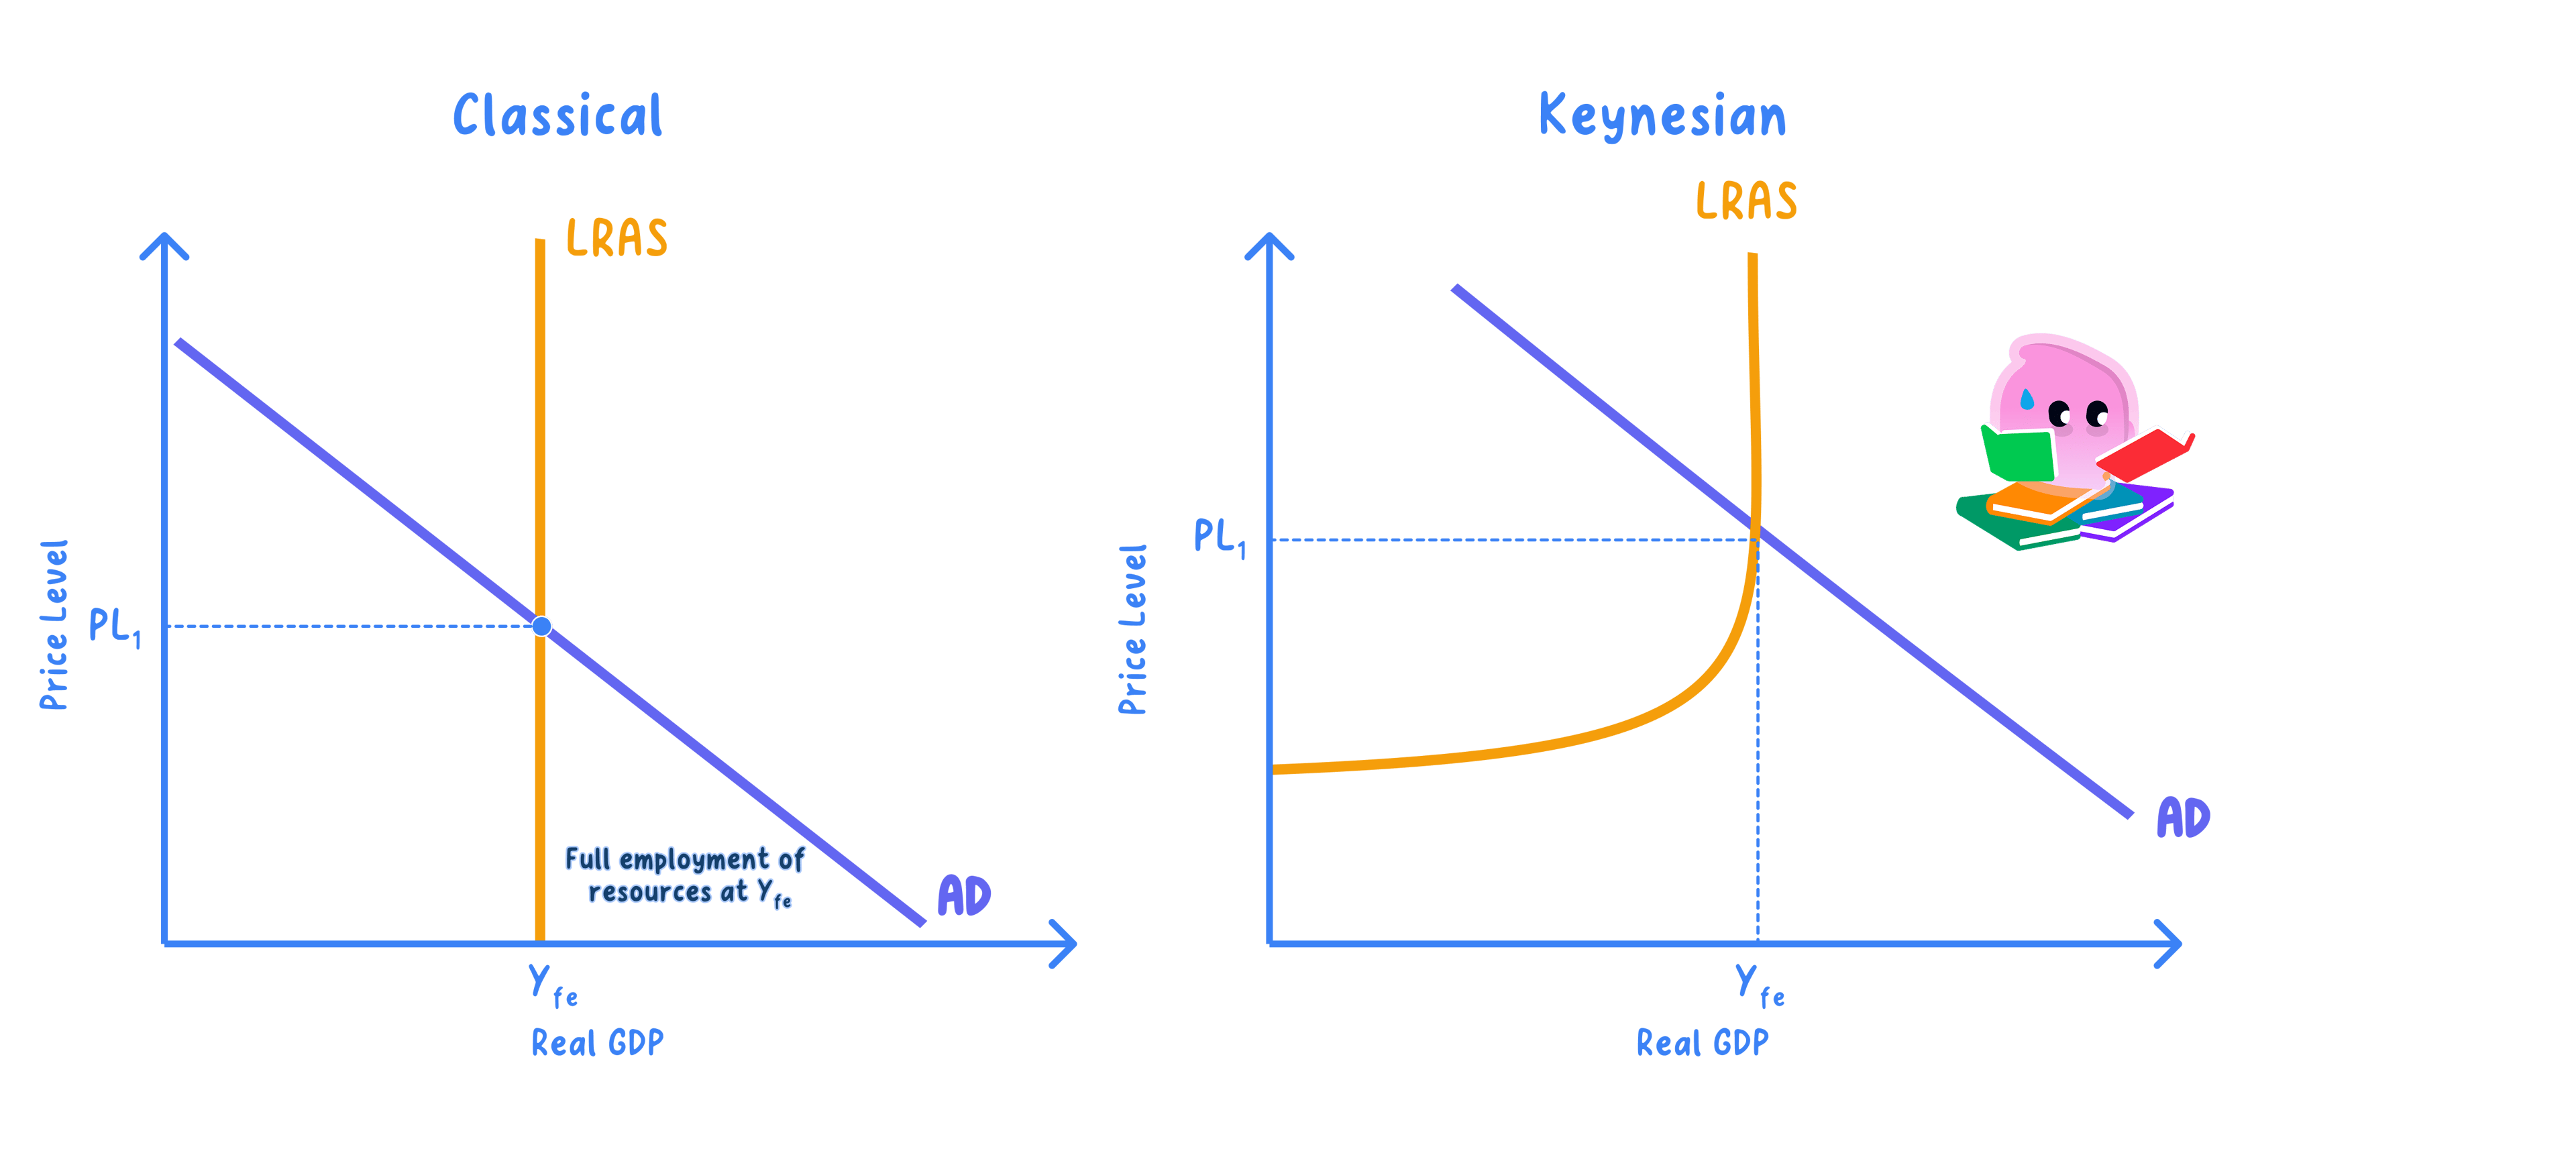
- LRAS is either a single vertical line (classical) or a three-section curve (Keynesian).
Key Idea
- SRAS slopes upward because costs are fixed while prices can rise, so higher prices widen margins.
- LRAS depends on capacity, so it is vertical (classical) or three-section (Keynesian).
Why SRAS Slopes Upward
- In the short run, money wages and many input costs are locked by contracts, so they cannot adjust immediately to a change in the price level.
- A higher average price level with those costs fixed widens the gap between revenue per unit and cost per unit, so profit margins rise.
- Wider margins make extra output profitable, so firms expand production: price level ↑ → real output ↑, tracing an upward-sloping SRAS.
Example
- A furniture maker signs annual wage contracts at £2,400 per worker per month, fixed for the year.
- The average price level rises by +5%, so each table now sells for £210 instead of £200 while the wage bill is unchanged.
- The margin on each table widens by +£10, so producing extra tables becomes more profitable.
- The firm adds hours and hires, so real output rises as the price level rises, which economy-wide traces the upward-sloping SRAS.
The Shape of LRAS
- LRAS shows the maximum sustainable real output once all input prices have fully adjusted, so it reflects the quantity and quality of factors of production.
- The classical view draws LRAS as a vertical line at the full-employment level of output, because flexible wages always return the economy to capacity.
- The Keynesian view draws LRAS in three sections: highly elastic, then upward sloping, then vertical, because spare capacity can persist.
Example
- Highly elastic section: with unemployment near 10% and idle factories, firms can raise output by hiring spare workers with almost no change in the price level.
- Upward-sloping section: as unemployment falls toward 4%, bottlenecks and skill shortages appear, so extra output now comes with a rising price level.
- Vertical section: at full capacity no extra real output is possible, so added demand only raises the price level.
Why the Two Views Differ
- The classical view assumes wages and prices are fully flexible, so any spare capacity is quickly bid away and output returns to full employment.
- The Keynesian view assumes wages are sticky downward, so an economy stuck in recession can settle below full capacity for a long time.
- The shape you draw therefore encodes a judgement about how fast markets clear, so it depends on the time horizon and how flexible wages are.
Exam technique
- Draw SRAS as an upward-sloping line or sweeping curve on price level × real output axes.
- Draw the classical LRAS as a vertical line at full-employment output.
- Draw the Keynesian LRAS in three sections: highly elastic, upward sloping and vertical.
Common Mistake
- Do not draw the Keynesian LRAS as a single straight line.
- It has three distinct sections: highly elastic, upward sloping and vertical.
- Do not confuse the shape of a curve with a shift of the curve.
Self review
- Why does the SRAS curve slope upward?
- What shape is the classical LRAS curve, and why?
- What are the three sections of the Keynesian LRAS curve?
- Why do the classical and Keynesian views of LRAS differ?
