Elasticity and revenue
- Price elasticity of demand decides what happens to total revenue when a firm changes price.
- A price cut raises total revenue when demand is elastic (|PED| > 1).
- A price cut lowers total revenue when demand is inelastic (|PED| < 1).
Key Idea
- Total revenue is maximised where price elasticity of demand = 1.
- Marginal revenue is positive on the elastic part of the demand curve and negative on the inelastic part.
Normal demand curve
- When demand is elastic, quantity responds strongly, so a price cut raises total revenue.
- When demand is inelastic, quantity barely moves, so a price rise raises total revenue.
- Along a straight-line demand curve the upper part is elastic and the lower part is inelastic.
- Total revenue peaks at the midpoint, where price elasticity of demand = 1 and marginal revenue = 0 (refer to 7.2.5 or 7.2.7 for more details).
Example
- Start at a price of £10 and 100 units, so total revenue = £10 × 100 = £1,000; now cut price to £8, a −20% change, as quantity rises to 150, a +50% change.
- Because |PED| = 2.5 > 1 demand is elastic, so the price cut raises total revenue to £8 × 150 = £1,200.
- With inelastic demand a rise to £12 (+20%) cuts quantity only to 90 (−10%), so PED = −0.5 and total revenue still rises, to £1,080.
Example
- Cutting an off-peak rail fare when demand is elastic attracts enough extra passengers to raise total revenue.
- Raising the price of a life-saving drug with inelastic demand raises total revenue because quantity hardly falls.
Kinked demand curve
Definition
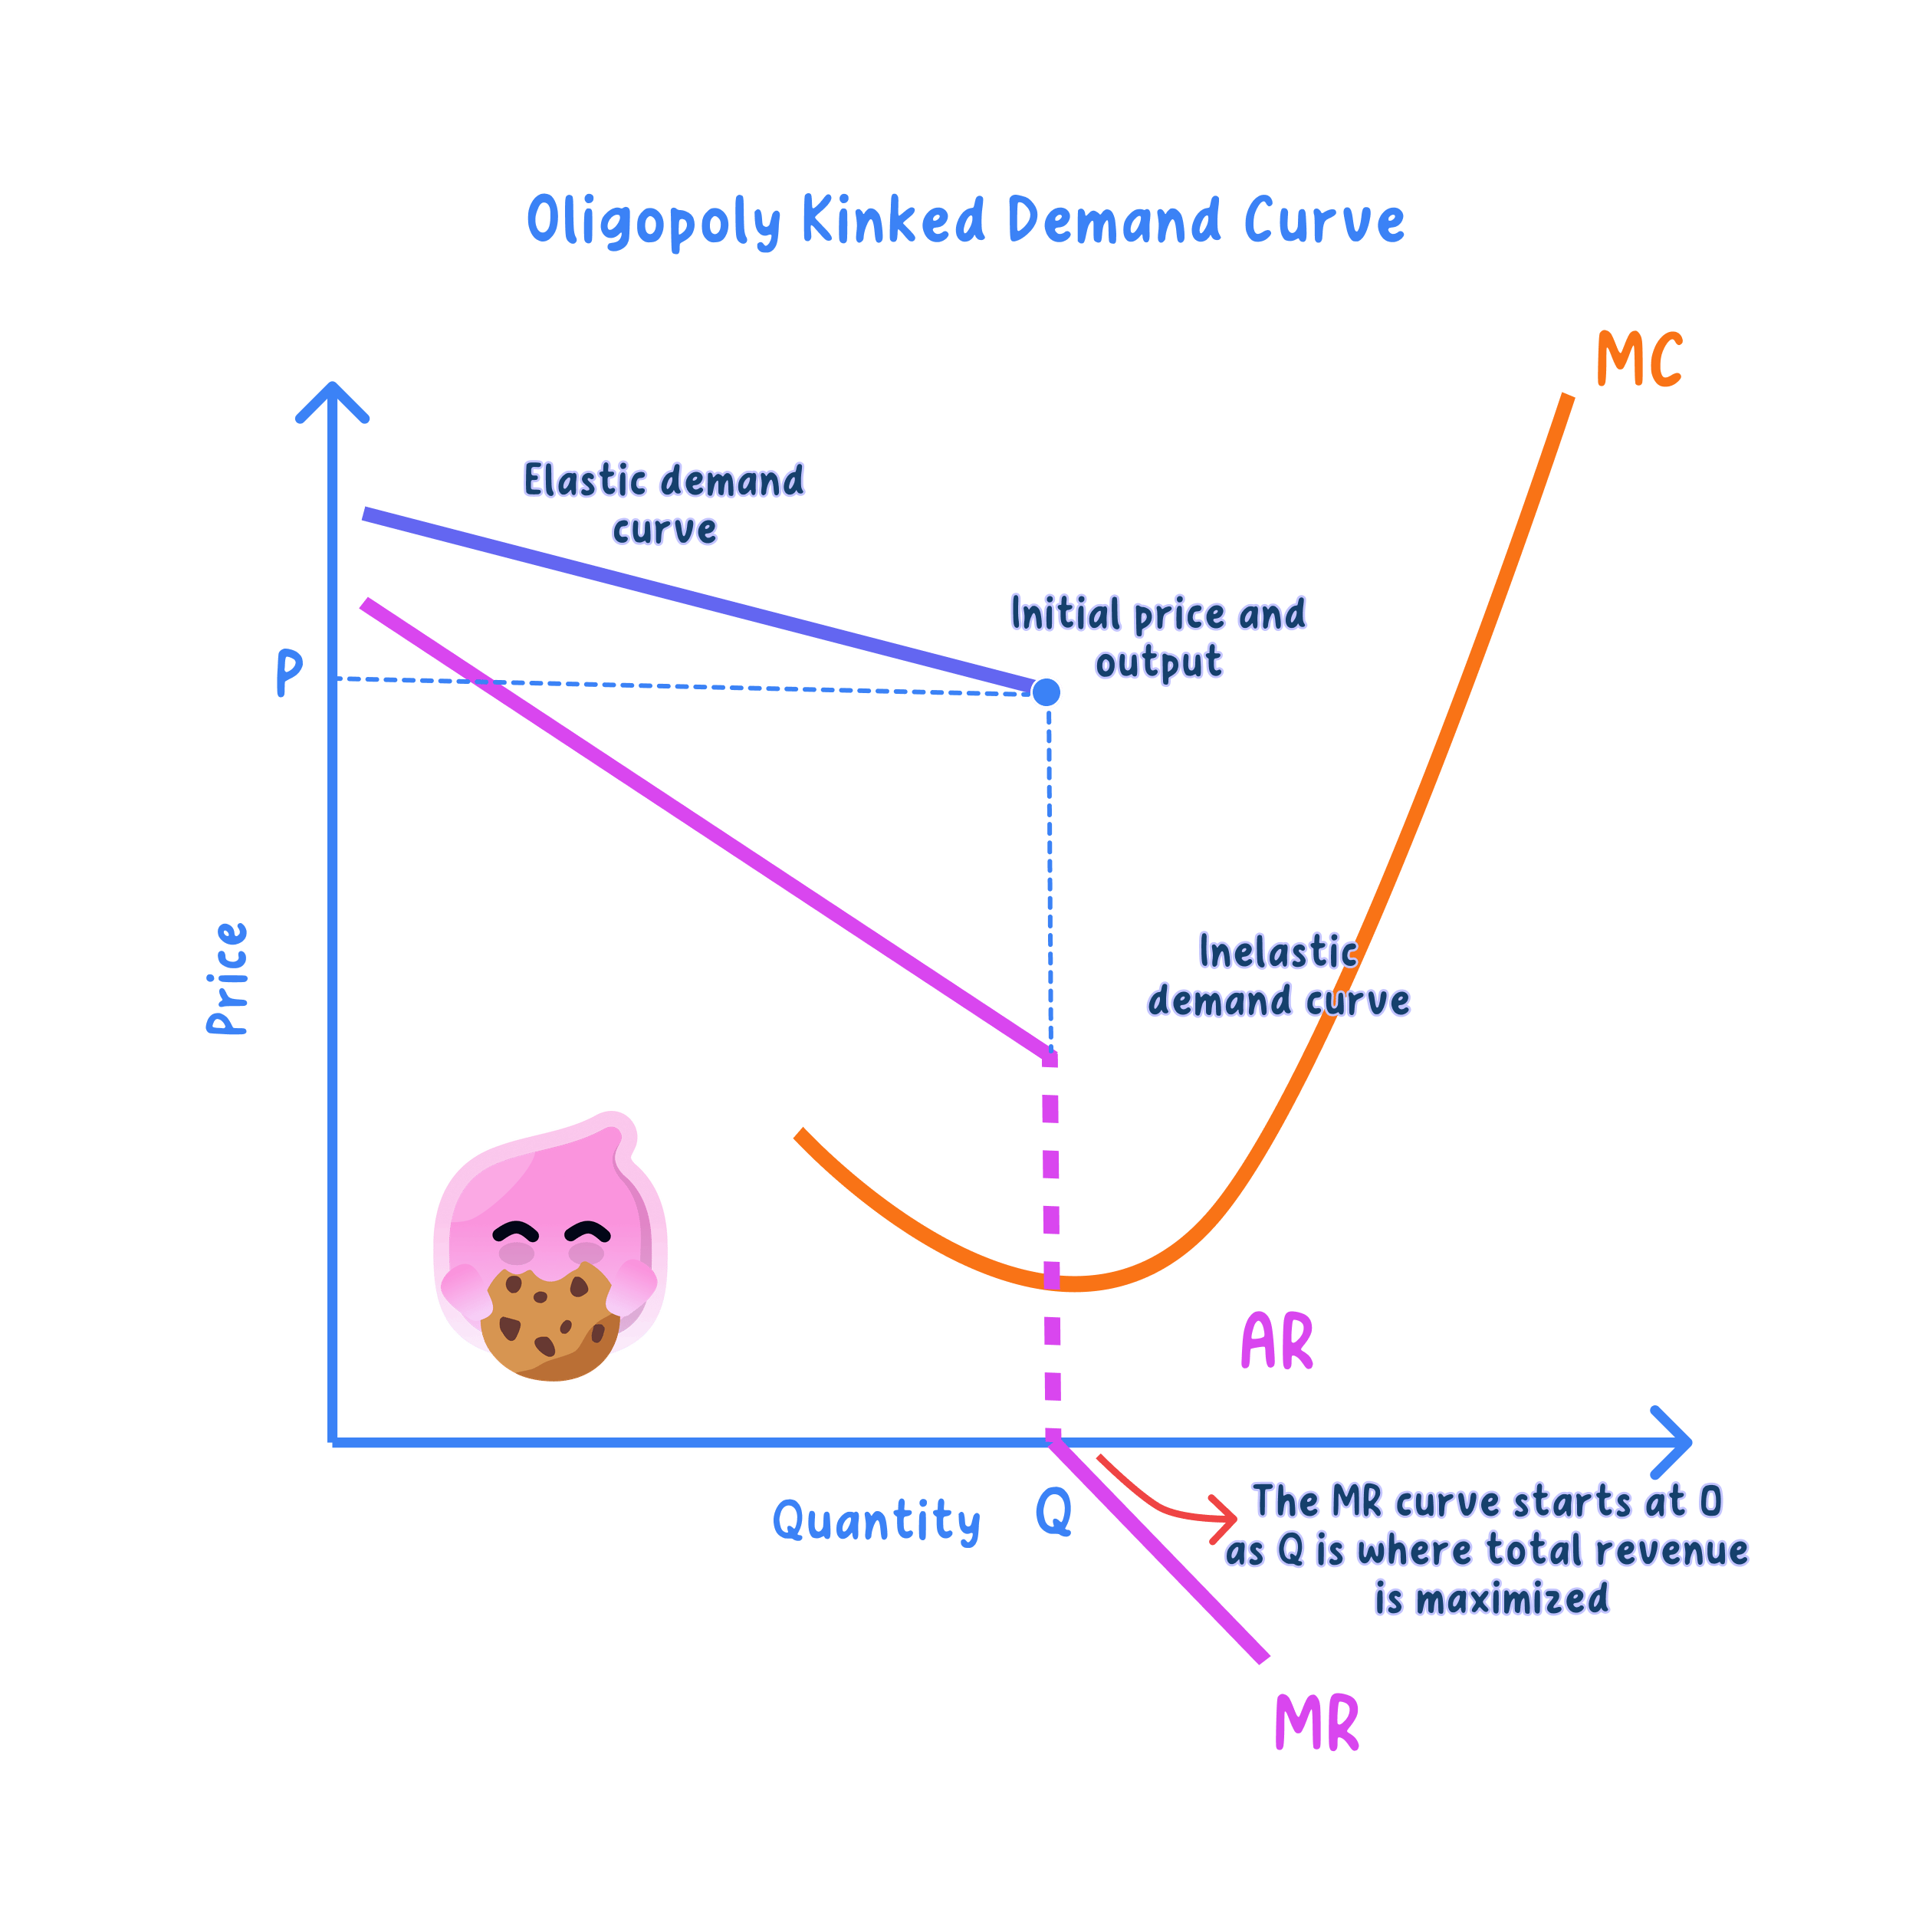
Kinked demand curve: a model of oligopoly in which demand is more elastic above the current price than below it, because rivals ignore a price rise but match a price cut.
- The kinked demand curve models an oligopolist facing interdependent rivals.
- Demand is elastic above the current price, because if the firm raises its price rivals gain by leaving their own prices unchanged to capture the customers who switch away, so the firm loses a large share of its sales.
- Demand is inelastic below the current price, because if the firm cuts its price rivals must match the cut to protect their own market share, so the firm wins only a few extra customers.
- This asymmetric reaction by rivals is what bends demand at the kink and produces a discontinuous marginal revenue curve with a vertical gap beneath the kink.
- A price rise loses much revenue and a price cut gains little, so revenue is greatest by holding price at the kink (price rigidity).
Example
- At the kink price of £10 the firm sells 100 units and earns £1,000.
- A rise to £12 is not followed by rivals, so demand is elastic, quantity falls to 60 and revenue falls to £720.
- A cut to £8 is matched by rivals, so demand is inelastic, quantity rises only to 110 and revenue falls to £880.
- Revenue is therefore greatest by holding price at the kink, which explains price rigidity.
Note
- On the diagram the marginal revenue curve is discontinuous, with a vertical gap directly below the kink in demand.
- Because marginal revenue jumps down through this gap, revenue falls whether the firm raises or cuts price, so total revenue is greatest at the kink itself.
How reliable is the revenue logic of the kink?
- The revenue logic is persuasive. Because demand is elastic above the current price, a price rise loses proportionately more quantity than it gains in price, so total revenue falls, and because demand is inelastic below the current price, a price cut wins too little extra quantity to offset the lower price, so total revenue falls there too. Revenue is therefore greatest at the kink, which gives the firm little revenue incentive to move price in either direction.
- The conclusion rests entirely on the assumption that rivals ignore a price rise but match a price cut. If rivals instead follow a rise, demand above the kink is less elastic and a price rise need not reduce revenue so sharply, and if they ignore a cut, demand below the kink is more elastic and a price cut could raise revenue. Change the assumed reaction and the revenue result changes.
- The model also identifies the revenue position only at the existing price and does not explain where that price came from, and because it says nothing about costs it cannot on its own identify the profit-maximising price as opposed to the revenue-stable one.
- On balance, the kink is a useful way to show how differing price elasticity above and below the current price makes a firm's total revenue greatest at that price, but the revenue prediction holds only where rivals react as the model assumes and the product is fairly homogeneous, so it is a starting point rather than a full account of the firm's revenue.
Exam technique
- Establish whether demand is elastic or inelastic before predicting the effect on revenue.
- For the kinked demand curve, draw the vertical gap in marginal revenue below the kink and explain why revenue is greatest at the kink price.
Common Mistake
- Do not assume raising price always raises revenue, since a price rise lowers revenue when demand is elastic.
- Do not draw a continuous marginal revenue curve for the kinked demand model; it must have a gap.
Self review
- When does a price cut raise total revenue?
- Where on a normal demand curve is total revenue maximised?
- Why is demand elastic above the kink but inelastic below it?
- What happens to marginal revenue at the kink?
- Why is a firm's total revenue greatest at the kink price?
