Economies of scale
Definition
Economies of scale: the fall in long-run average cost as a firm expands its scale of output.
- As a firm raises its scale of output, it can spread heavy fixed costs, such as machinery, specialist managers and advertising, over more units, and deepen advantages like bulk buying and cheaper finance, so the cost of producing each unit falls.
- As these advantages accumulate, long-run average cost falls, which is what decreasing average costs means.
- So economies of scale are the cause, and decreasing long-run average cost is the effect.
Key Idea
- Economies of scale lower the cost of each unit as output rises.
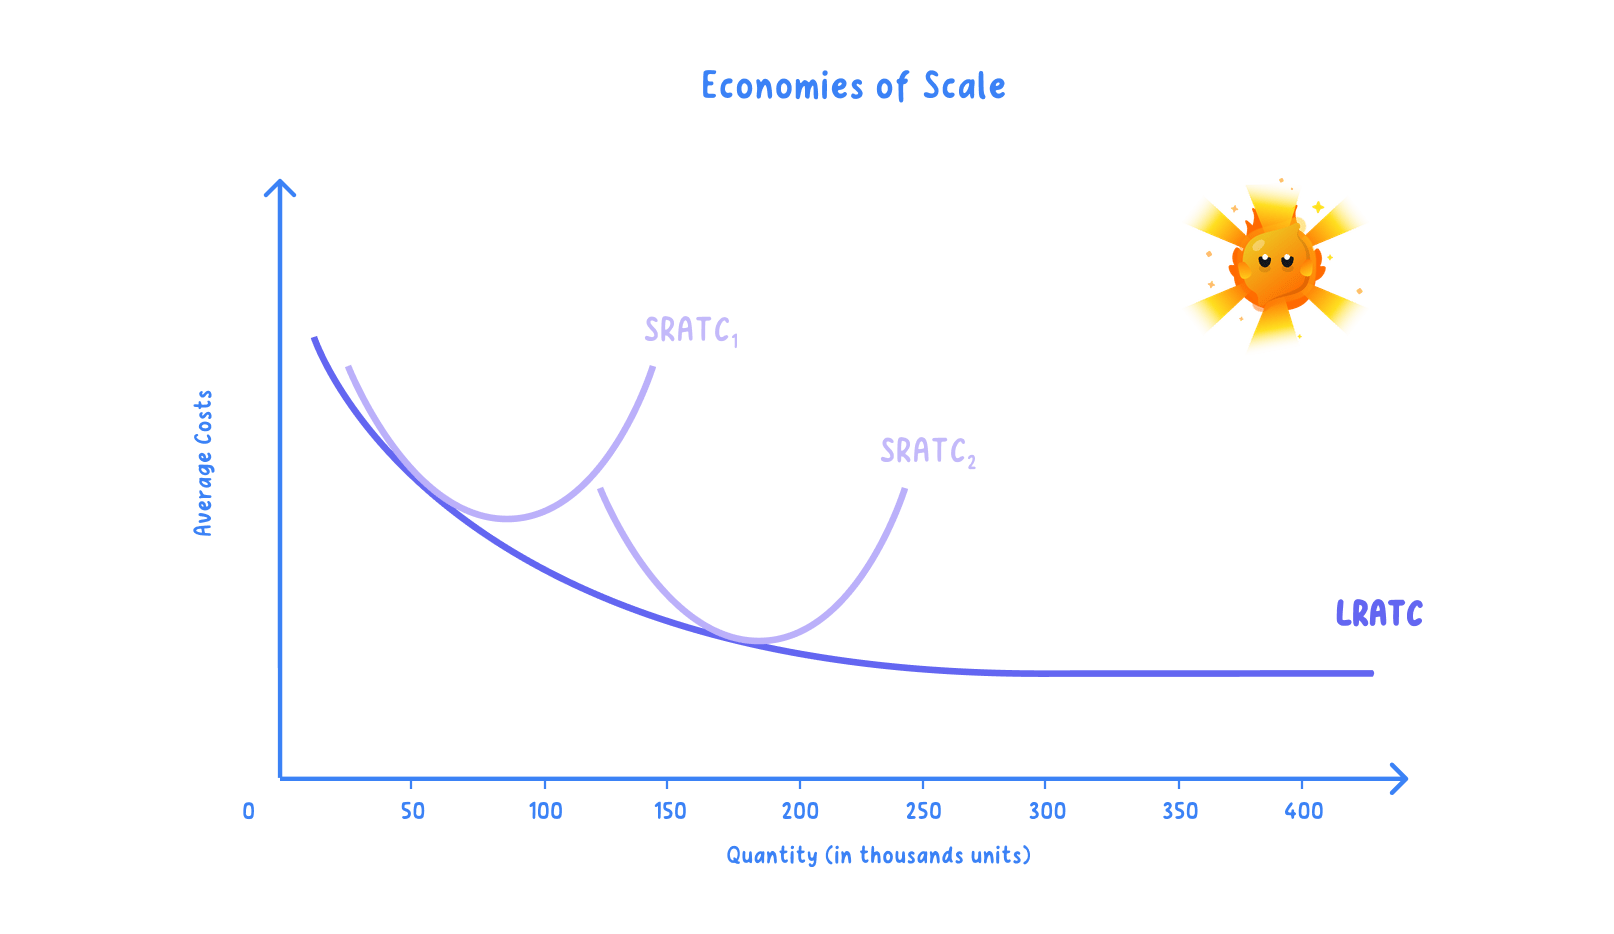
- They produce the downward-sloping section of the long-run average cost curve.
Falling section of the LRAC
- Where the firm enjoys economies of scale, the long-run average cost curve slopes downward.
- Each unit of output is then produced at a lower average cost than at a smaller scale.
- This continues until economies of scale are exhausted at the minimum efficient scale.
- Beyond that output, average cost is constant or, if diseconomies of scale set in, rising.
Example
- A brewery that doubles output can run one large, efficient plant, cutting its cost per unit.
- A supermarket chain buys stock in bulk far more cheaply than a small shop, lowering average cost.
Worked example
Example
- A firm's total cost is £6,000 at 1,000 units; scaling to 10,000 units, bulk buying and larger machines hold total cost to £40,000, up only 567% for a 900% rise in output.
- At 1,000 units, total cost is £6,000.
- So average cost is £6.00.
- At 10,000 units, total cost is £40,000.
- So average cost is £4.00.
- So a 10× rise in scale cuts average cost from £6.00 to £4.00, a 33% fall, tracing the downward-sloping LRAC.
Sources of economies
- Technical economies arise as larger, more efficient machinery spreads its cost over more output.
- Managerial and financial economies arise as specialist managers and cheaper finance reduce the cost per unit.
- Purchasing economies arise as buying inputs in bulk earns discounts a small firm cannot get.
- These internal and external sources are examined more fully in the next subtopic, but each works by reducing average cost.
Do bigger firms always enjoy lower average costs?
- This holds while the firm is on the falling section of its LRAC curve, since technical, purchasing and managerial economies keep cutting the cost of each unit as output rises.
- But the fall stops at the minimum efficient scale; beyond it average cost is constant along an L-shaped LRAC, or rises if diseconomies of scale set in, so extra size then brings no saving or even a penalty.
- It also depends on the industry: where the minimum efficient scale is large relative to the market, scale confers a big cost advantage, whereas in craft or personal-service markets the economies are small and size matters little.
- On balance, size lowers average cost only up to the minimum efficient scale, so whether a bigger firm is cheaper depends on where it sits on the LRAC curve and on how large the available economies are in that industry.
Exam technique
- Name a specific economy of scale, then show how it lowers average cost.
- Link the effect to the downward slope of the long-run average cost curve.
Common Mistake
- Do not confuse economies of scale with a fall in total cost, since they mean a lower cost per unit.
- Do not assume average cost falls forever, because economies of scale stop at the minimum efficient scale.
Self review
- Define economies of scale.
- Explain the relationship between economies of scale and decreasing average costs.
- Which part of the LRAC curve do economies of scale explain?
- Give two sources of economies of scale and show how each lowers unit cost.
