Long-run average cost
Definition
Long-run average cost (LRAC): the lowest average cost a firm can achieve at each level of output when every factor of production is variable.
- In the long run, all factors are variable, so the firm can choose any scale of plant.
- The LRAC curve shows the cheapest way to produce each level of output once plant size is chosen freely.
- It is the envelope of the short-run average cost curves, tangent to each one rather than joining their lowest points.
Key Idea
- Each short-run average cost curve fits one fixed scale of plant.
- The LRAC traces the lower envelope of these curves, showing the cheapest way to produce each output.
Shape of the curve
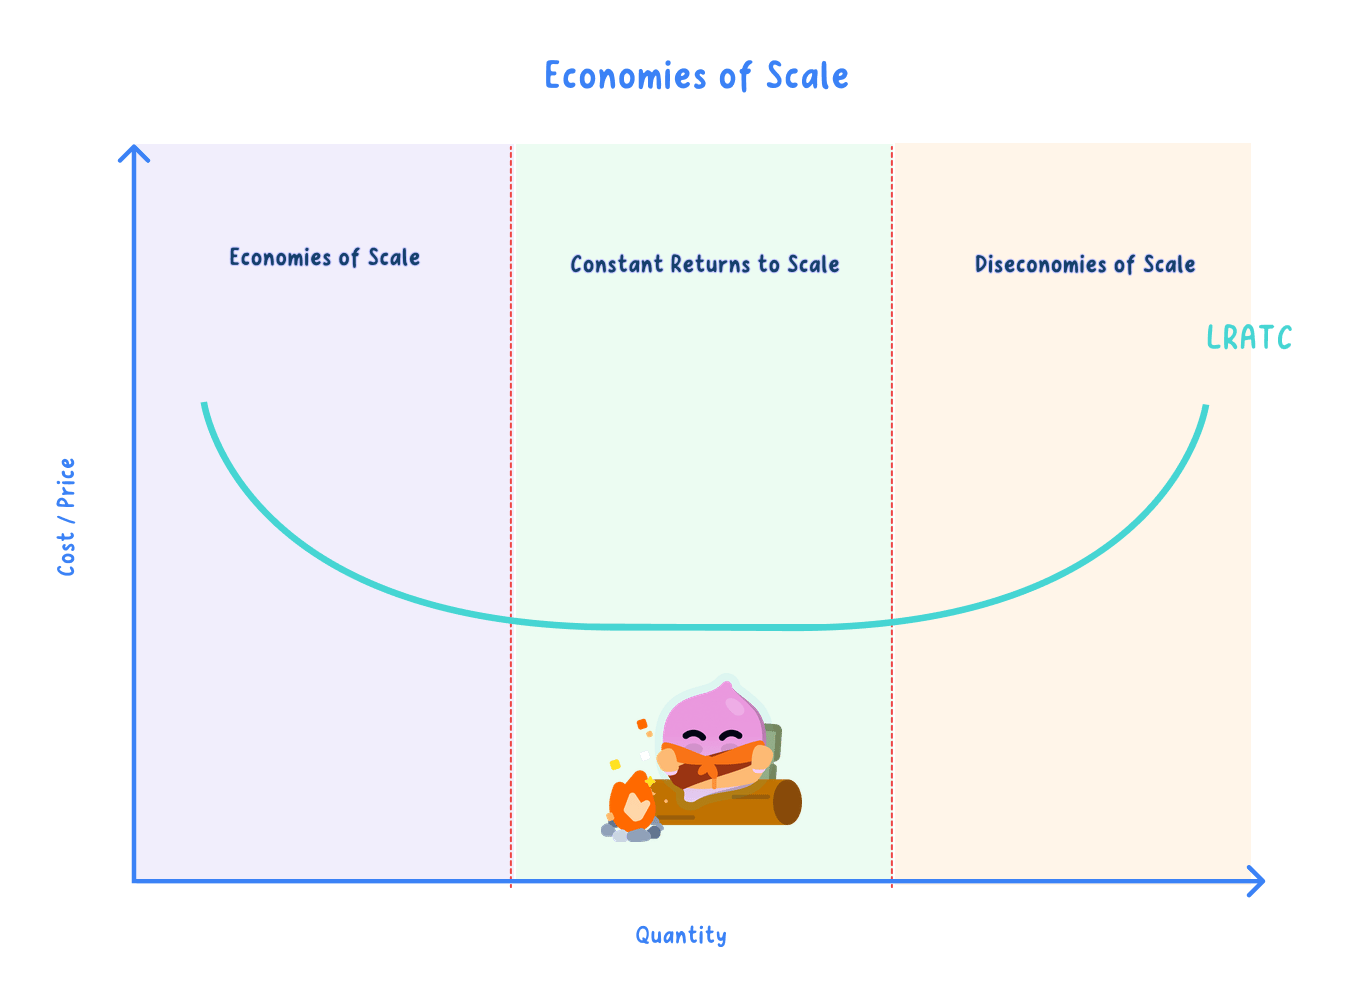
- A falling section reflects economies of scale, where long-run average cost decreases as output rises.
- A flat section reflects constant returns to scale, where average cost neither falls nor rises.
- A rising section reflects diseconomies of scale, which gives the curve its U shape.
- Whether the curve is U-shaped or L-shaped depends on the industry, since if diseconomies never set in average cost stays constant after the falling section.
Example
- A small plant reaches its lowest average cost only at a low level of output.
- A larger plant reaches an even lower average cost at a higher level of output.
Worked example
Example
- At an output of 1,000 units a day the firm's long-run average cost is £20 per unit.
- Raising output to 3,000 units spreads resources further and cuts long-run average cost to £12 per unit.
- At 6,000 units the firm reaches its lowest long-run average cost of £8 per unit, its minimum efficient scale.
- Long-run average cost falls 60% between 1,000 and 6,000 units as economies of scale are exploited.
- It stays at £8 per unit up to 10,000 units, so the curve is flat over this range.
- Pushing output to 14,000 units brings coordination problems that raise long-run average cost back to £10 per unit.
Minimum efficient scale
Definition
Minimum efficient scale (MES): the lowest output at which long-run average cost stops falling, so the firm has exhausted its economies of scale.
- A firm producing below this scale cannot match the average costs of larger rivals, so it may be undercut.
- On an L-shaped LRAC it is the output at which average cost first becomes constant.

Key Idea
- At the minimum efficient scale the firm has captured all available economies of scale.
- Producing below the minimum efficient scale means higher average costs than larger rivals.
Example
- Hairdressing has a low minimum efficient scale, so many small salons can compete.
- Car manufacturing has a high minimum efficient scale, so a few large firms dominate.
MES and market size
- A small MES relative to market demand allows many firms to compete.
- A large MES relative to market demand supports only a few large firms.
- A high MES can act as a barrier to entry for newcomers, since a small entrant would face far higher unit costs.
Exam technique
- Draw the LRAC tangent to each SRAC, not joining their minimum points.
- Mark the minimum efficient scale where average cost first stops falling.
Common Mistake
- Do not draw the LRAC joining the bottoms of the SRAC curves, since it is their lower envelope.
- Do not treat the minimum efficient scale on an L-shaped curve as a single point, since it is where average cost first becomes constant.
Self review
- Why is the LRAC the envelope of the SRAC curves?
- What causes the falling and rising sections of the LRAC?
- Define minimum efficient scale and locate it on an L-shaped LRAC.
- How does the size of the MES relative to the market affect the number of firms?
