Firm performance
- A firm's performance is the output, profit and efficiency it achieves.
- Performance depends on the market structure and on the revenue and cost curves the firm faces.
Revenue curves
- Total revenue (TR) is price multiplied by quantity: TR = P × Q.
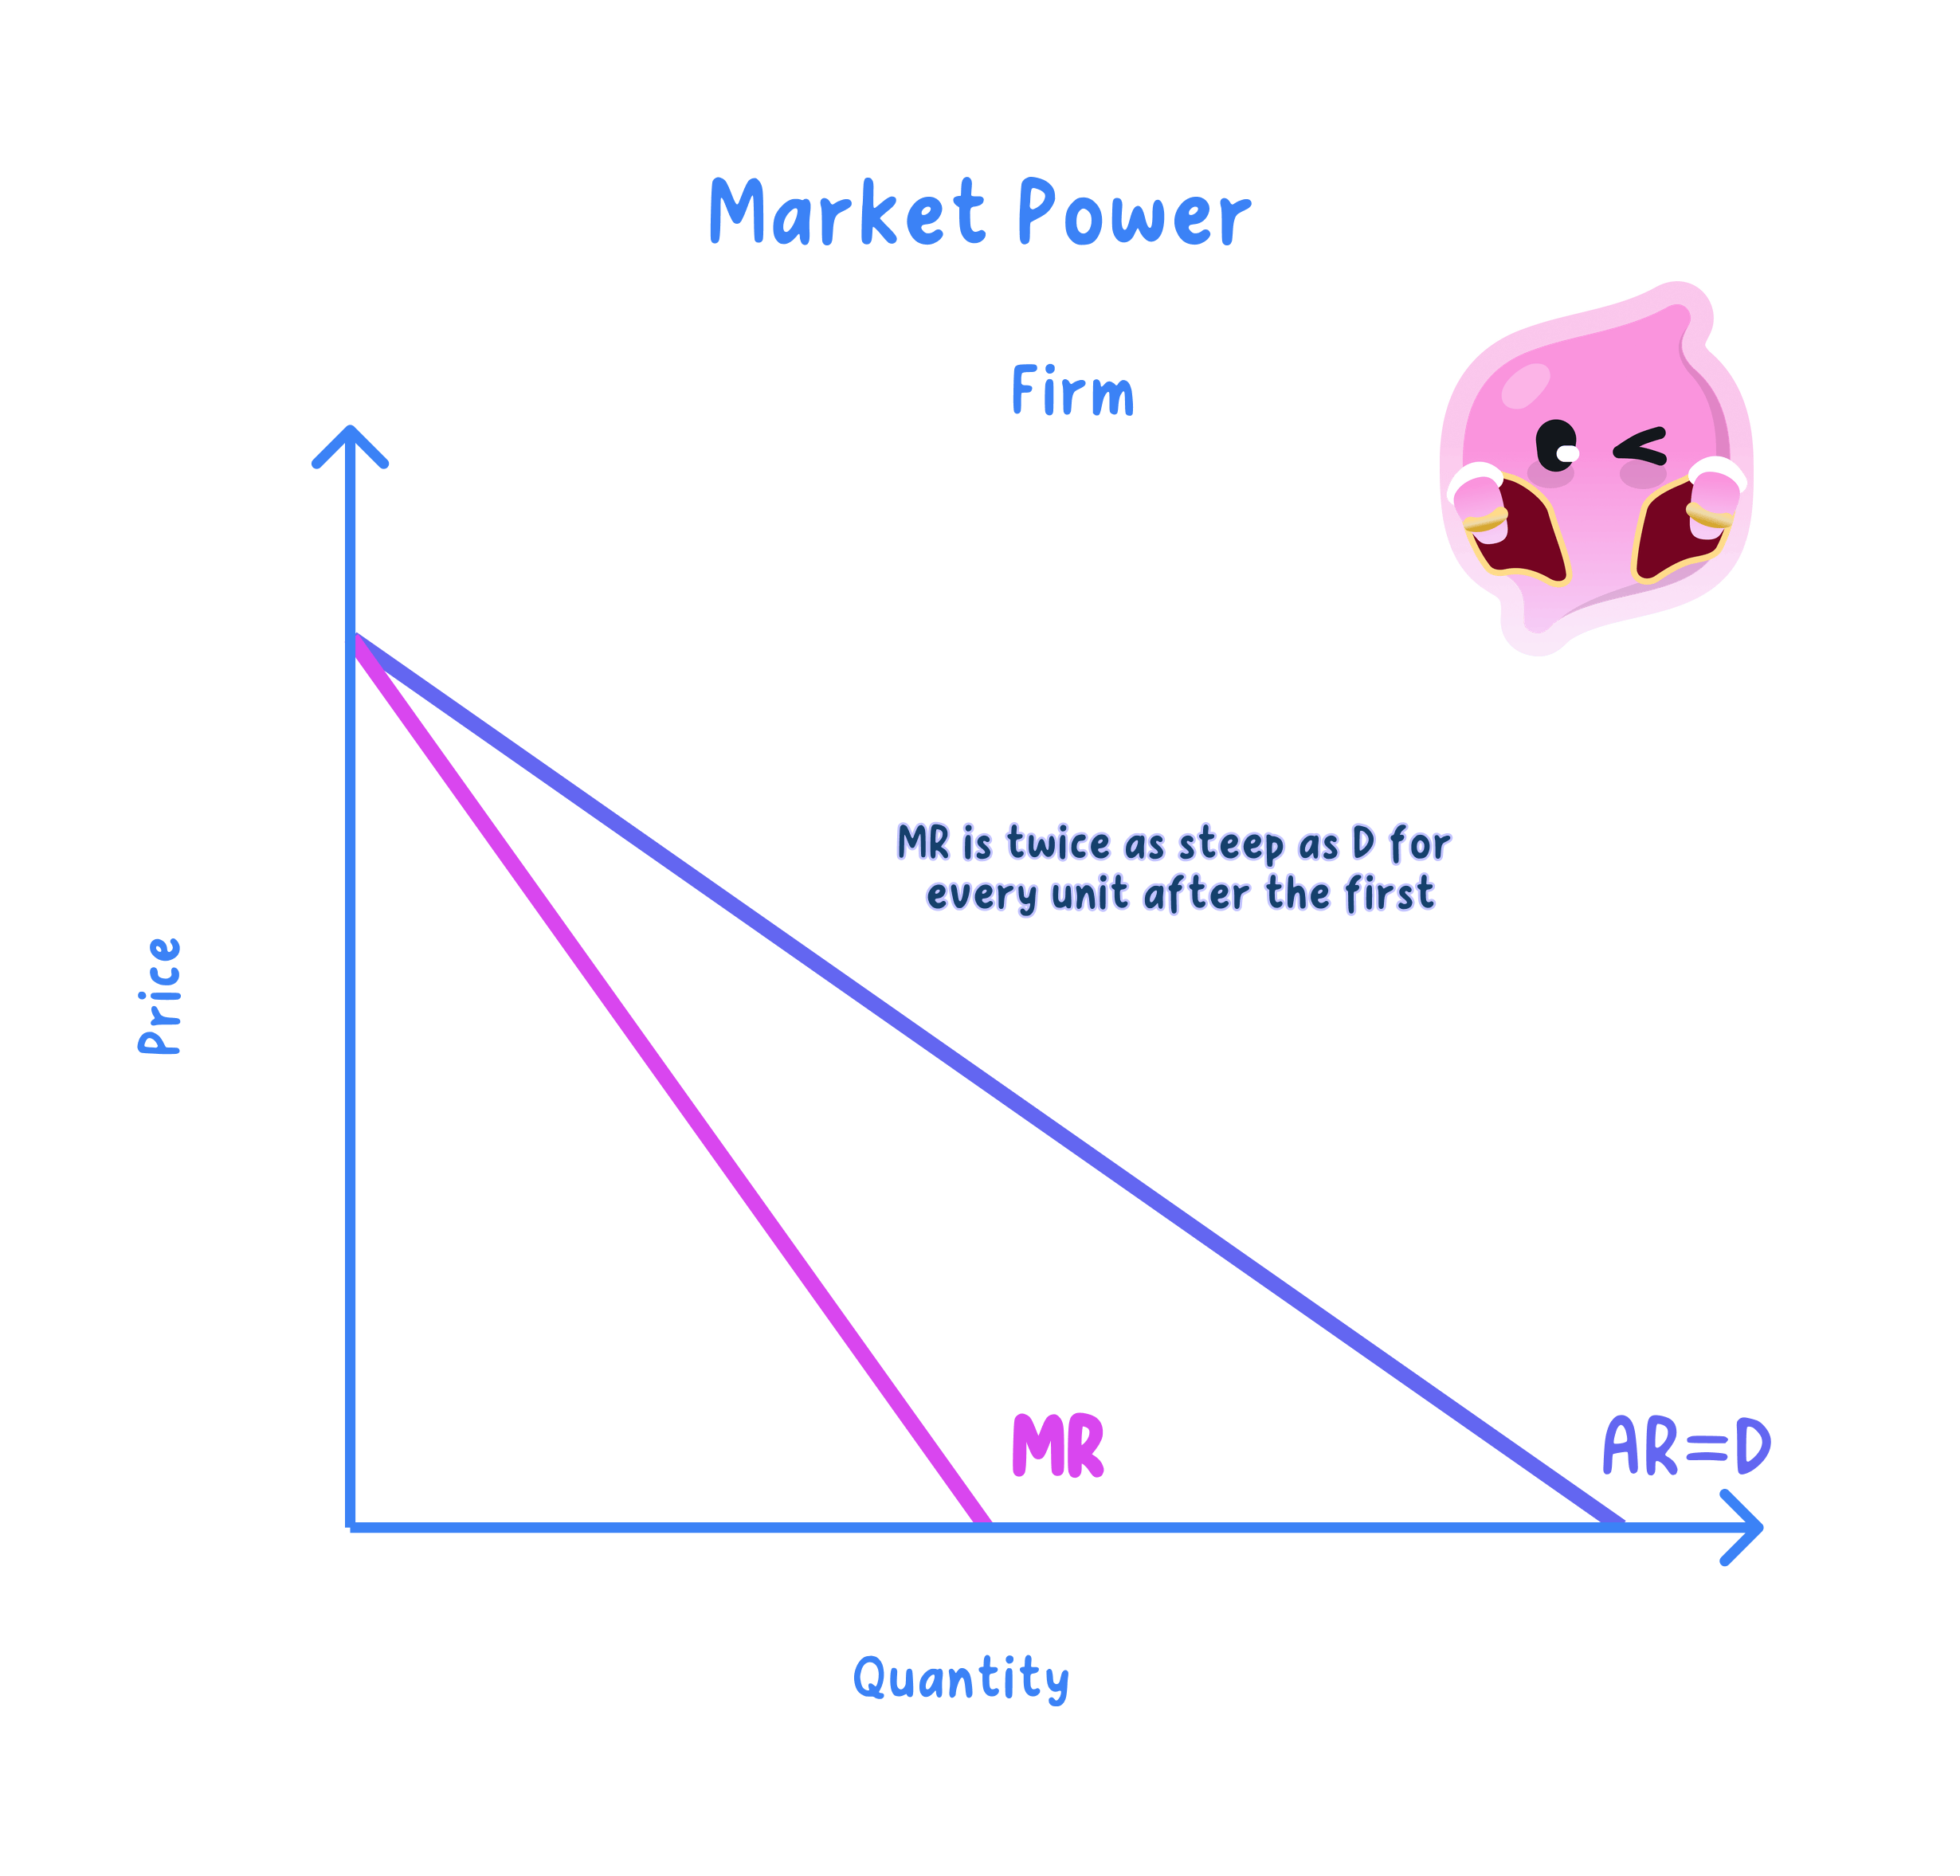
- Average revenue (AR) is total revenue divided by quantity, which equals price, so the AR curve is the demand curve.
- Marginal revenue (MR) is the change in total revenue from selling one more unit.
- For a price taker AR = MR and both are horizontal, while for a price maker MR < AR, lying below the downward-sloping AR curve.
Average revenue
AR=TRQ=P AR = \dfrac{TR}{Q} = P AR=QTR=PMarginal revenue
MR=ΔTRΔQ MR = \dfrac{\Delta TR}{\Delta Q} MR=ΔQΔTRProfit maximisation
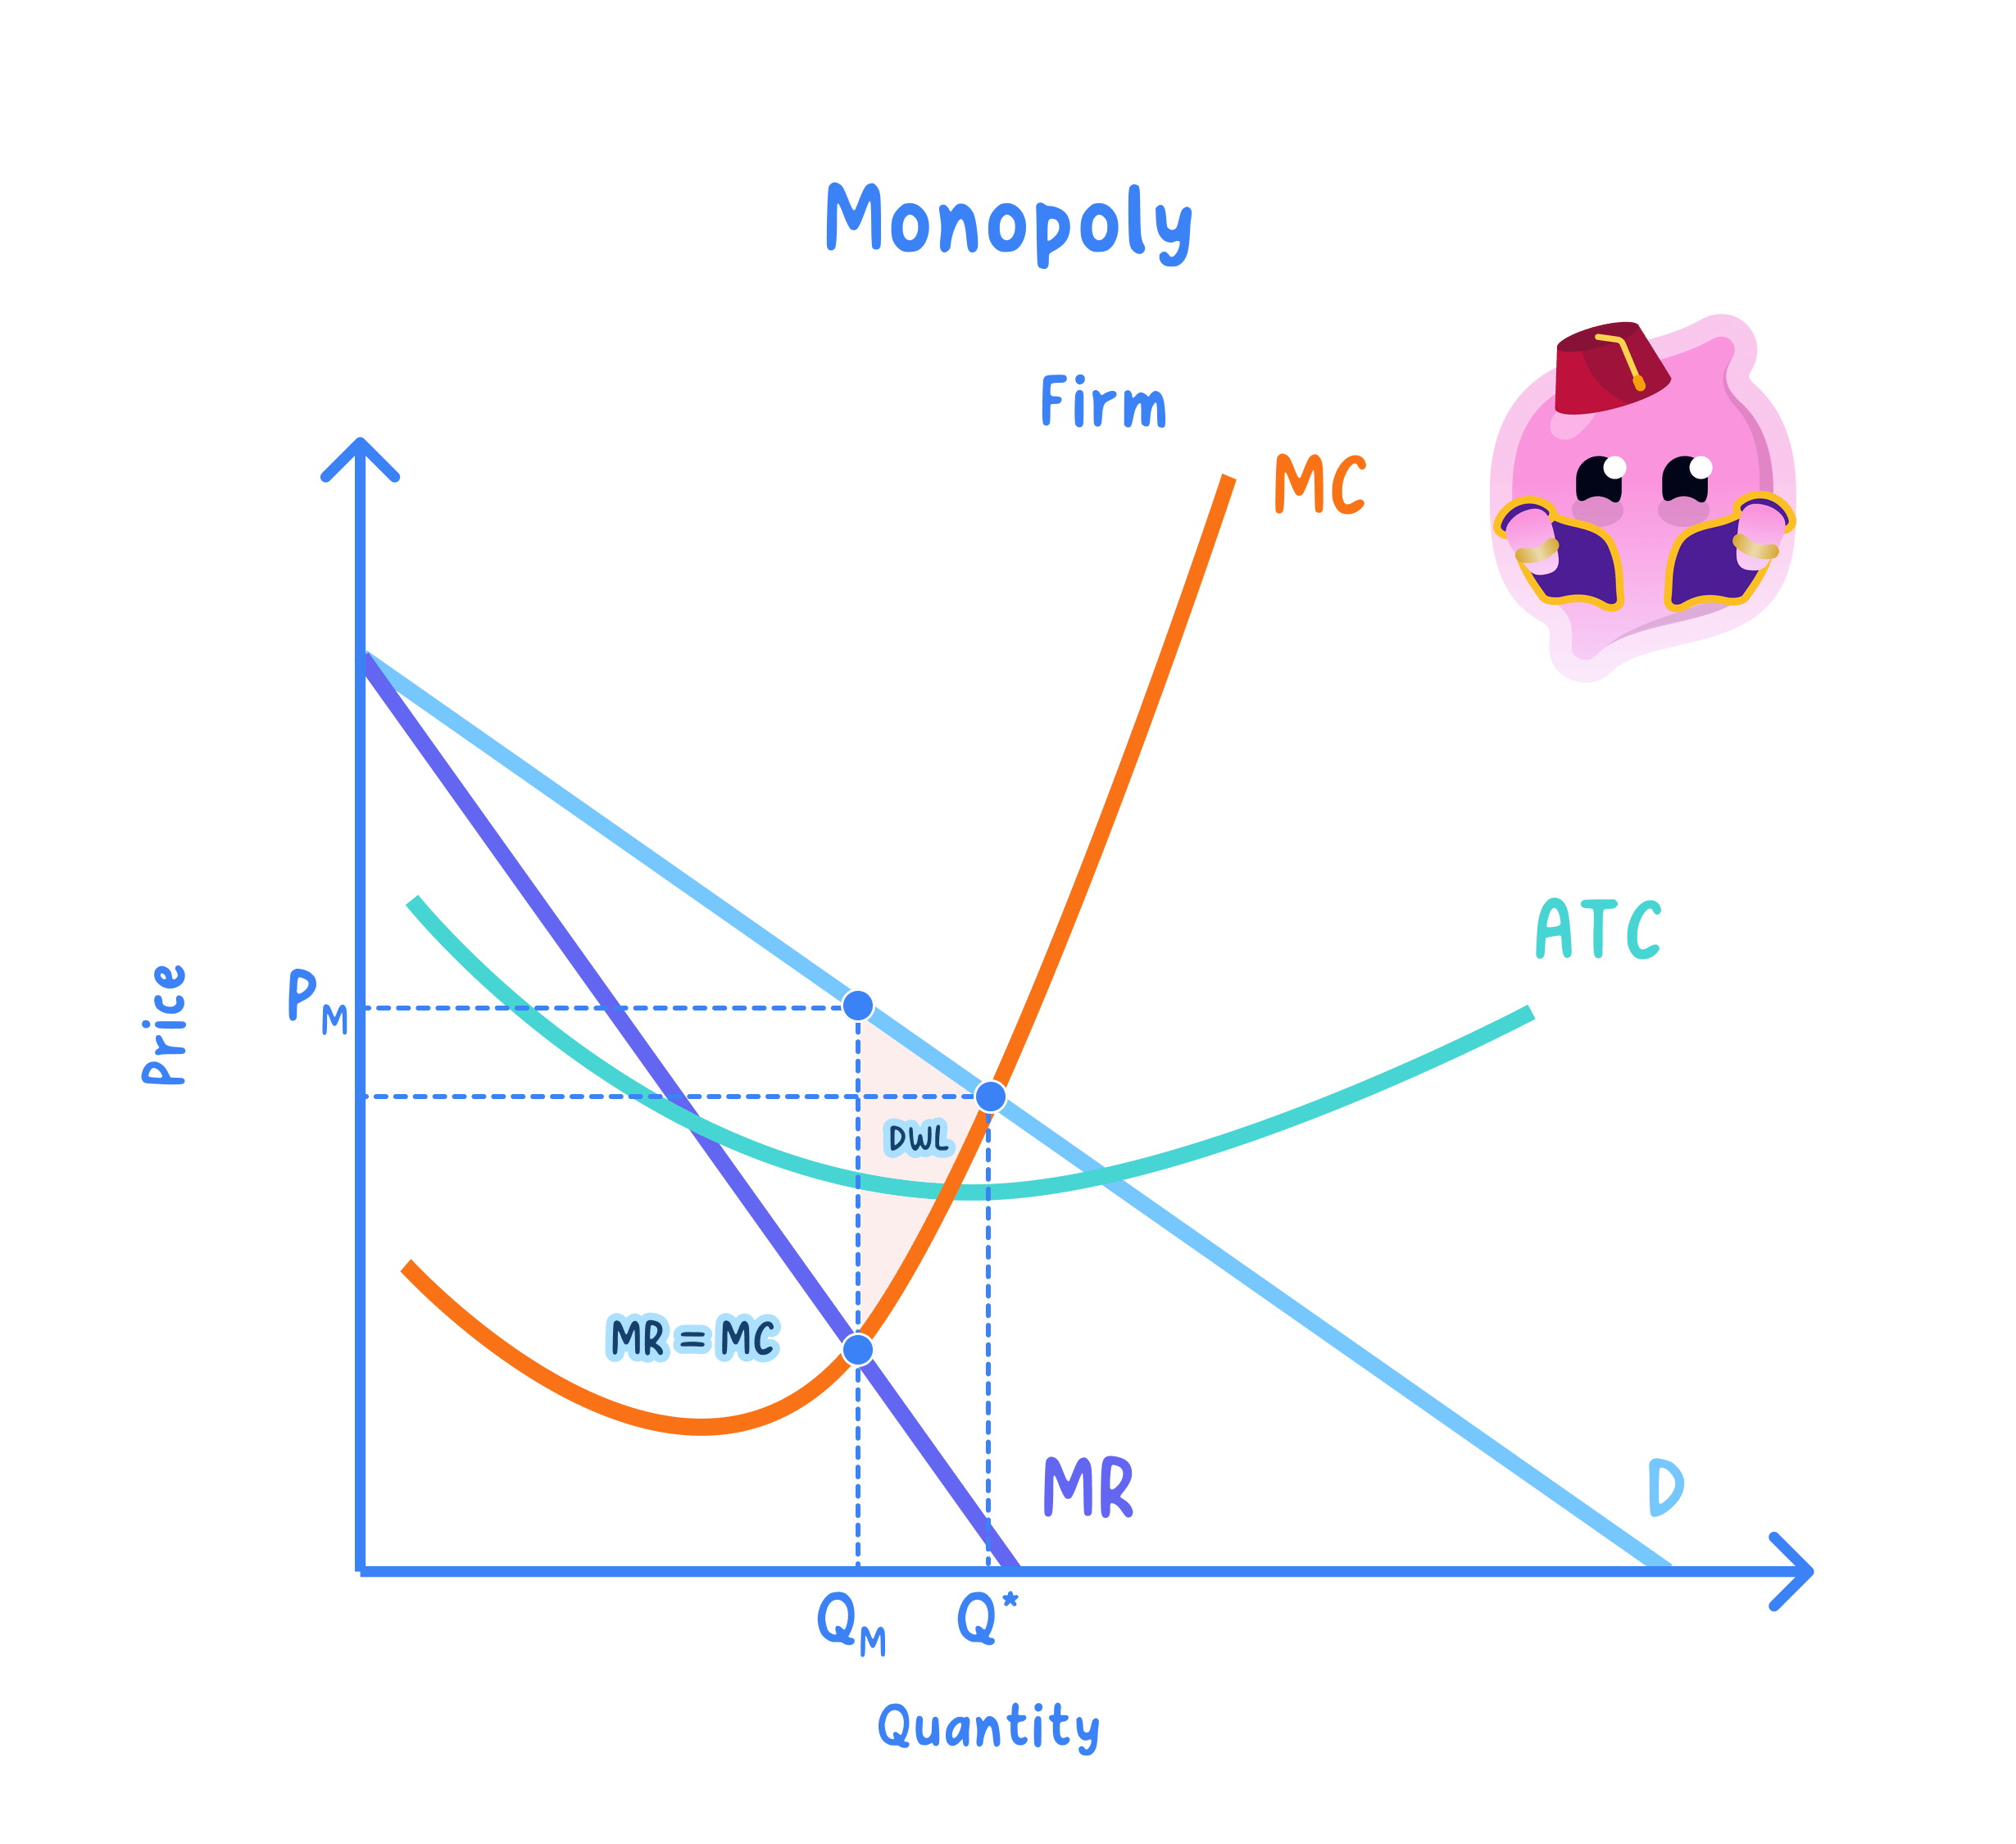
- A firm maximises profit at the output where MC = MR.
- Below that output each extra unit adds more to revenue than to cost (MR > MC), so output should rise.
- Beyond it each extra unit adds more to cost than to revenue (MC > MR), so output should fall.
Short-run and long-run profit
- In the short run a firm can earn supernormal profit, normal profit or a loss.
- It earns supernormal profit when AR > AC at the profit-maximising output.
- In competitive structures free entry competes supernormal profit away, leaving only normal profit in the long run.
- High barriers to entry let a monopoly keep supernormal profit even in the long run.
Shutdown price
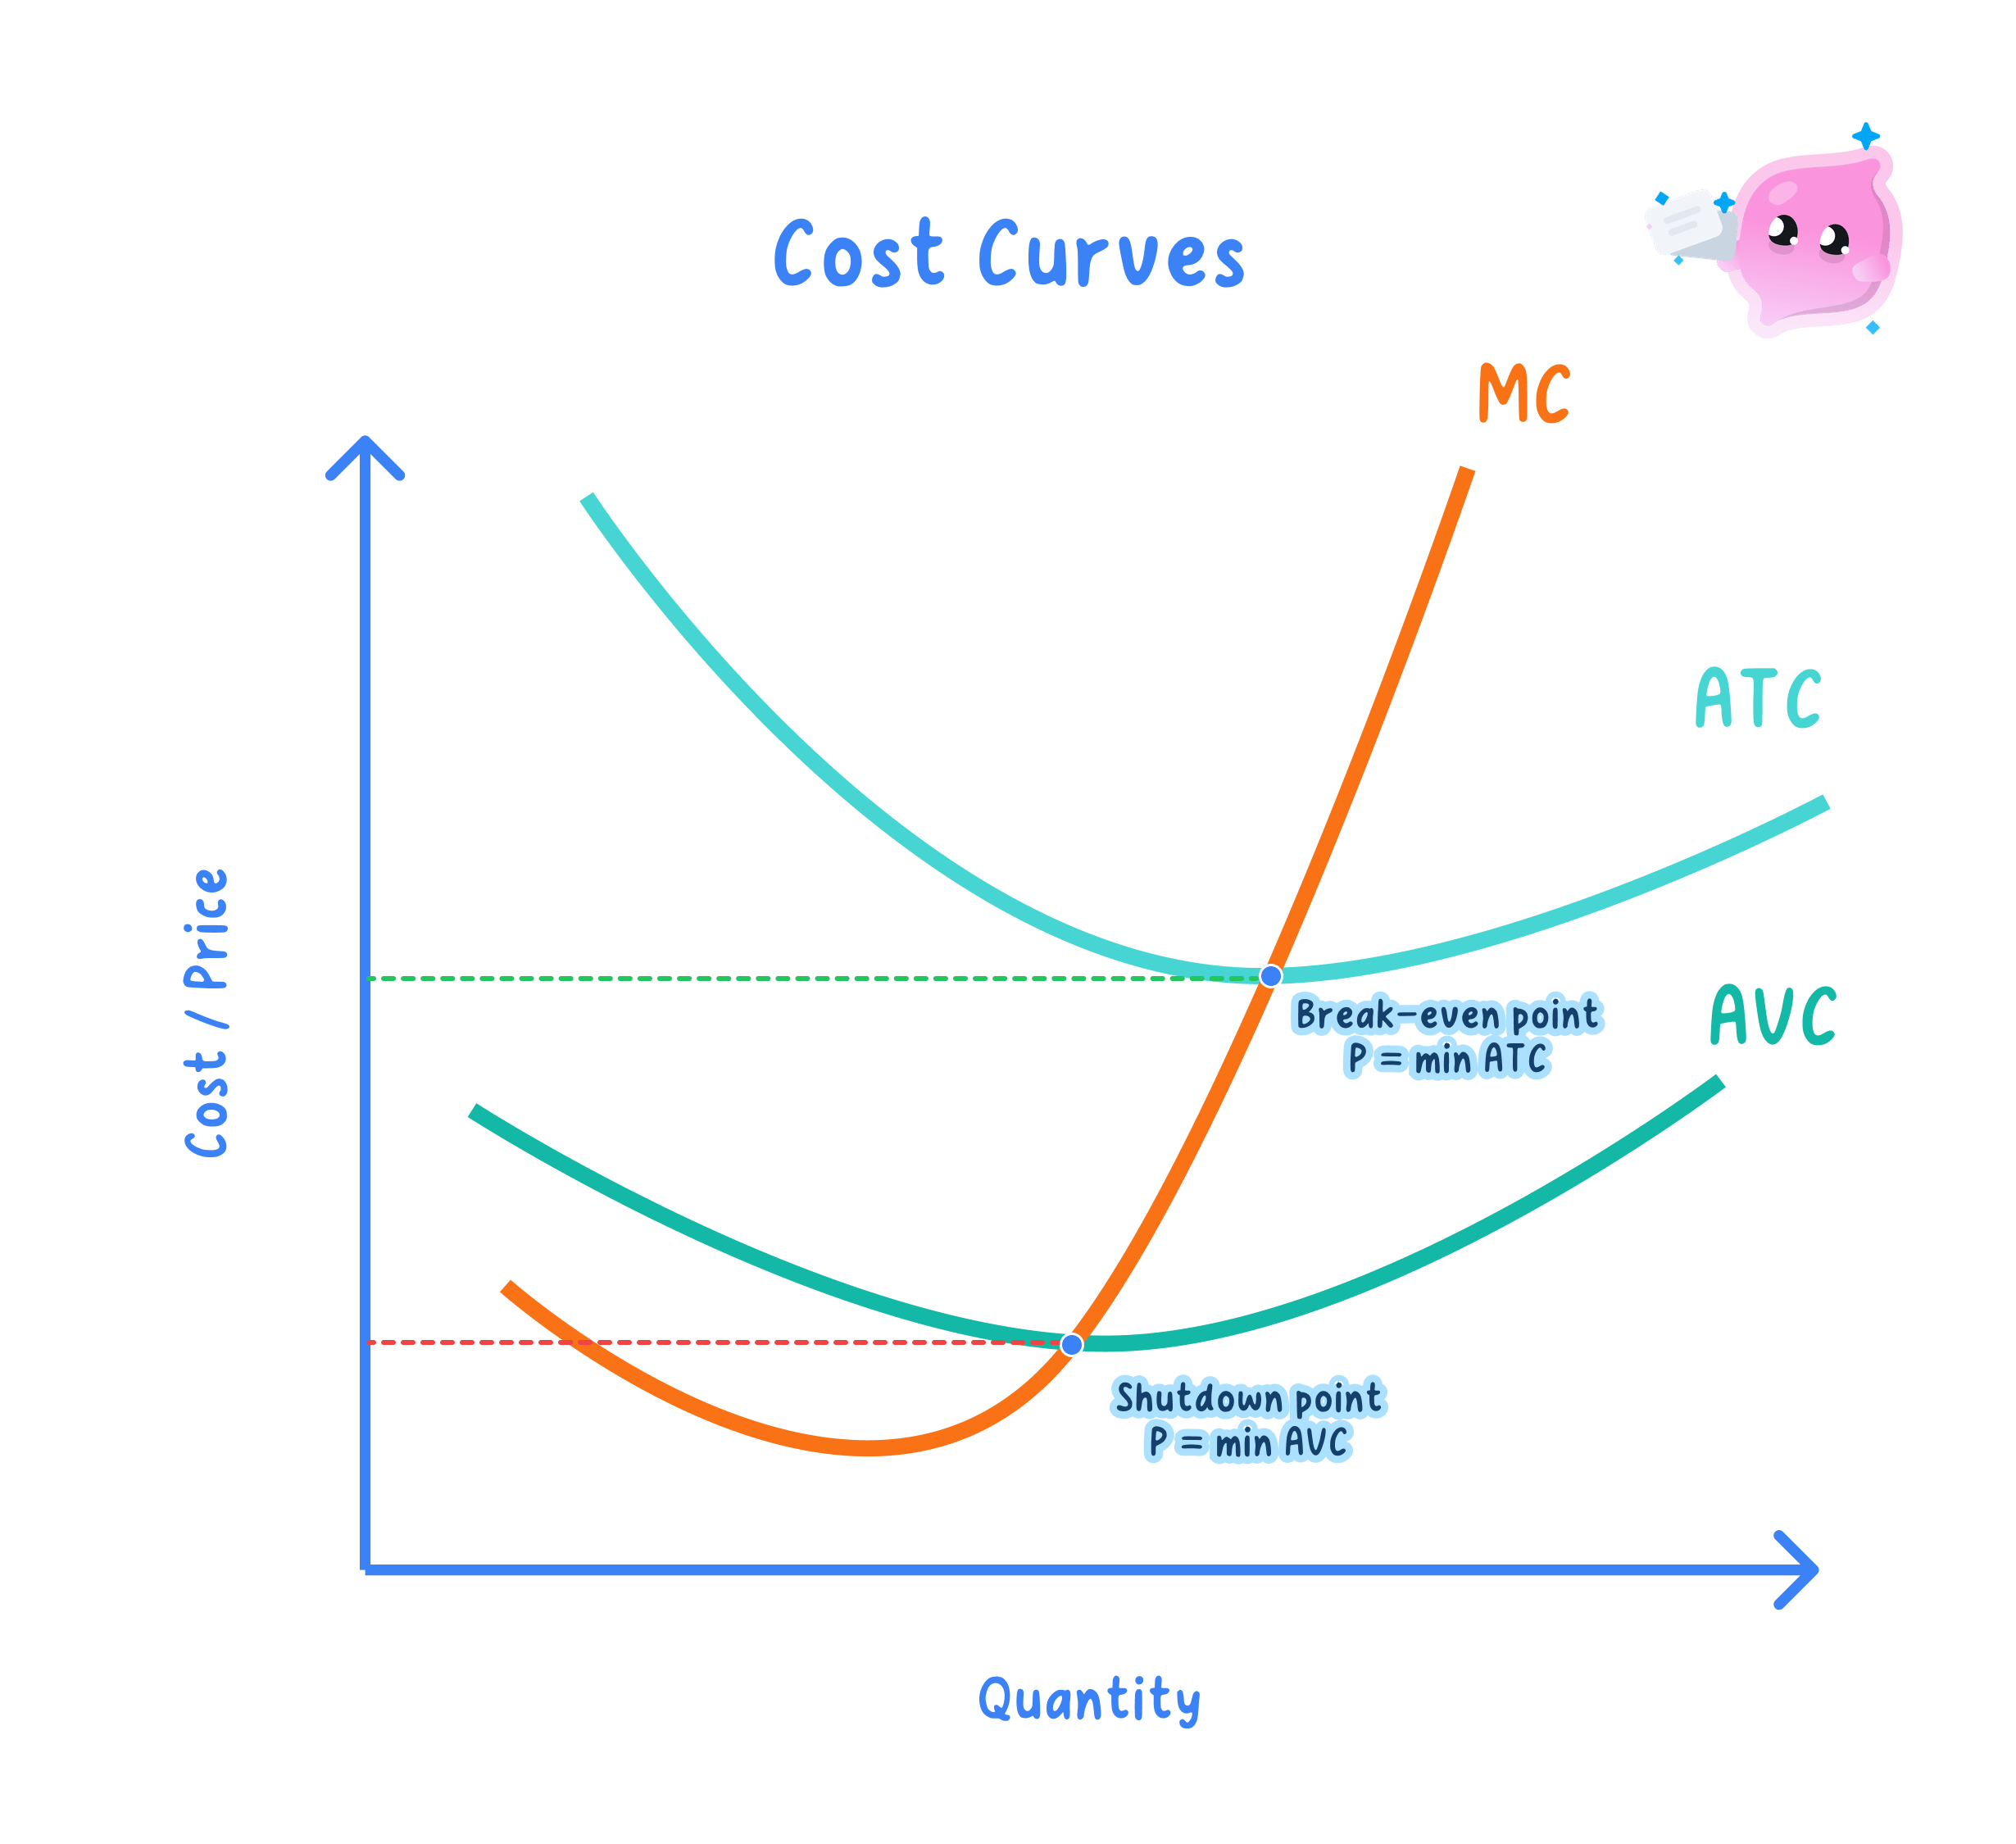
- In the short run a firm keeps producing as long as price covers average variable cost (P ≥ AVC).
- If P < AVC the firm shuts down, because producing would add to its losses.
- In the long run every cost is variable, so the firm exits if P < AC.
- So the short-run shutdown rule is P < AVC and the long-run exit rule is P < AC.
Worked example
- Average variable cost is £6 per unit and average fixed cost adds a further £4, so average cost is £10.
- At a price of £7, P > AVC, so the firm keeps producing: each unit covers its £6 variable cost and contributes £1 towards fixed costs.
- At a price of £5, P < AVC, so it shuts down in the short run: £5 fails to cover the £6 variable cost.
- At £7 it still makes a loss overall, since P < AC of £10, so in the long run it would exit.
Competitive firm's supply curve
- A price taker maximises profit where P = MC.
- So each firm's supply curve is its marginal cost curve above average variable cost.
- Below AVC the firm supplies nothing.
- Adding all firms' MC curves horizontally gives the market supply curve.
Efficiency and X-inefficiency
Allocative efficiency: achieved where price equals marginal cost (P = MC), so the value of the last unit to consumers equals its cost of production.
Productive efficiency: achieved at the lowest point of the average cost curve, where output is made at least cost.
X-inefficiency: producing at a higher cost than necessary because weak competition removes the pressure to control costs.
- Perfect competition achieves allocative efficiency because P = MC, while a monopoly does not since P > MC.
- A perfectly competitive firm also reaches productive efficiency in the long run, producing at minimum average cost.
- A monopoly usually produces where P > MC and above minimum average cost, so it is both allocatively and productively inefficient.
- Monopolies are also prone to X-inefficiency, while competitive and contestable markets curb it by threatening loss of market share.
Contestable markets
Contestable market: a market where entry and exit are cheap and easy, so the threat of new competition disciplines existing firms even when only a few actually operate.
Hit-and-run entry: entering a market to capture short-run profit and leaving cheaply once conditions worsen.
- Contestability depends on low sunk costs, since costs that cannot be recovered make quick exit risky.
- Low barriers make hit-and-run entry possible, so incumbents cannot relax.
- The implication is that even a single incumbent keeps price and profit low to deter potential entrants.
Price and non-price competition
- Price competition means winning customers by cutting price, sometimes triggering a price war.
- Non-price competition means competing through advertising, branding, quality, design and loyalty schemes.
- Oligopolists often prefer non-price competition, since price cuts are quickly matched by rivals and erode everyone's profit.
Collusion and the Prisoner's Dilemma
Collusion: a formal or tacit agreement between firms to fix price or restrict output, raising joint profit towards the monopoly level.
Dominant strategy: a choice that gives a firm its best outcome whatever its rival does.
- Because it mimics monopoly pricing, collusion is usually illegal and policed by competition authorities.
- Yet each firm has a private incentive to cheat by undercutting the agreed price to win extra sales.
- The Prisoner's Dilemma captures why this incentive makes cartels unstable.
- Two firms, A and B, each choose a high price (collude) or a price cut (cheat); each cell shows profit as (A, B) in £m.
| Profit (A, B) in £m | Firm B: high price | Firm B: cut price |
|---|---|---|
| Firm A: high price | A 50, B 50 | A 20, B 70 |
| Firm A: cut price | A 70, B 20 | A 30, B 30 |
- Whatever the rival does, each firm earns more by cutting price, so cutting price is the dominant strategy.
- Both therefore cut and earn £30m each, worse than the £50m each they would share by colluding, which is why cartels are unstable.
Is more competition always better?
- More competition usually helps consumers: perfectly competitive and contestable markets push price towards marginal cost, deliver allocative and productive efficiency, compete away supernormal profit and curb X-inefficiency, so prices are lower and firms stay lean.
- But the supernormal profit earned under monopoly can fund research and development and so raise dynamic efficiency, giving better products over time that fierce short-run competition might starve of investment.
- Where economies of scale are large a natural monopoly can supply the whole market at a lower average cost than many small firms could, so more competition might raise costs and prices rather than lower them.
- On balance, more competition is better when it lowers price without sacrificing scale or innovation, but it depends on the size of economies of scale, how much supernormal profit is reinvested, and how contestable the market is, since even one firm behaves competitively when entry is easy.
- Always identify the profit-maximising output using MC = MR before judging profit or efficiency.
- In a Prisoner's Dilemma, check each firm's best response to show cutting price is the dominant strategy.
- Do not confuse the short-run shutdown rule (P < AVC) with the long-run exit rule (P < AC).
- Remember that normal profit is a cost, so a firm earning only normal profit is still worth running.
- Why does marginal revenue lie below average revenue for a price maker?
- State the profit-maximising rule and the short-run shutdown rule.
- Why is a competitive firm's supply curve its marginal cost curve above average variable cost?
- How does the threat of entry make a contestable market behave competitively?
- Using the payoff matrix, explain why the two firms fail to sustain collusion.
