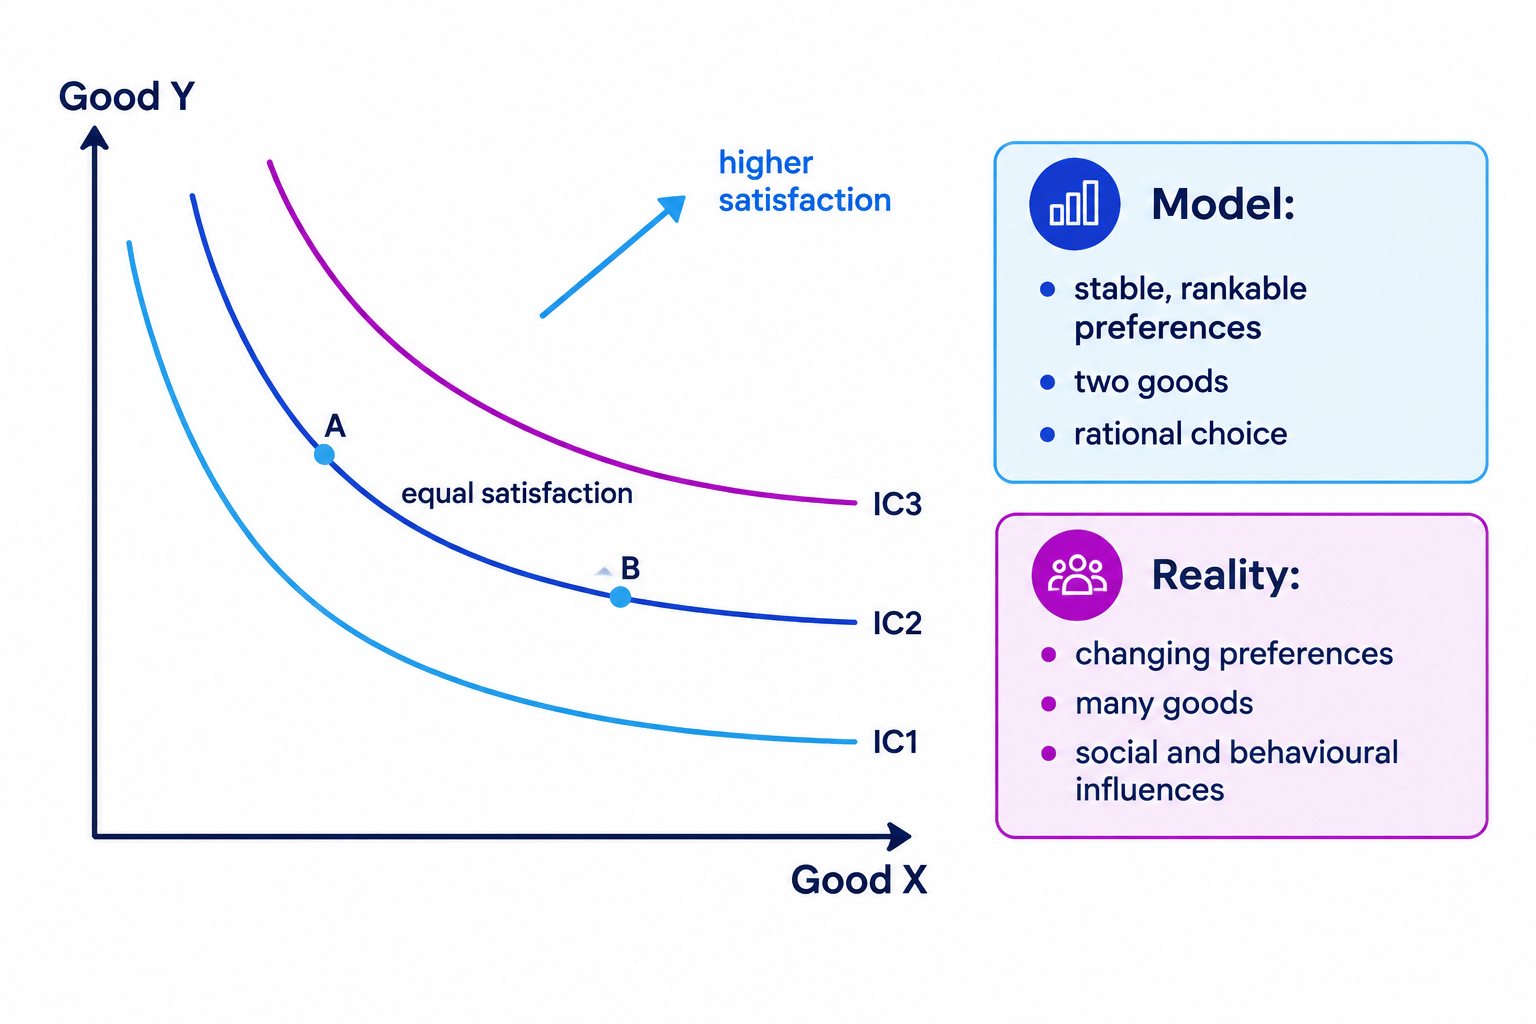
Limitations of the model
Definition
Indifference curve: a line joining every combination of two goods that gives a consumer equal total satisfaction, so the consumer is indifferent between them.
- The indifference curve model rests on several strong assumptions about consumer behaviour.
- Those assumptions are useful for analysis but often unrealistic.
- A balanced view weighs the model's explanatory power against its unrealistic assumptions.
Key Idea
- The model assumes preferences can be ranked consistently and mapped as curves.
- It assumes rational, satisfaction-maximising choice between just two goods.
- It is a useful simplification rather than a full description of real choice.
Key assumptions
- It assumes preferences are complete and consistent, so the consumer can rank every possible bundle.
- It assumes consumers behave rationally to maximise their satisfaction.
- It simplifies the world to a choice between just two goods.
- It assumes each consumer's preferences are independent of other people's choices.
Example
- A shopper is assumed to be able to rank every conceivable combination of two goods.
- They are assumed to choose the ranked best bundle they can afford.
- The real world of many goods and changing tastes is set aside.
Where it falls short
- Real consumers cannot rank every conceivable combination, so indifference curves cannot be observed directly.
- Preferences may be inconsistent or change over time with mood, habit and advertising.
- Behavioural economics shows people use rules of thumb and are swayed by framing, so they do not always choose rationally.
- Most real decisions involve many goods and services, not only two.
- Preferences may depend on other people's choices, for example through herding or conspicuous consumption.
Example
- A shopper cannot map an exact indifference curve in their head.
- Their choices may shift with mood, habit or a persuasive advert.
- So the neat diagram is a simplification of real behaviour.
Why it still helps
Definition
Ordinal utility: utility expressed only as a ranking of bundles from best to worst, without stating by how much one is preferred.
Cardinal utility: utility measured in numerical units, so differences in satisfaction can be quantified and compared.
- It gives a clear, logical account of how a consumer reaches an optimum.
- It cleanly separates the substitution and income effects of a price change.
- It explains normal, inferior and Giffen goods and why demand usually slopes downward.
- It needs only an ordinal ranking of preferences, not a cardinal measure of utility, which is a weaker and more defensible assumption.
Example
- The model shows why demand usually slopes downward.
- It explains the special cases of inferior and Giffen goods.
- But it does not capture habit, limited information or social influence.
A balanced judgement
- In its favour, the model is logical and explains key results from a small set of assumptions.
- Against it, mapping preferences and assuming full rationality are unrealistic.
- The two-good limit is restrictive when the model is applied to real markets.
- On balance it is a useful simplification rather than a full description of real choice, so its value depends on the question being asked.
Exam technique
- Set out the model's key assumptions before criticising it.
- Weigh its explanatory power against its unrealistic assumptions.
- Reach a supported judgement rather than only drawing diagrams.
Common Mistake
- Do not learn the diagrams mechanically without understanding the assumptions.
- Be ready to discuss why the model may not describe real choices well.
Self review
- Name three assumptions of the model.
- Why are real preferences hard to map?
- Why is the two-good limit restrictive?
- What does the model still explain well?
- What is a balanced judgement of its usefulness?