Individual and market
- Individual demand is the quantity a single buyer is willing and able to purchase at each price.
- Individual supply is the quantity a single firm is willing and able to offer for sale at each price.
- Each market curve is built from these individual curves, because the market is simply all its participants added together: the market demand for coffee in a city is every household's cup added up.
Key Idea
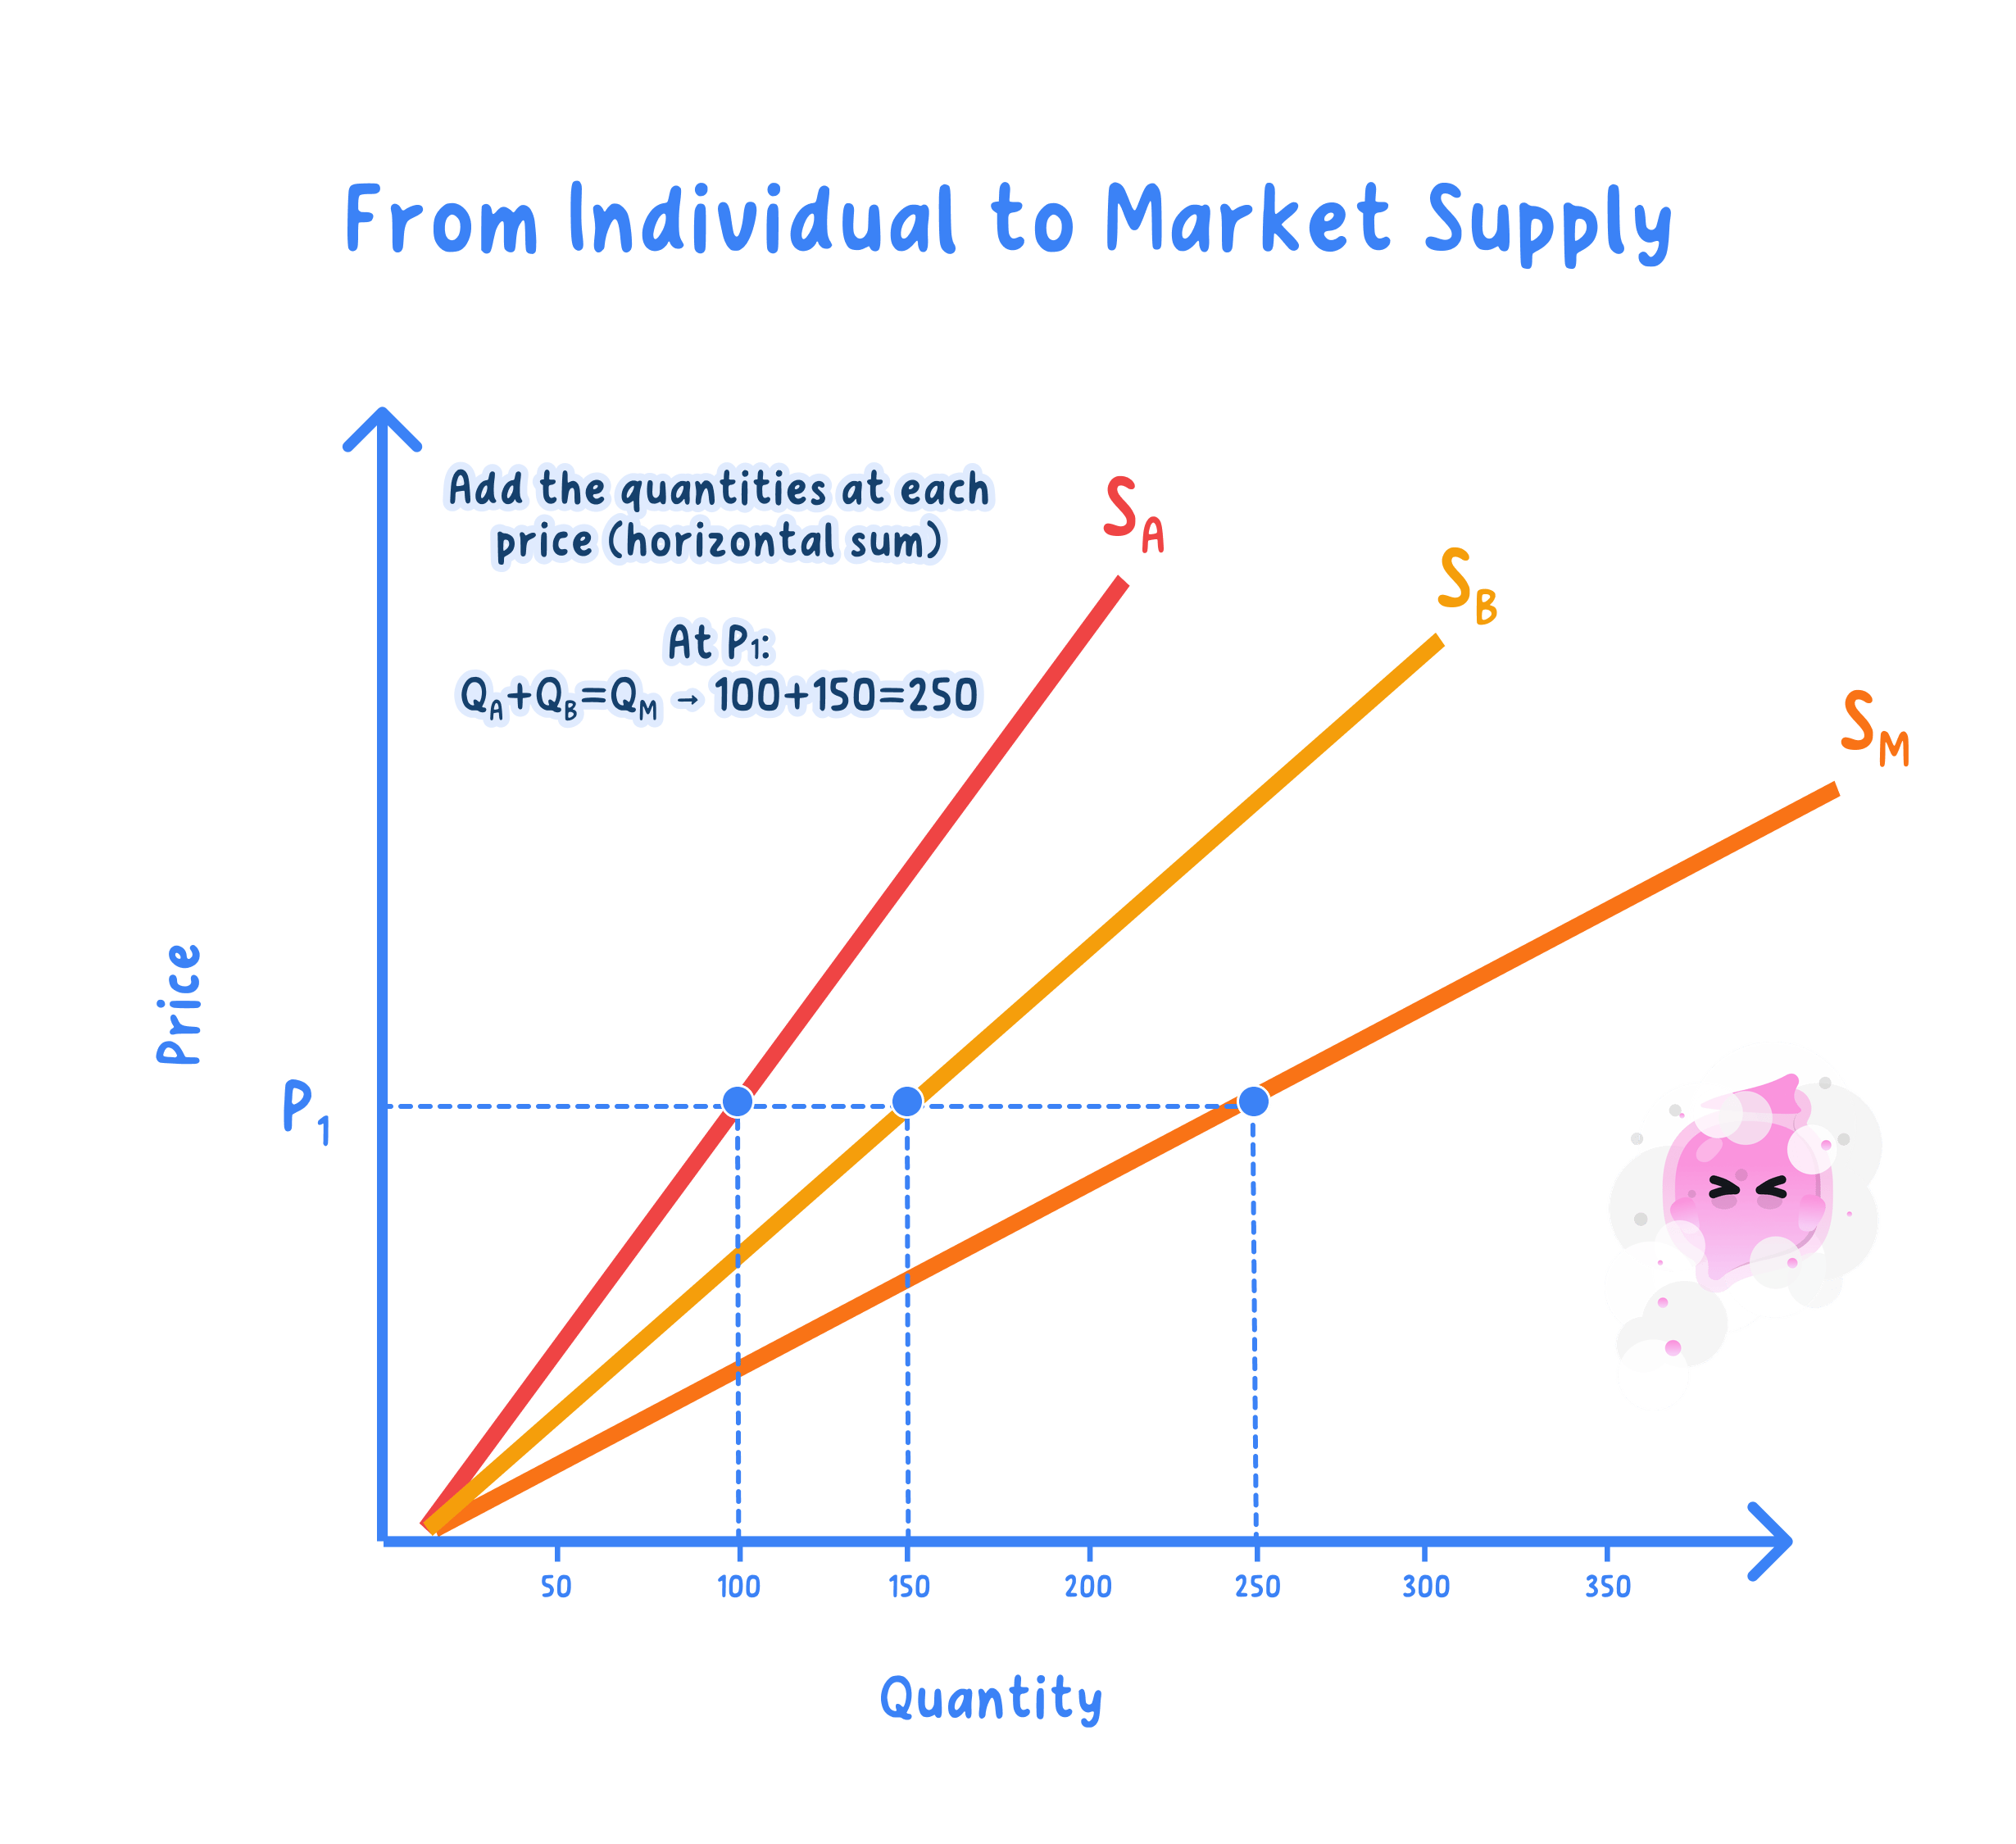
- A market curve is the horizontal sum of the individual curves.
- At each price you add the quantities every participant chooses, never the prices.
Market demand
Definition
Market demand: the sum across all buyers of the quantities each is willing and able to purchase at every price.
QD=∑i=1nqi Q_{D}=\sum_{i=1}^{n} q_{i} QD=i=1∑nqi- Pick a single price and read off the quantity each buyer demands at that price.
- Add those quantities together to get the market quantity demanded at that price.
- Repeat at every price to trace out the whole market demand curve.
- The market curve slopes downward because each individual curve does: as price falls each buyer wants more, so the summed quantity rises too. It lies further right than any single curve because it stacks many buyers side by side at every price.

Example
- At £5, buyer A demands 10 units and buyer B demands 15 units, giving market demand of 10 + 15 = 25 units.
- At £3, buyer A demands 18 units and buyer B demands 22 units, giving market demand of 18 + 22 = 40 units.
- The prices are never added; only the quantities at each price are summed.
Market supply
Definition
Market supply: the sum across all firms of the quantities each is willing and able to offer for sale at every price.
QS=∑i=1nqi Q_{S}=\sum_{i=1}^{n} q_{i} QS=i=1∑nqi- Build it the same way, adding each firm's quantity supplied at every price.
- The market supply curve slopes upward because each firm's curve does: a higher price makes extra output profitable, so every firm offers more and the summed quantity rises.
- The more firms that supply the market, the further right the market supply curve reaches, since more sellers add their output at every price.
Example
- At £5, firm X offers 30 units and firm Y offers 20 units, giving market supply of 30 + 20 = 50 units.
- At £8, firm X offers 45 units and firm Y offers 35 units, giving market supply of 45 + 35 = 80 units.
- Again the quantities are added at each price, not the prices themselves.
Why it matters
- It is the market curves, not any single buyer or firm, that set the equilibrium price and quantity for the whole market, because equilibrium is where total quantity demanded equals total quantity supplied.
- A single buyer or firm is usually too small a share of the total to move the market price on its own, so only the aggregate matters; the exception is a dominant seller large enough to shift the whole supply curve.
Exam technique
- Add quantities horizontally at each given price, never prices vertically.
- State clearly whether you mean a single buyer or firm, or the whole market.
- Remember the market curve keeps the same slope direction as the individual curves.
Common Mistake
- Do not add prices when aggregating; adding prices instead of quantities distorts the whole analysis.
- Do not confuse individual demand with market demand; the market curve lies further right than any single curve.
Self review
- What is the difference between individual and market demand?
- How is a market supply curve derived from individual firms' curves?
- Do you add quantities or prices when summing to the market curve?
- If at £4 three buyers demand 5, 8 and 12 units, what is market demand?
- Why is a single buyer usually unable to change the market price?
