Definition
Effective demand: the quantity of a good buyers are willing and able to purchase at each price, backed by actual purchasing power rather than desire alone.
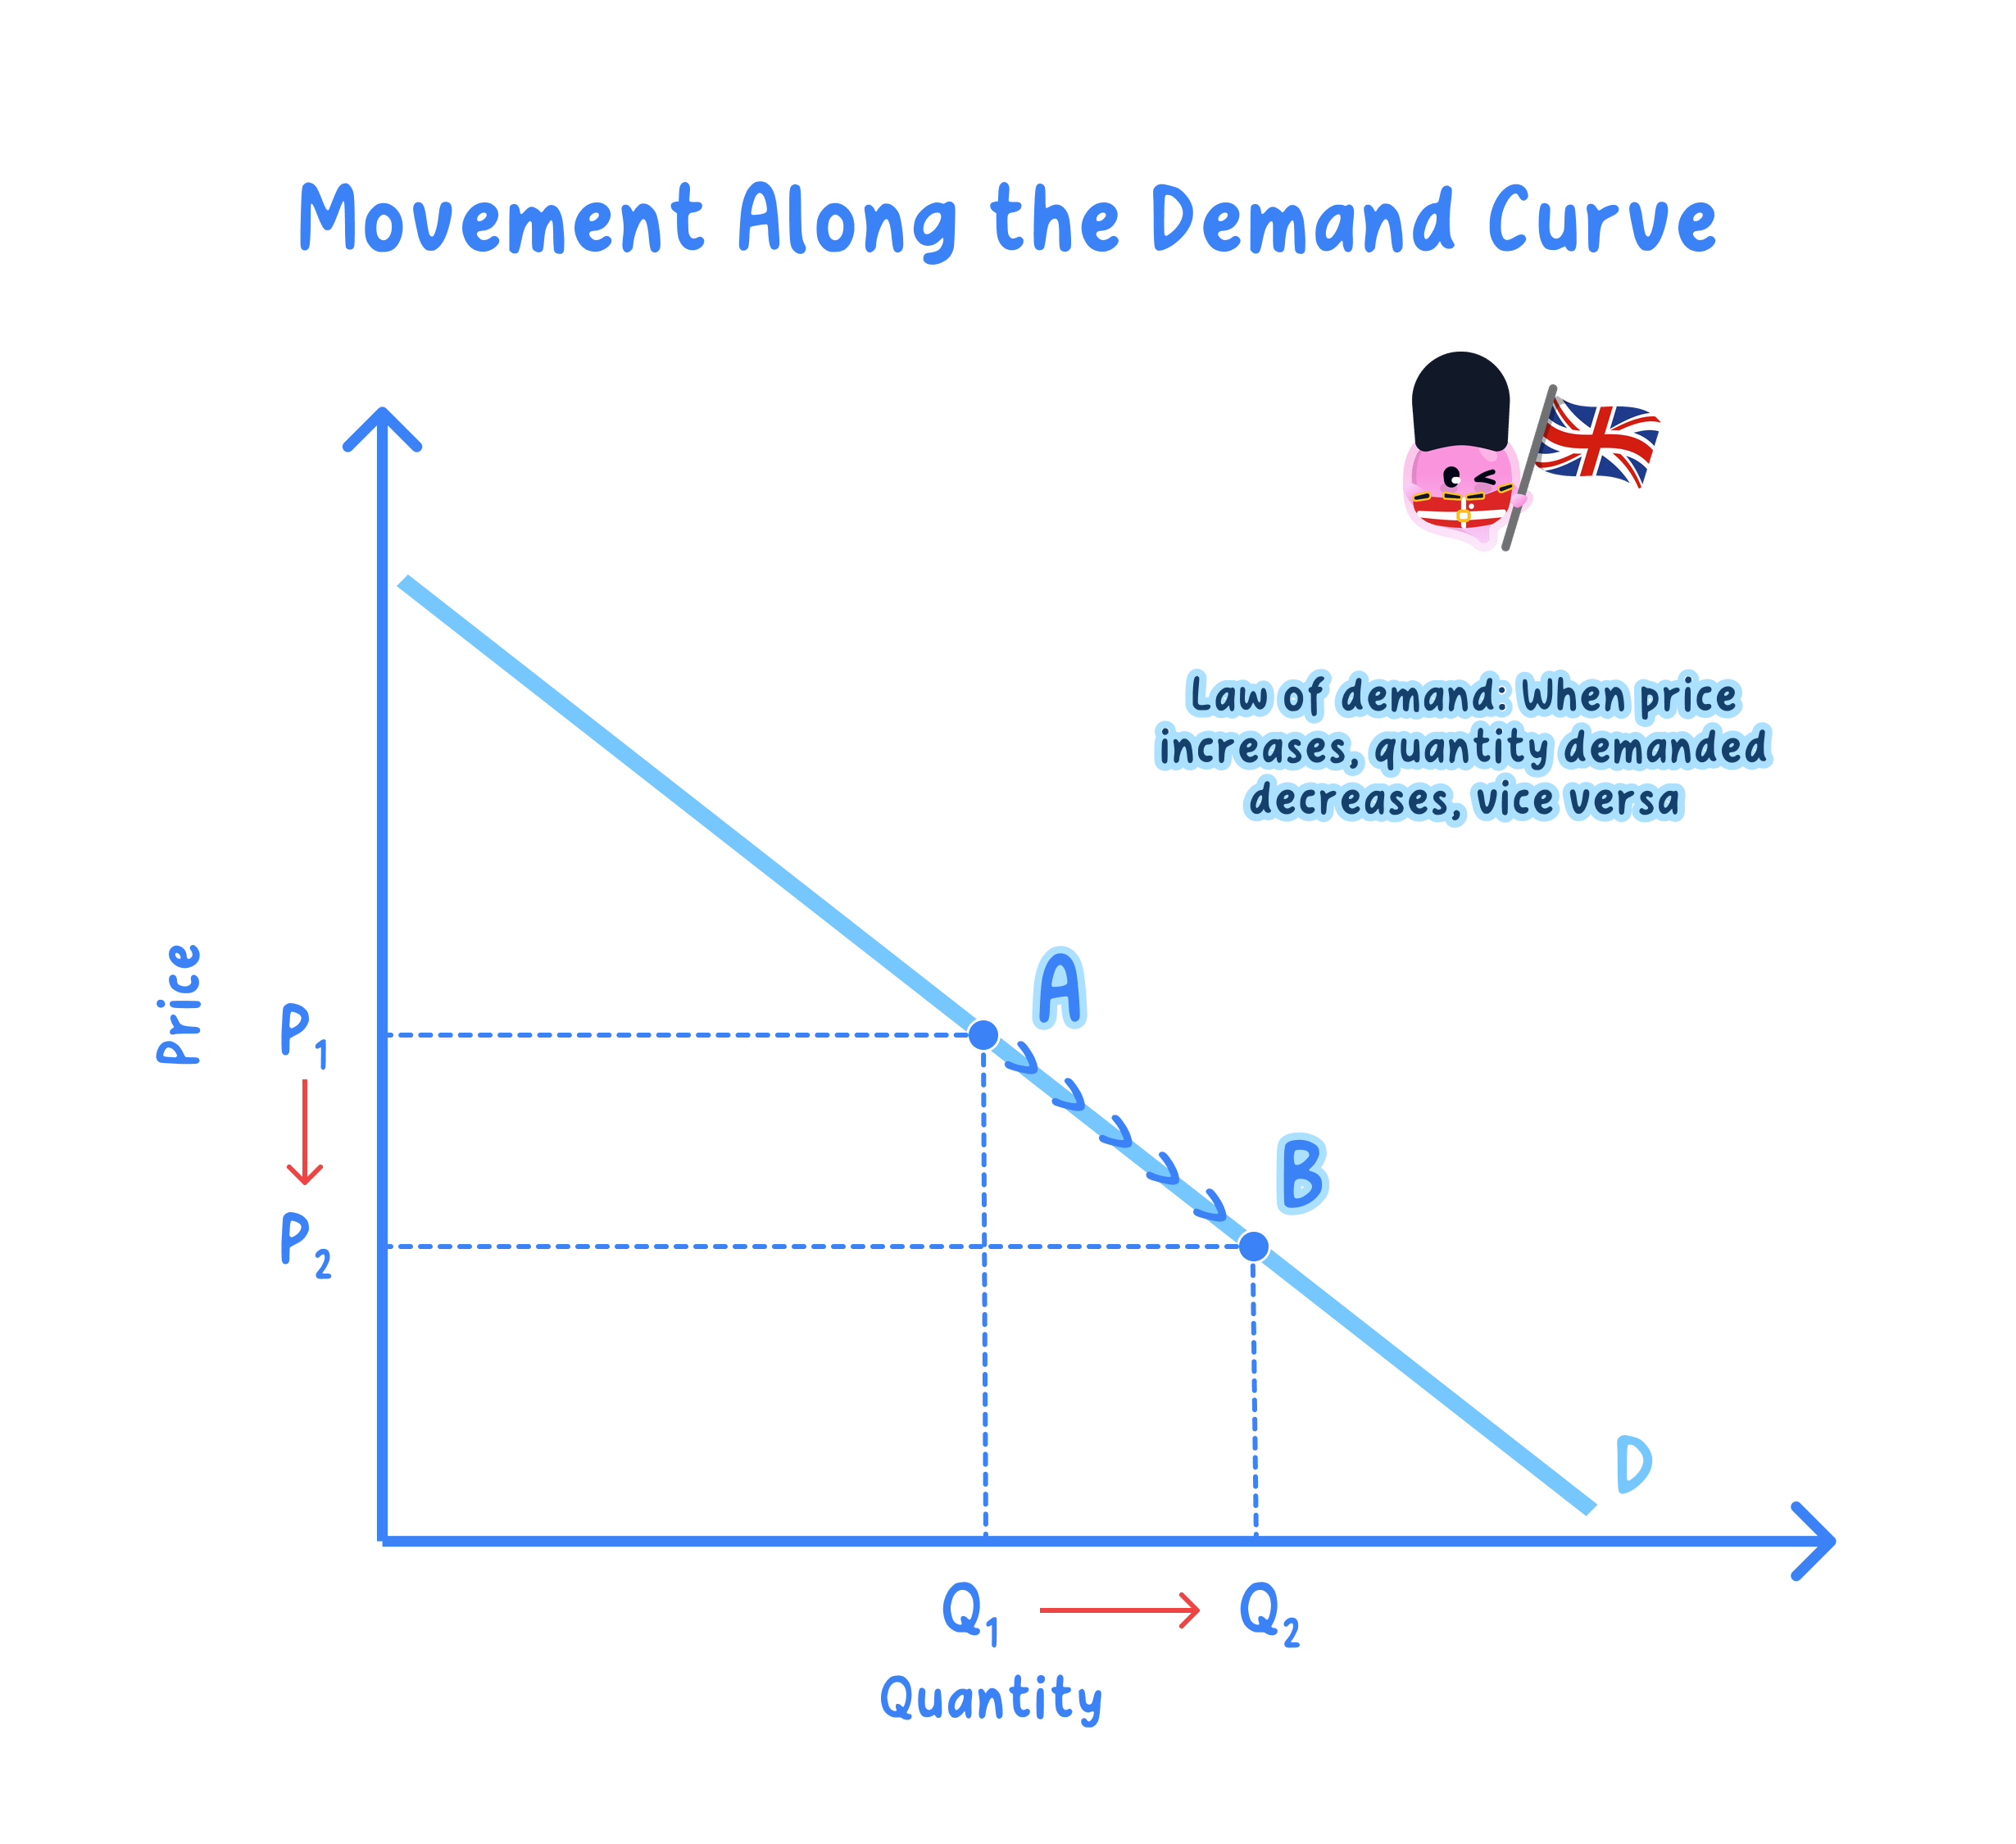
- The law of demand states that, ceteris paribus, a rise in a good's own price reduces the quantity demanded and a fall raises it.
- This gives an inverse relationship between price and quantity demanded, because a higher price prices some buyers out while a lower price draws more in.
- Plotting price on the vertical axis and quantity on the horizontal axis therefore traces a demand curve (D) that slopes downward from left to right.
Key Idea
- Demand in economics always means effective demand: willingness plus ability to pay, never desire alone.
- A change in the good's own price moves the buyer along the curve; it does not shift the curve.
Why the curve slopes down
- Income effect
- A fall in the price raises the buyer's real income, so the same money buys more and the quantity demanded rises.
- Substitution effect
- A fall in the price makes the good cheaper relative to its substitutes, so buyers switch towards it and quantity demanded rises.
- Diminishing marginal utility
- Each extra unit yields less added satisfaction, so buyers will only take more units when the price is lower.
Example
- At £5 a smoothie a typical buyer purchases 4 smoothies a week.
- When the price falls to £3 the same buyer purchases 7 smoothies a week.
- The income effect applies because the lower price leaves the buyer with more real spending power.
- The substitution effect applies because smoothies are now cheap relative to bottled juice, so the buyer switches towards them.
- Both effects push quantity demanded up as price falls, tracing out the downward-sloping curve.
Reading the curve
- Each point on the curve shows the quantity demanded at one particular price, holding all other conditions constant.
- A change in the good's own price moves the buyer up or down the same curve, which is a change in quantity demanded.
- A change in a condition of demand, such as income or tastes, shifts the whole curve instead, as covered fully in 2.1.5 and 2.1.7.
Note
- Individual demand is one buyer's demand; market demand is the horizontal sum of the quantity all buyers demand at each price.
- Aggregating individual curves to a market curve is developed in 2.1.2.
Does it always hold?
- For the vast majority of goods the inverse relationship holds strongly, so the downward-sloping curve is the standard model.
- A few goods break the pattern, notably Veblen goods and Giffen goods, whose quantity demanded can rise as price rises.
- A Veblen good, such as a Birkin handbag or a luxury Swiss watch, is bought partly to signal wealth, so a higher price makes it a stronger status symbol and can raise quantity demanded.
- A Giffen good, such as a cheap staple like rice for a very low-income household, is one where a price rise cuts real income so severely that the household buys even more of the staple and less of pricier foods.
- Both cases need special conditions and are rare, so for 9708 you assume the law of demand unless a good is clearly one of these.
Exam technique
- Justify the downward slope with the income effect, the substitution effect and diminishing marginal utility.
- Label the axes price and quantity demanded, and label the curve D.
- Treat a change in the good's own price as a movement along the curve, never a shift.
Common Mistake
- Do not define demand as mere desire; without willingness and ability to pay there is no effective demand.
- Do not treat a change in the good's own price as shifting the curve; it is a change in quantity demanded.
Self review
- Define effective demand in one sentence.
- State the law of demand.
- Give the three reasons the demand curve slopes downward.
- Explain why a Veblen good can break the law of demand.
- Explain why a Giffen good can break the law of demand.
