Deadweight welfare loss
Definition
Deadweight welfare loss: the net social benefit lost when the free market produces where marginal private cost equals marginal private benefit (MPC = MPB) instead of at the social optimum where marginal social cost equals marginal social benefit (MSC = MSB).
Social optimum and market
- The social optimum is the allocatively efficient output where marginal social benefit equals marginal social cost (MSB = MSC).
- At this output net social welfare is maximised, because every unit whose benefit to society exceeds its cost to society has been produced.
- Producing one more unit would add more to social cost than to social benefit, while producing one fewer would forgo a unit worth more than it costs.
- The free market instead settles where marginal private cost equals marginal private benefit (MPC = MPB), the point that maximises private rather than social welfare.
- Whenever an externality exists the private optimum diverges from the social optimum, so market output (Qmarket) is either above or below the optimum (Qopt).
Key Idea
- Efficiency is judged against the social optimum, MSB = MSC, not against the market outcome.
- The market ignores external costs and benefits, so it clears at MPC = MPB.
- The gap between these two outputs is what generates the welfare loss.
Meaning of the loss
- The deadweight welfare loss is the net social benefit sacrificed by producing at Qmarket rather than at Qopt.
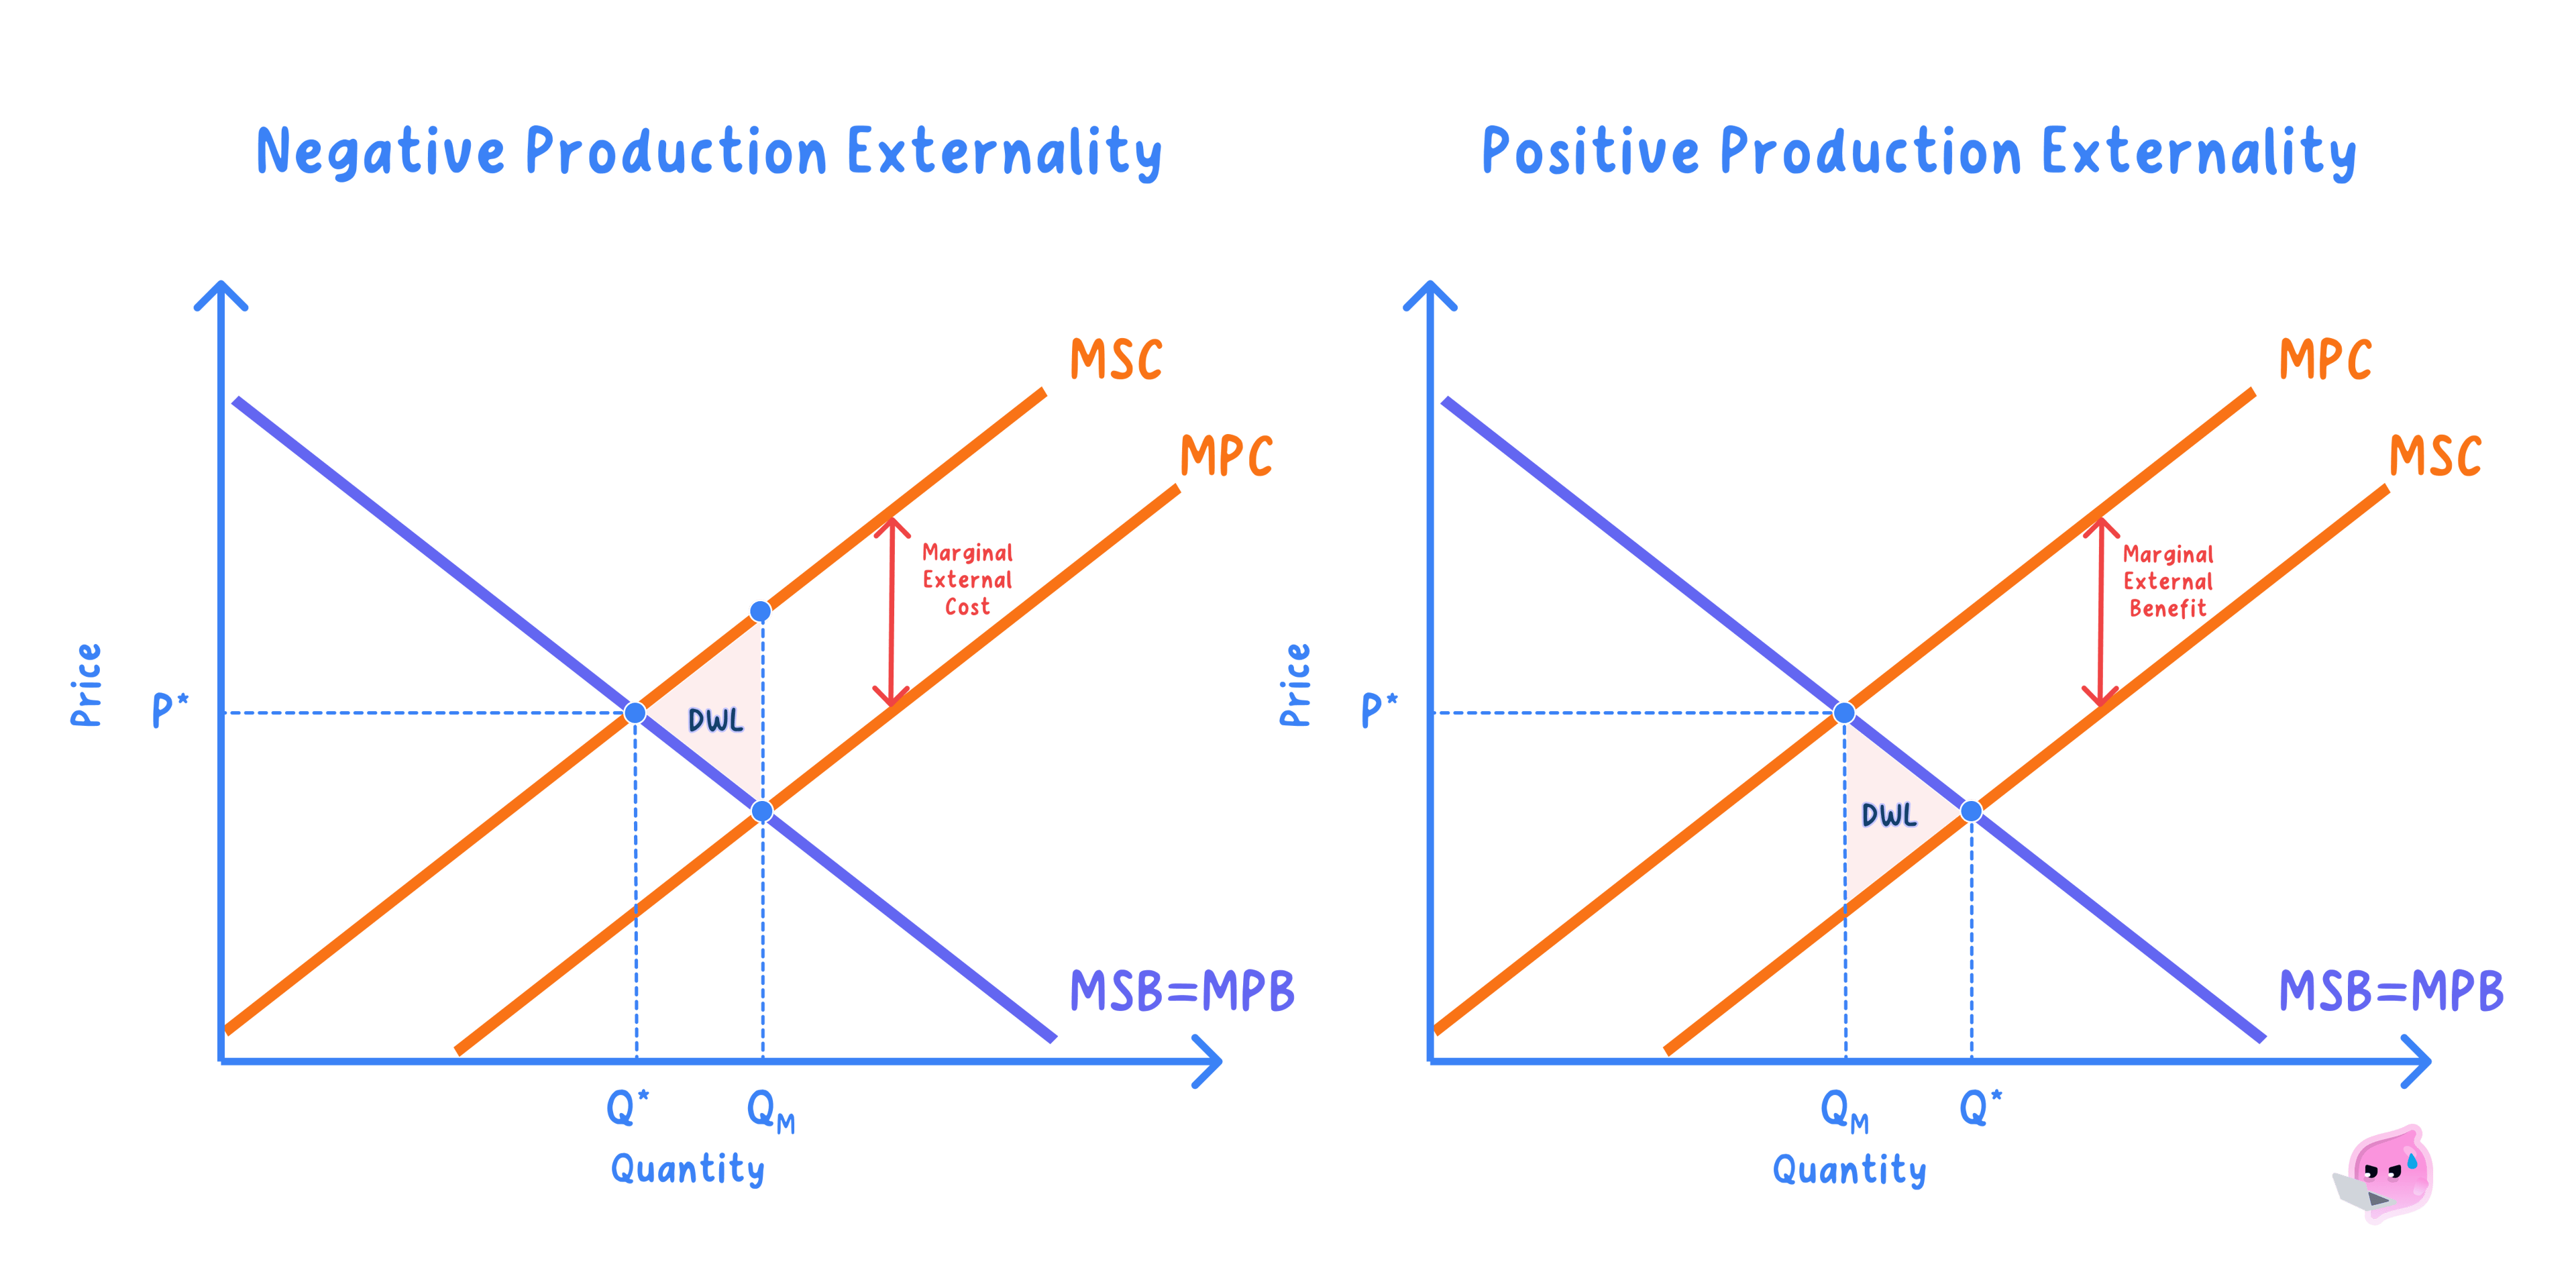
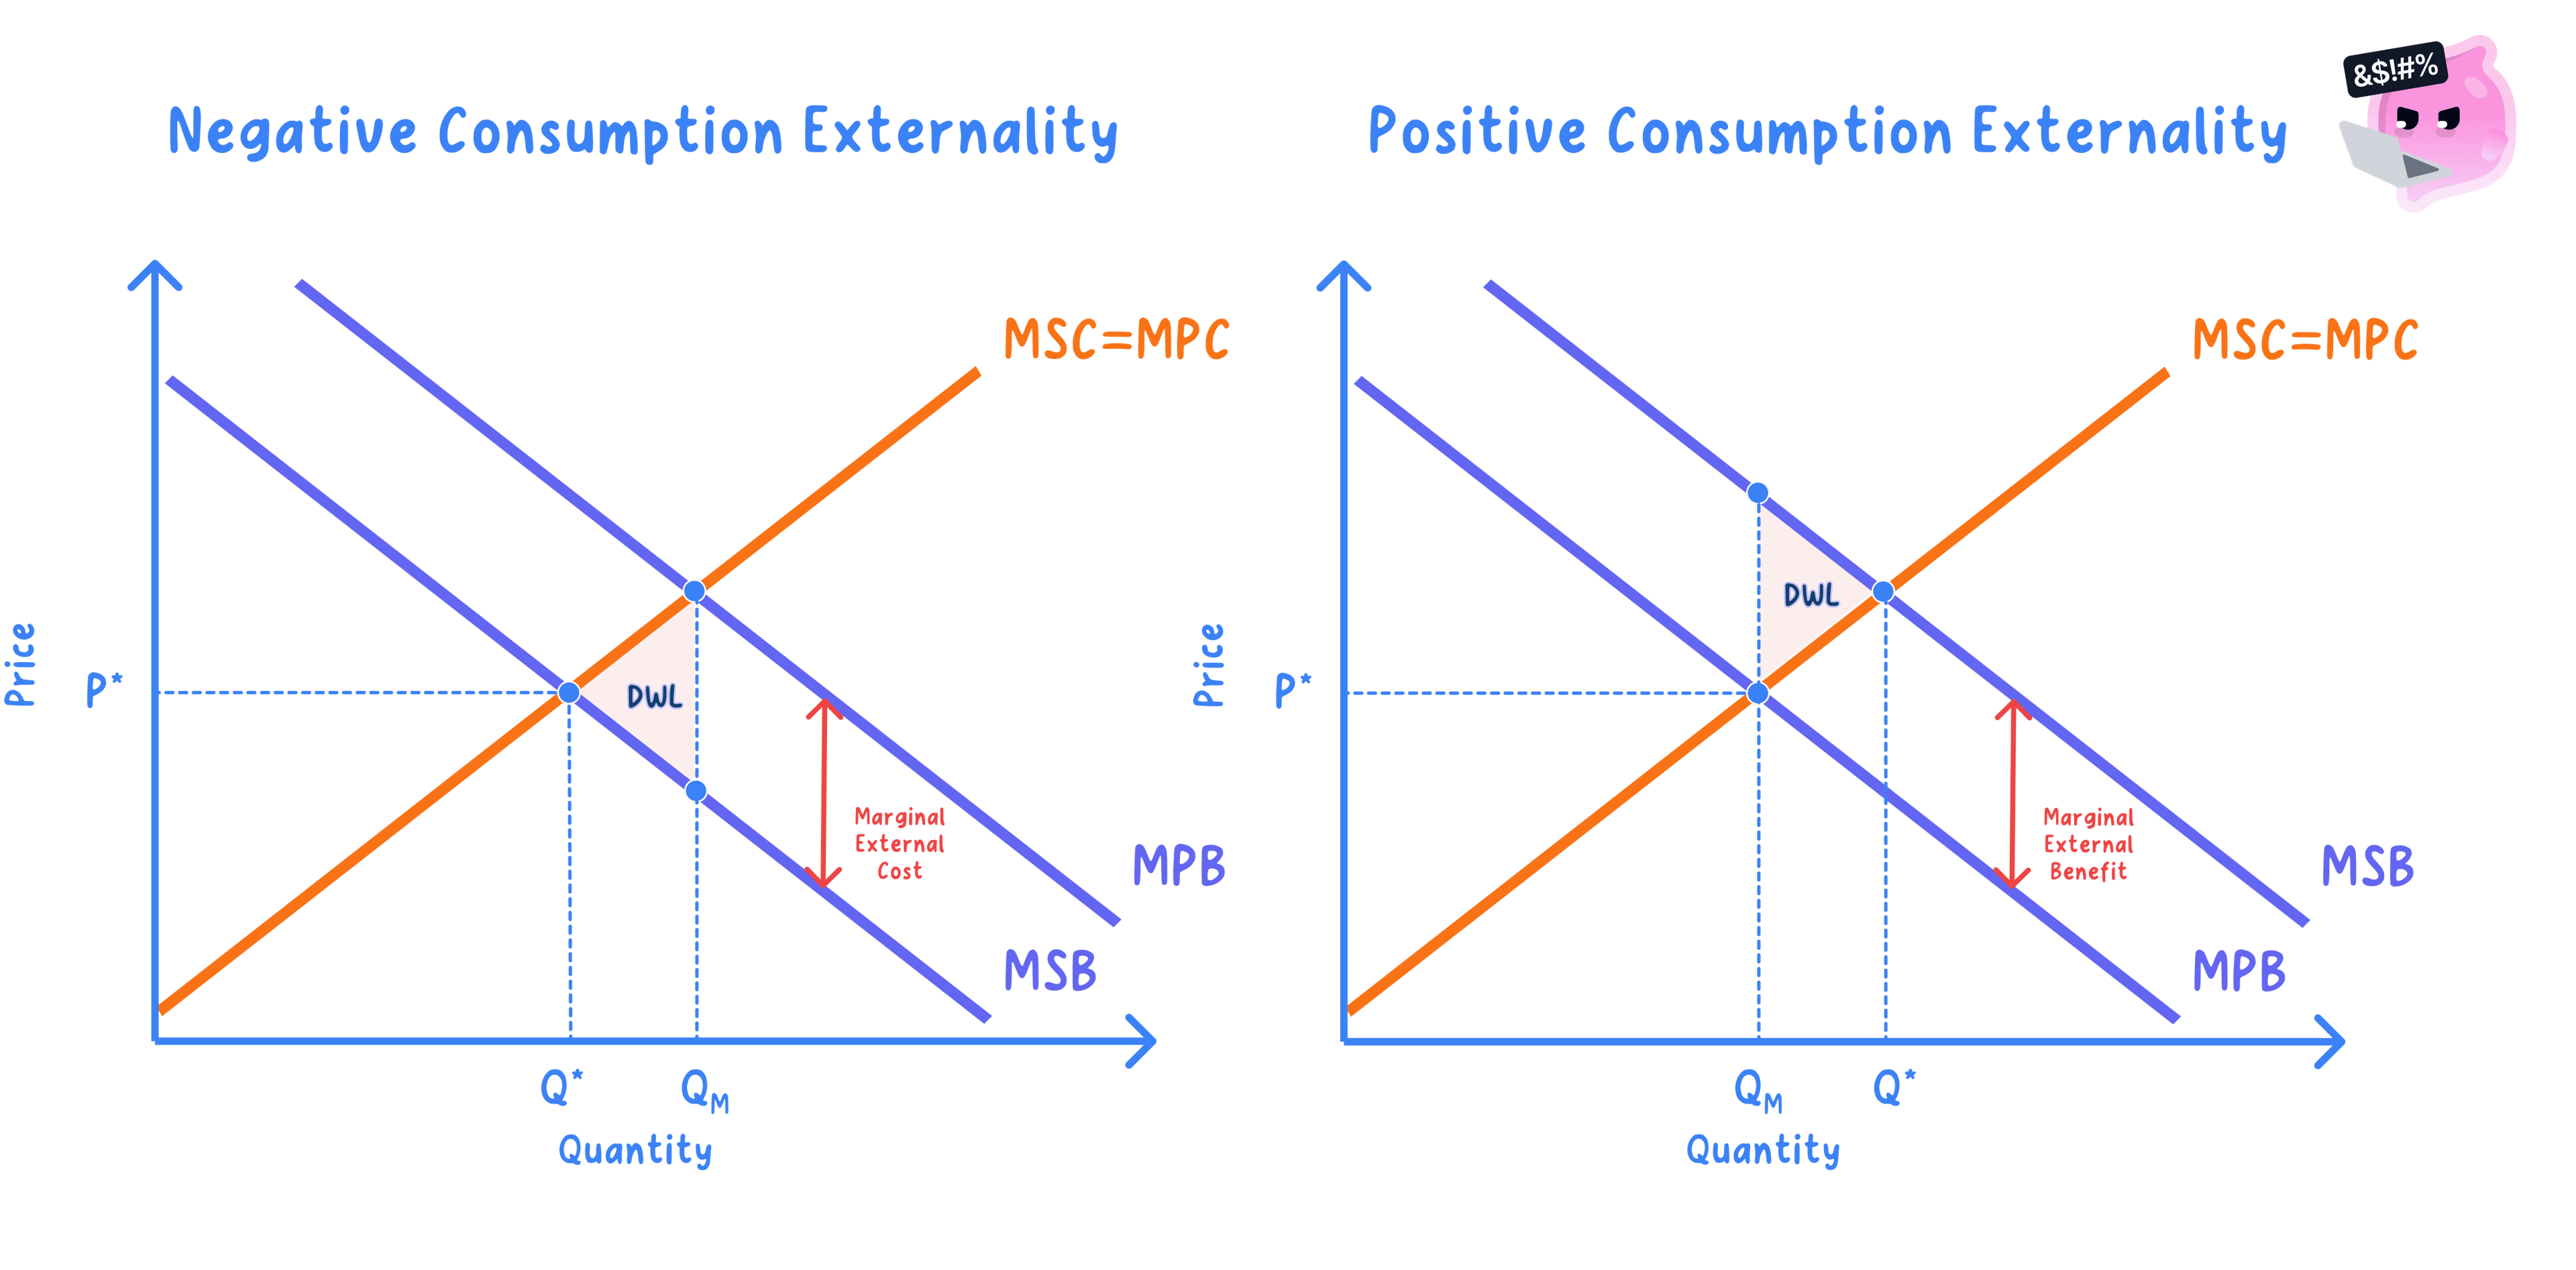
- On a diagram it is the triangle between the MSC and MSB curves, spanning the units between Qopt and Qmarket.
- The apex of the triangle sits at Qopt, where MSC = MSB and the gap between the curves is zero.
- The triangle then widens towards Qmarket, where the divergence between social cost and social benefit is greatest.
Negative externalities: over-provision
- A negative externality pushes MSC above MPC in production, or MSB below MPB in consumption, so the market over-provides.
- For each over-produced unit between Qopt and Qmarket, MSC exceeds MSB, so that unit subtracts from welfare.
- These units are still made because private agents ignore the external cost they impose on third parties.
- The welfare-loss triangle therefore sits to the right of Qopt, between Qopt and the larger Qmarket, widening from an apex at Qopt.
Example
- A factory emitting smoke may impose around £5m a year of health and cleaning costs on nearby residents that never enter its accounts, so MPC lies below MSC and it over-produces.
- A rush-hour driver adds congestion and pollution worth perhaps £8 per trip to other road users, so traffic exceeds the social optimum.
- In each case Qmarket lies to the right of Qopt and a welfare-loss triangle opens up.
Positive externalities: under-provision
- A positive externality pushes MSB above MPB in consumption, or MSC below MPC in production, so the market under-provides.
- For each unit between Qmarket and the larger Qopt, MSB exceeds MSC, so a unit worth more to society than it costs is never produced.
- This forgone welfare is a deadweight loss even though no output is wasted, because valuable output simply does not happen.
- The welfare-loss triangle sits between Qmarket and the larger Qopt, again with its apex at Qopt where MSB = MSC.
Example
- A degree lifts the graduate's pay but also raises the productivity of colleagues and future tax revenue, an external benefit worth thousands of £ that the student ignores.
- A £15 flu vaccine protects the buyer and cuts infection for everyone around them, yet the buyer weighs only their private benefit.
- MPB lies below MSB, so Qmarket lies to the left of Qopt and valuable output is forgone.
Size of the loss
- The bigger the external cost or benefit, the further the private and social curves diverge and the larger the deadweight loss.
- Because the loss is a triangle, its area equals ½ × base × height, where the base is the output gap and the height is the divergence between MSC and MSB at Qmarket.
- The true size depends on how accurately the external cost or benefit can be valued in £, so any figure is an estimate rather than a precise measure.
Example
- Suppose the output gap is 200 units and MSC and MSB diverge by £8 at the market output.
- Welfare loss = ½ × 200 × £8 = £800, the money value of net welfare destroyed each period.
Note
- The area of the triangle is the money value of welfare lost, in generic currency such as £.
- Knowledge of net present value is not required, since the triangle alone measures the loss.
How reliable is the welfare-loss triangle as a measure?
- The triangle is a powerful tool: it turns an abstract misallocation into a clear £ figure using ½ × base × height, pinpoints why the market fails and indicates the size of the tax or subsidy needed to reach Qopt.
- However, it is only as reliable as the value placed on the external cost or benefit. The height of the triangle rests on estimates of MSC and MSB, so different assumptions can change the loss substantially and the £ figure can be spuriously precise.
- It also assumes the social curves are known and typically linear, and it says nothing about who bears the loss or about the cost of removing it, since correcting the failure may itself trigger government failure.
- On balance, the deadweight loss is a valuable way to show the direction and rough scale of inefficiency, but it is best read as an estimate rather than an exact sum. Its usefulness depends on how accurately the externality can be valued and on whether the corrective policy costs less than the loss it removes.
Exam technique
- Always draw both the private and the social curves and clearly label Qmarket and Qopt.
- State whether the market over-provides or under-provides before you identify the loss.
- Shade the welfare loss as the triangle between the curves, with its apex at Qopt.
Common Mistake
- Do not place the welfare-loss triangle on the wrong side of the social optimum.
- Do not confuse the marginal private curves with the marginal social curves when reading the output gap.
- Remember a positive externality under-provides, so its loss lies to the right of Qmarket, not the left.
Self review
- At what output is net social welfare maximised?
- Where does the free market produce when an externality is present?
- Why does over-provision from a negative externality create a deadweight loss?
- Why does under-provision from a positive externality create a deadweight loss?
- How does the size of the external cost or benefit affect the size of the loss?
