Monetary policy and AD/AS
Definition
Monetary transmission mechanism: the chain through which a change in the central bank's interest rate feeds through borrowing and spending to shift aggregate demand, and so alter real output, the price level and employment.
Expansionary policy
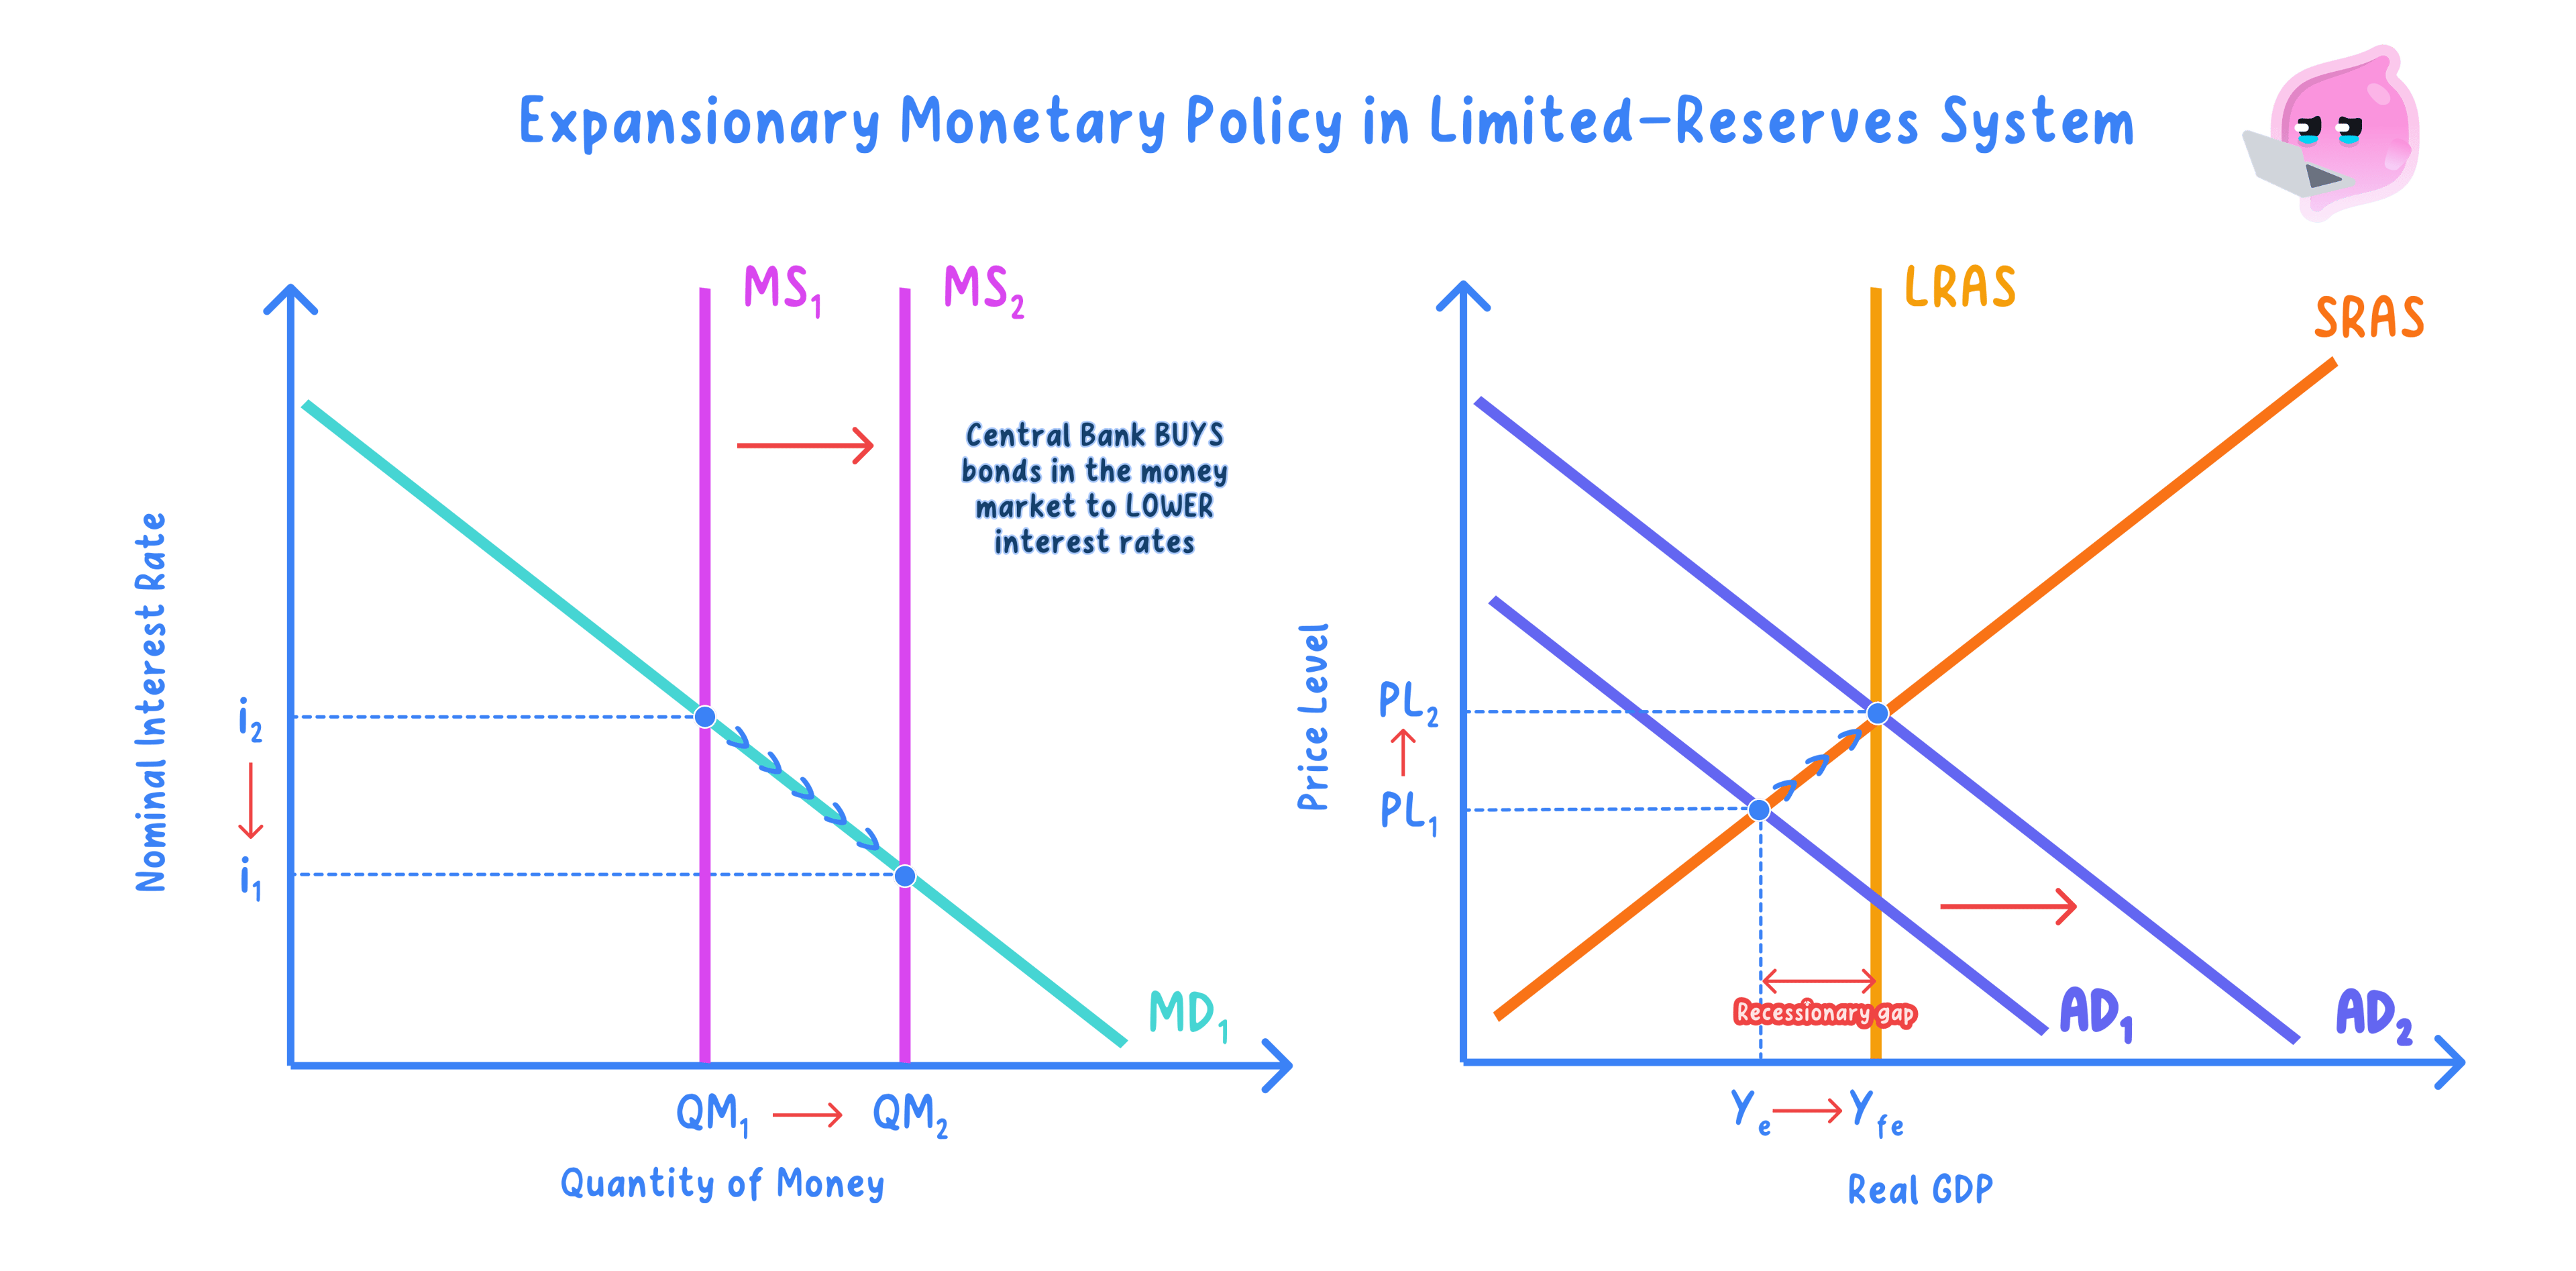
- An interest-rate cut raises consumption and investment, shifting aggregate demand right from AD1 to AD2.
- Equilibrium national income and real output rise.
- Employment increases as firms expand to meet higher demand.
- The price level rises, by an amount that depends on the slope of AS.
- Below full capacity the gain in output dominates the price rise.
- Near full capacity the price-level rise dominates.
Contractionary policy
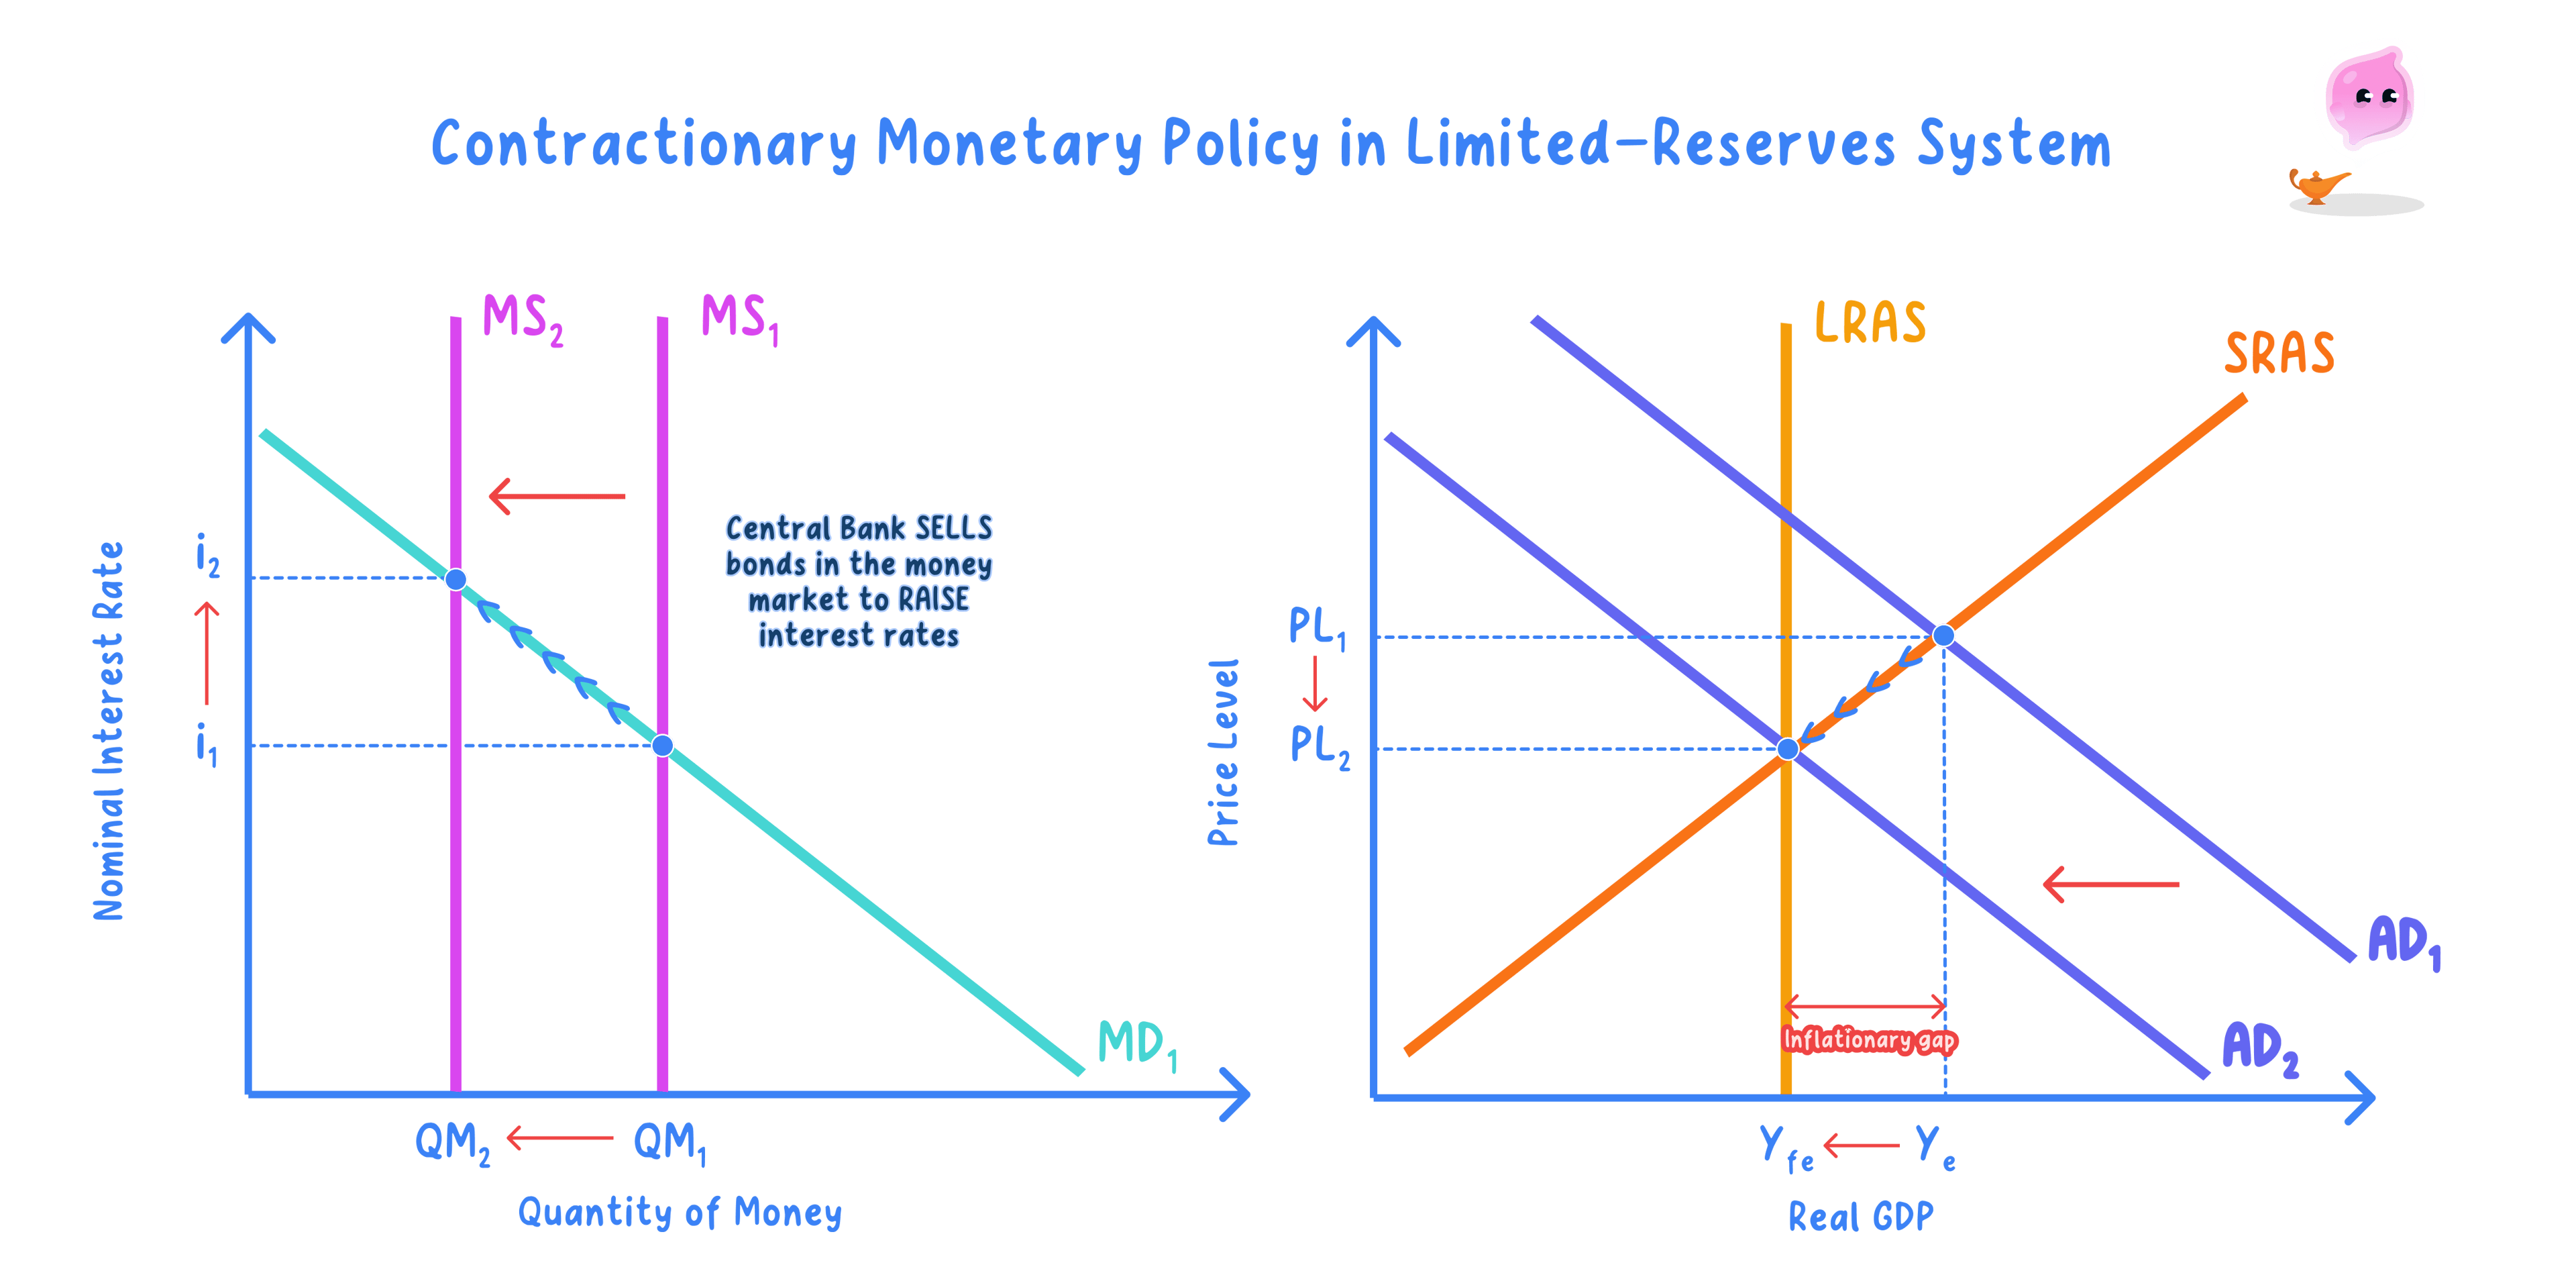
- A rate rise cuts spending, shifting aggregate demand left from AD1 to AD2.
- Equilibrium national income and real output fall.
- Employment falls as firms cut back production.
- The price level falls or rises more slowly, easing inflation.
Key Idea
- Monetary policy shifts the AD curve, not the AS curve.
- The split between output and price effects depends on where the economy sits on AS.
How effective is monetary policy at controlling demand?
- It can work well when spending is interest-sensitive and there is spare capacity: a rate cut lowers the cost of borrowing, lifts consumption and investment and shifts AD right, raising real output and employment with little pressure on prices.
- However, it is much weaker when confidence is low. In a downturn firms and households may not borrow even at very low interest rates, and banks may be unwilling to lend, so cheaper credit fails to revive spending and expansionary policy loses traction.
- Time lags add further uncertainty: the full effect on output and prices can take one to two years to work through, so a policy set for today's economy may take effect only once conditions have already changed.
- On balance, monetary policy is most effective at restraining an overheating, credit-driven boom, where dearer borrowing reliably cools spending; it is least reliable at pulling an economy out of a deep slump. Its strength therefore depends on the interest-sensitivity of spending, the level of confidence, the health of the banking system and the amount of spare capacity.
Example
- Suppose the economy has a negative output gap and the Bank of England cuts the rate from 4% to 2%.
- A firm financing a £1,000,000 investment saves about £20,000 a year in interest, so marginal projects now go ahead.
- Draw AD/AS with average price level on the vertical axis and real output on the horizontal axis.
- AD shifts right from AD1 to AD2, so equilibrium moves up the AS curve.
- Real output rises from Y1 to Y2 and the price level from P1 to P2.
- Because the economy started with spare capacity, most of the change is extra output and jobs; near full capacity it would instead be mostly higher prices.
Exam technique
- Always draw and fully label an AD/AS diagram showing the AD shift.
- Label both equilibria and comment on output, price level and employment.
- Use the slope of AS to judge how the effect splits between output and prices.
Common Mistake
- Do not shift the AS curve; monetary policy is a demand-side policy.
- Shifting AS is the mistake that turns this into supply-side analysis.
- Do not claim output always rises; near full capacity the effect is mostly on prices.
Self review
- Which curve does monetary policy shift?
- What happens to real output and the price level under expansionary policy?
- Why does the slope of AS matter for the outcome?
- Give one reason expansionary monetary policy might be ineffective.
- What happens to employment under contractionary policy?
