The two graphs are not the same graph
Definition
Distance-time graph
A graph with time on the horizontal axis and distance travelled on the vertical axis; the gradient of the line is the speed of the object.
Definition
Speed-time graph
A graph with time on the horizontal axis and speed on the vertical axis; the gradient of the line is the acceleration, and the area beneath the line is the distance travelled.
- Almost every mark lost here comes from treating one graph as though it were the other, so read the axis labels first, then read the shape.
- Speed is distance travelled per unit time, v=s/tv = s/tv=s/t, so a steeper distance-time line covers more distance in the same time and therefore means a greater speed.
- These are speed-time graphs, not velocity-time graphs.
Reading a distance-time graph
- Horizontal line: the distance is not changing, so the object is at rest.
- Straight sloping line (a positive gradient): equal distances in equal times, so constant speed; the steeper the line, the faster the object.
- Curve getting steeper: the speed is increasing, so the object is accelerating.
- Curve getting less steep: the speed is decreasing, so the object is decelerating.
- Line sloping downwards (a negative gradient): the object is moving back towards its starting point.
Reading a speed-time graph
- On the time axis (speed zero): the object is at rest.
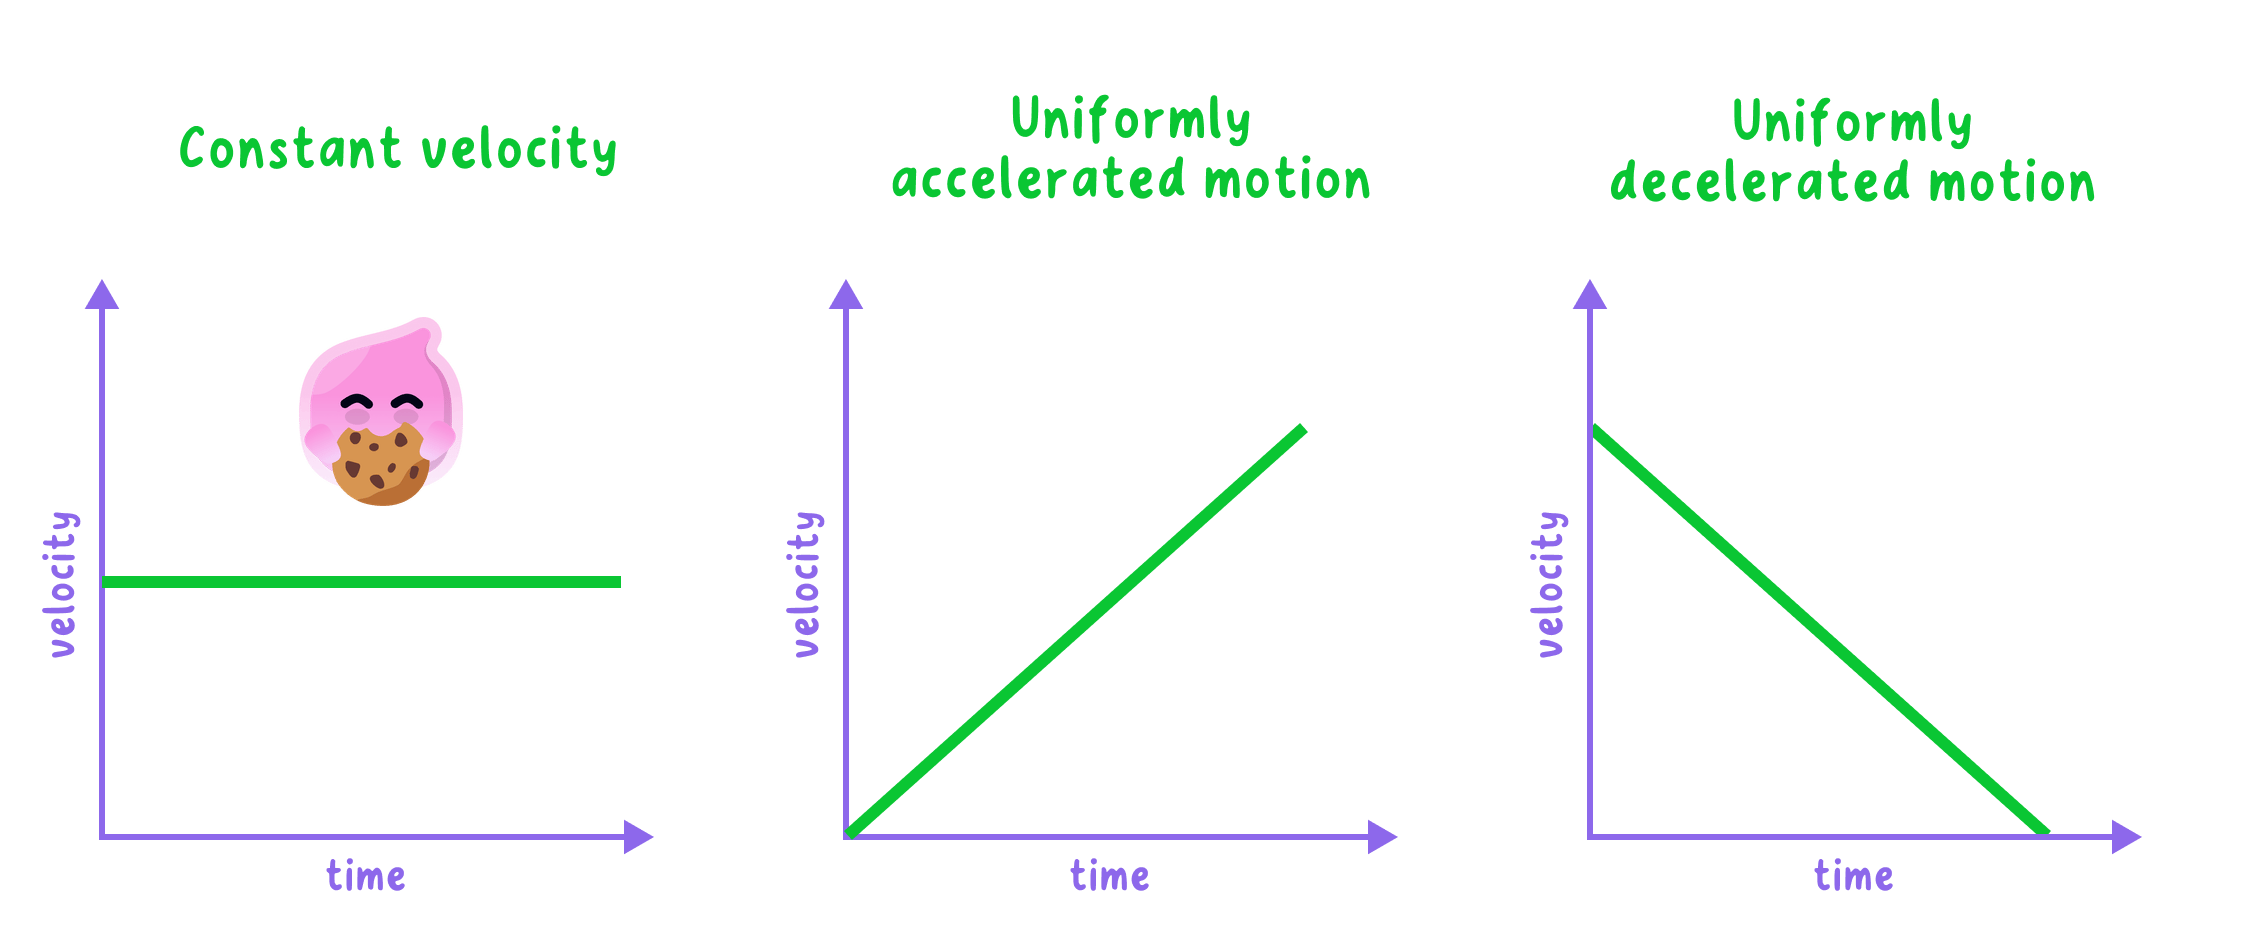
- Horizontal line above the axis: the speed is not changing, so constant speed, the shape most often misread.
- Straight line sloping upwards (a positive gradient): the speed is increasing steadily, so the object is accelerating.
- Straight line sloping downwards (a negative gradient): the speed is decreasing, so the object is decelerating; where the line meets the time axis it has stopped.
- A curved line means the acceleration itself is changing.
Common Mistake
- The commonest error is reading a distance-time graph as though it were a speed-time graph.
- A horizontal line means at rest on a distance-time graph, but constant speed on a speed-time graph.
- A straight sloping line means constant speed on a distance-time graph, but constant acceleration on a speed-time graph.
- A downward slope on a speed-time graph means slowing down, not moving backwards.
- However steep it is, a straight distance-time line never means acceleration; acceleration shows up there only as a curve.
Exam technique
- Check the axis labels before writing anything, questions deliberately mix the two graph types.
- Asked to describe the motion, work through the graph in order and account for every section, quoting the times: "from 0 to 8 s the car moves at constant speed, from 8 to 12 s it is at rest...".
- Use the precise words at rest, constant speed, accelerating, decelerating, not "steady" or "going up".
- Sketch means labelled axes and the right shape; plot means accurate crosses on the grid, joined with a ruler or one thin smooth curve. Label axes as quantity / unit, for example time / s.
Self review
- On a distance-time graph, what does the gradient of the line represent?
- On a speed-time graph, what do the gradient and the area under the line represent?
- What motion does a horizontal line show on each of the two graphs?
- On a distance-time graph, what shape of line shows that an object is accelerating?
- What is the difference between "sketch" and "plot" in a graph question?
