Skip to content
MathsGenie logo
Open app

Course home

  1. IGCSE
  2. Maths Edexcel
  3. Question bank

Real Life and Distance Time Graphs

EasyMediumHard
123456789
Question 1
69%

Rebecca went on a bike ride. This graph shows Rebecca's distance from home on her bike ride.
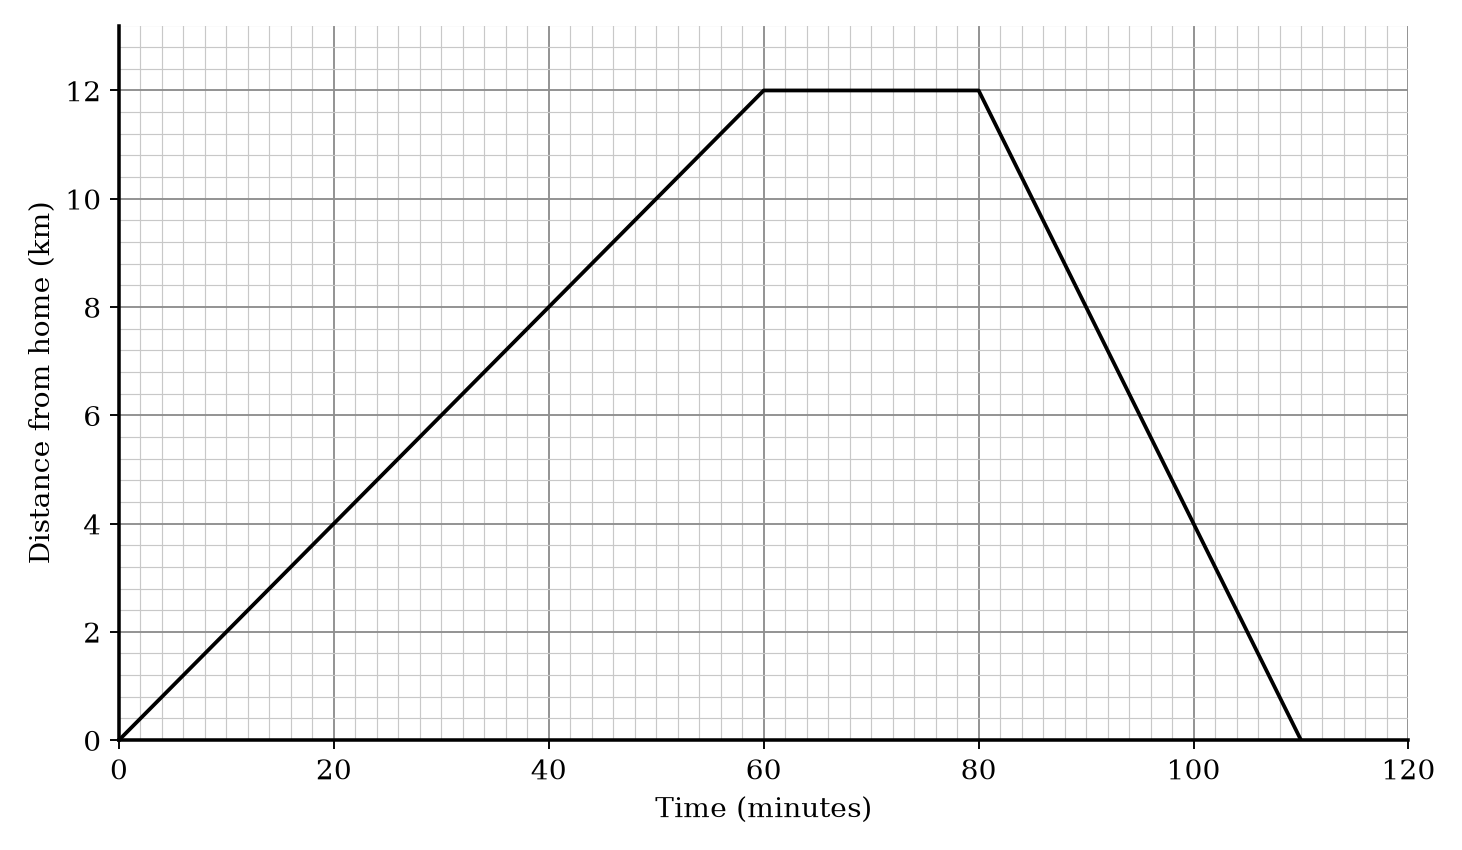
Distance-time graph for a bike ride. The y-axis is 'Distance from home (km)' from 0 to 12. The x-axis is 'Time (minutes)' from 0 to 120. The graph consists of three straight line segments: (0,0) to (60,12), (60,12) to (80,12), and (80,12) to (110,0).

Time (minutes)Distance from home (km)
00
306
6012
8012
1100

Distance-time graph for a bike ride. The y-axis is 'Distance from home (km)' from 0 to 12. The x-axis is 'Time (minutes)' from 0 to 120. The graph consists of three straight line segments: (0,0) to (60,12), (60,12) to (80,12), and (80,12) to (110,0).

a.

How far had Rebecca travelled after 30 minutes?

[1]
b.

After 60 minutes, Rebecca stopped for a rest. For how many minutes did she rest?

[1]
c.

How far did Rebecca travel in total?

[1]

Real Life and Distance Time Graphs Questions

  1. IGCSE
  2. /Maths
  3. /Real Life and Distance Time Graphs

Practise Edexcel IGCSE Maths Real Life and Distance Time Graphs with exam-style questions for IGCSE Maths. 19 questions, matched to the Edexcel IGCSE Maths (4MA1) specification and written in Paper 1 and Paper 2 style. Every question includes a full worked solution and mark scheme, so you can see where marks are awarded rather than just whether you got the answer right.

Question bank