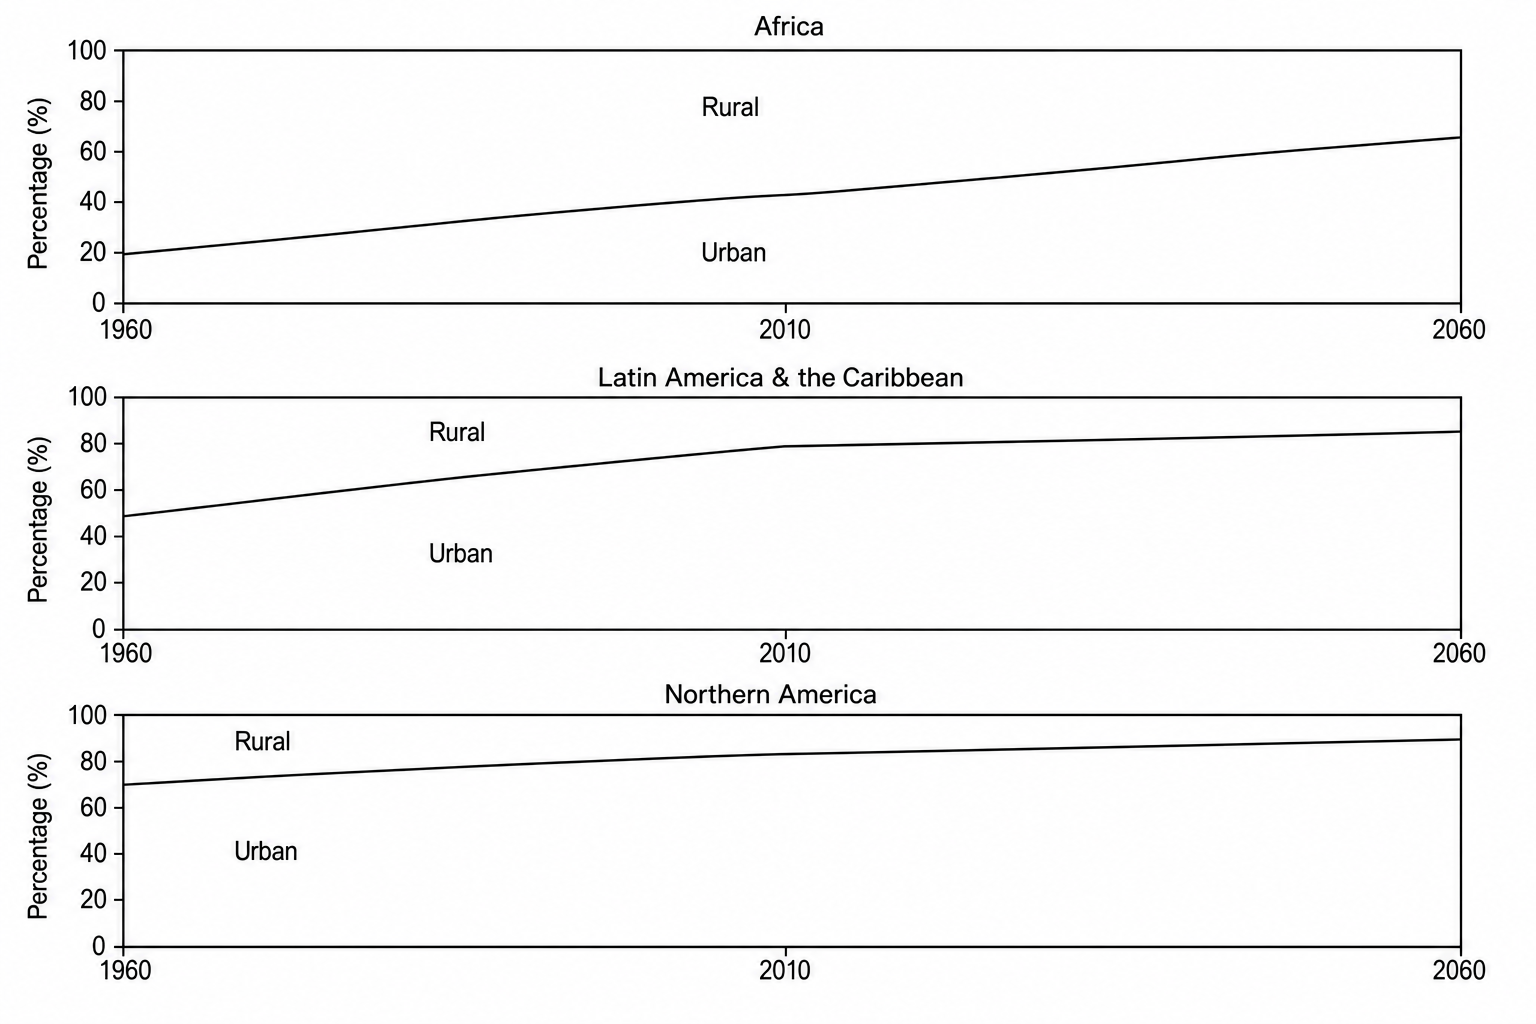
Study Figure 4a, which shows the projected proportion of urban and rural populations for three world regions between 1960 and 2060.
Analyse the possible factors leading to the regional population variations shown in Figure 4a.