Skip to content
MathsGenie logo
Open app

Course home

  1. IGCSE
  2. Geography Edexcel
  3. Question bank

Globalisation and migration

EasyMediumHard
1234567891011121314151617181920212223242526272829303132333435363738394041424344454647484950515253545556575859606162
Question 41

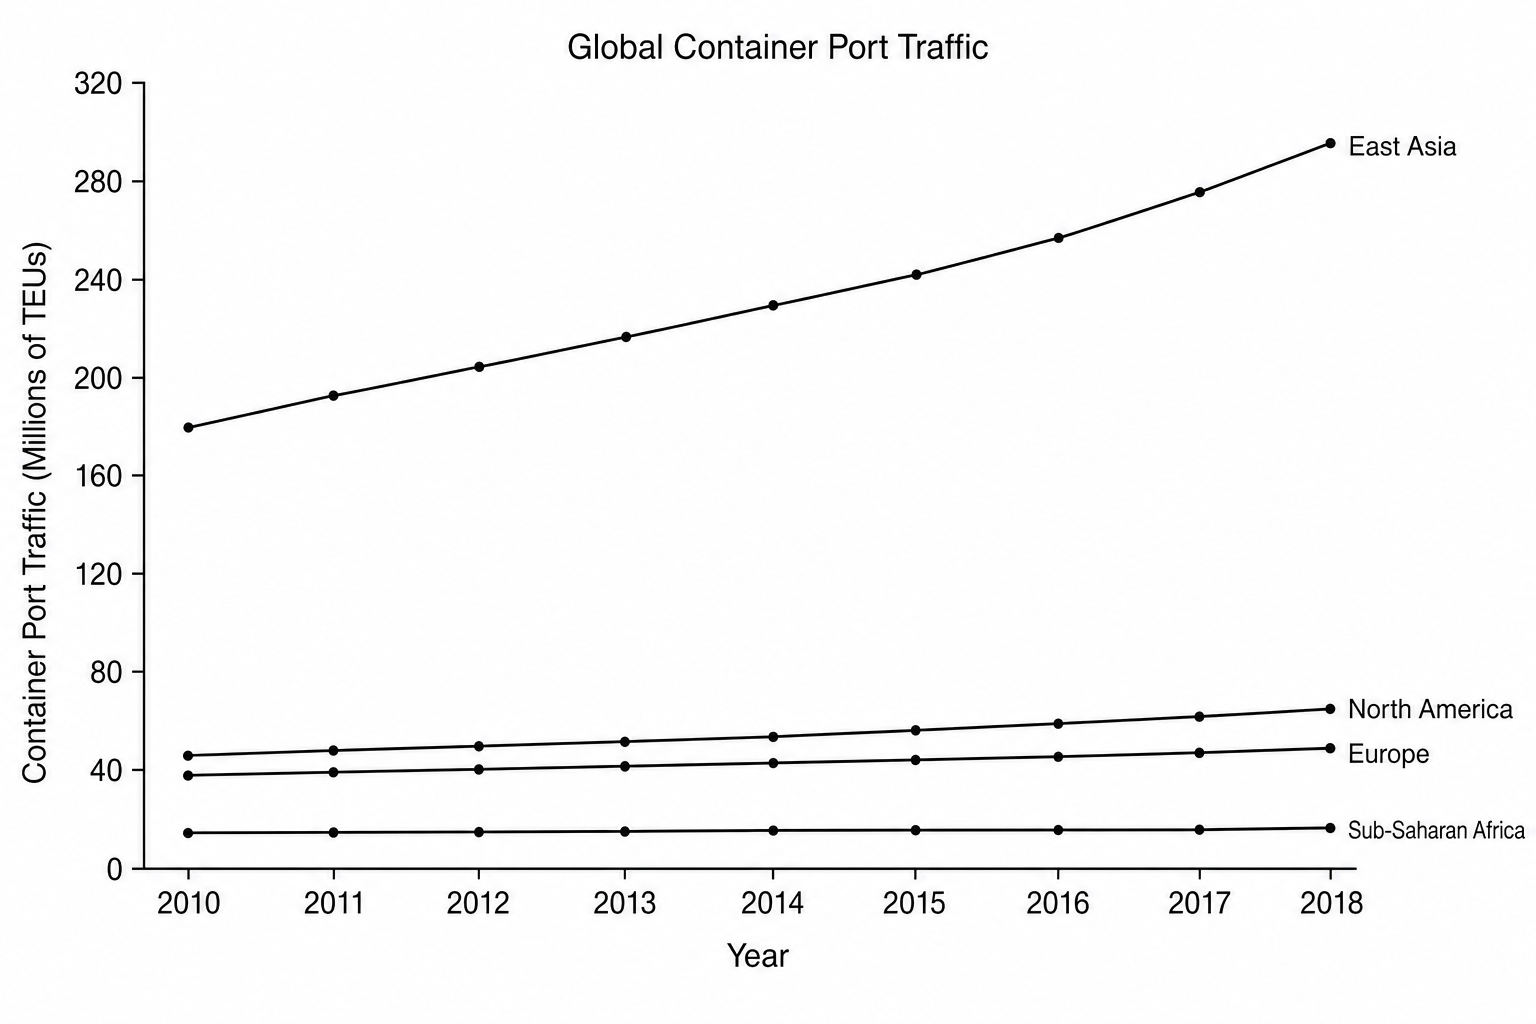
Study Figure 5, a line graph showing global container port traffic between 2010 and 2018 for selected regions.

Line graph showing global container port traffic in millions of TEUs (Twenty-Foot Equivalent Units) from 2010 to 2018. East Asia starts at 180 million in 2010 and rises steadily each year to 290 million by 2018. North America starts at 42 million in 2010 and rises gradually to 55 million by 2018. Europe starts at 38 million in 2010 and increases slowly to 48 million by 2018. Sub-Saharan Africa remains low and almost entirely flat, starting at 11 million in 2010 and ending at 13 million by 2018.

Identify the extent to which global container port traffic has changed over time for the regions shown in Figure 5.

[2]

Globalisation and migration Questions

  1. IGCSE
  2. /Geography
  3. /Globalisation and migration
