Skip to content
MathsGenie logo
Open app

Course home

  1. IGCSE
  2. Geography Edexcel
  3. Question bank

Economic activity and energy

EasyMediumHard
12345678910111213141516171819202122232425262728293031
Question 20

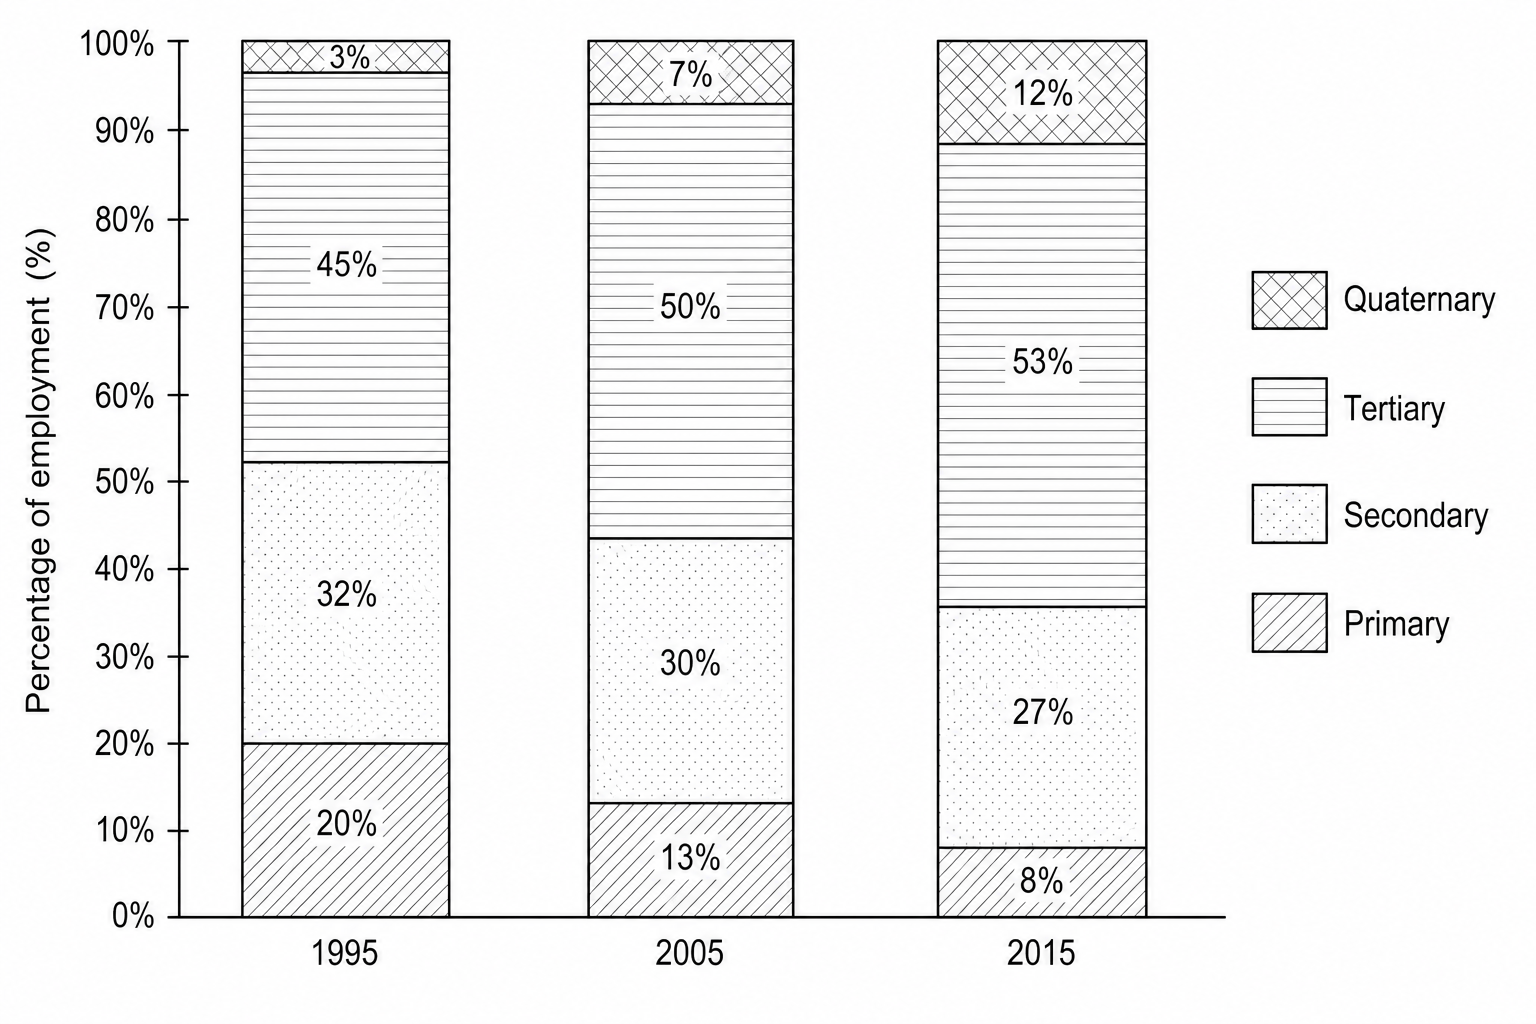
Study Figure 2b, which shows changes in employment by economic sector in Malaysia between 1995 and 2015.

Stacked bar chart showing the percentage of employment by economic sector in Malaysia for the years 1995, 2005, and 2015. The sectors are: Primary (1995: 20%, 2005: 13%, 2015: 8%), Secondary (1995: 32%, 2005: 30%, 2015: 27%), Tertiary (1995: 45%, 2005: 50%, 2015: 53%), and Quaternary (1995: 3%, 2005: 7%, 2015: 12%).

Suggest one reason for the changes in the tertiary and quaternary sectors shown in Figure 2b.
[3]

Economic activity and energy Questions

  1. IGCSE
  2. /Geography
  3. /Economic activity and energy

