Skip to content
MathsGenie logo
Open app

Course home

  1. IGCSE
  2. Geography Edexcel
  3. Question bank

Economic activity and energy

EasyMediumHard
12345678910111213141516171819202122232425262728293031
Question 19

Study Figure 4a, which shows the change in secondary sector employment in selected HICs between 1980 and 2016.
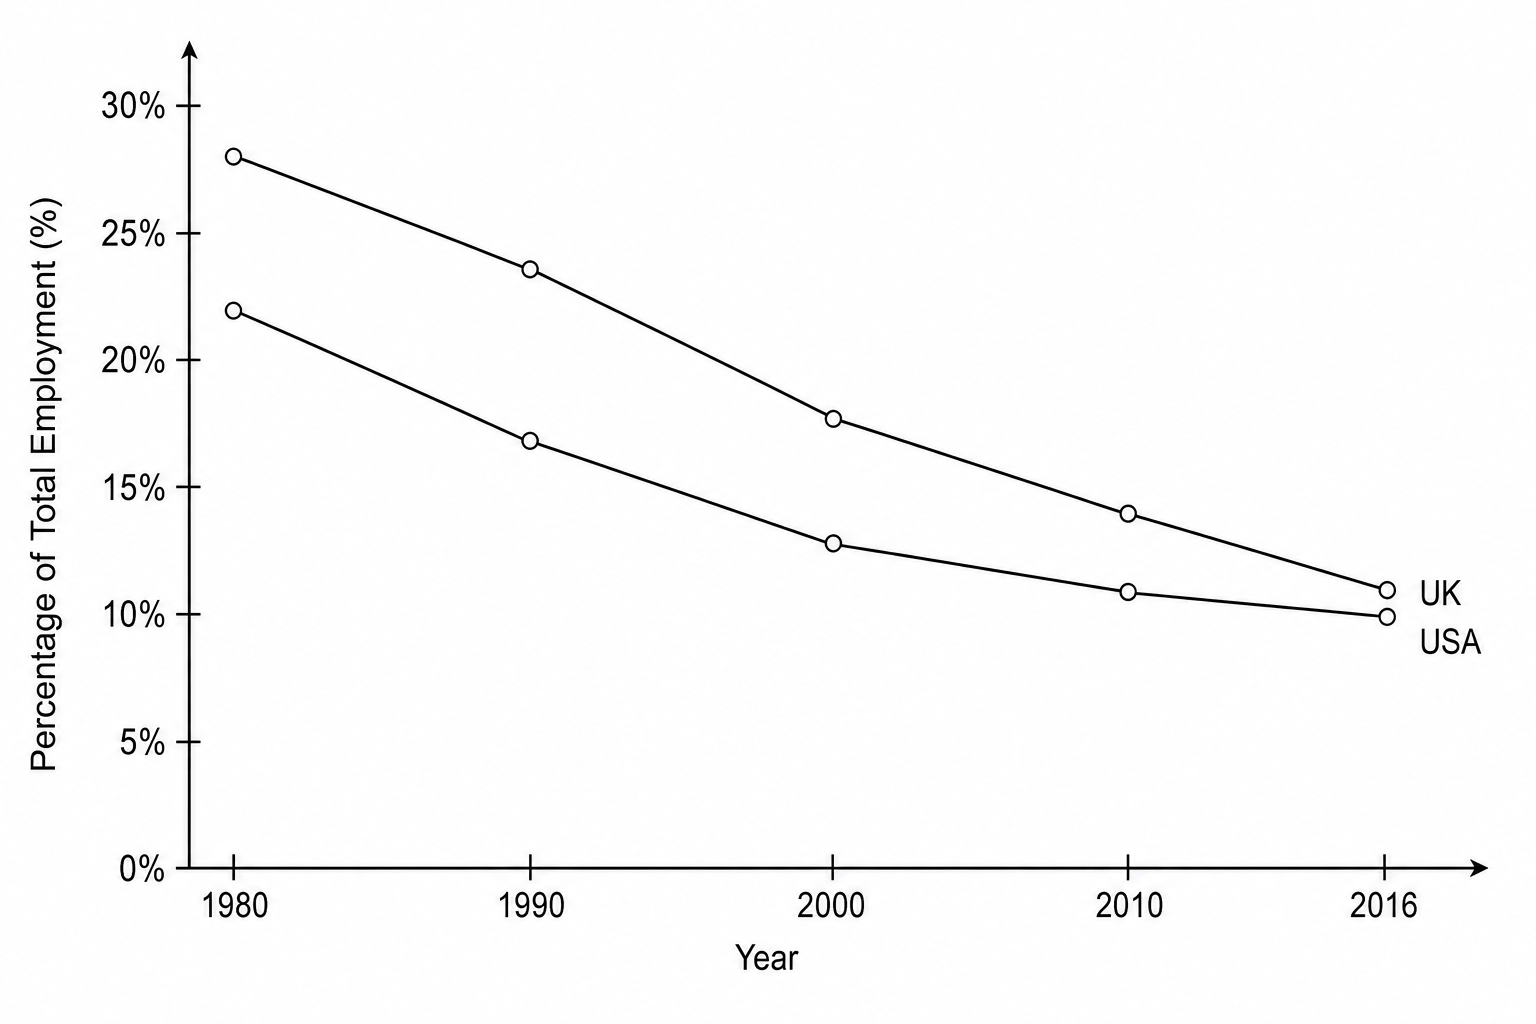
Figure 4a: A line graph showing the percentage of total employment in the secondary (manufacturing) sector in selected HICs from 1980 to 2016. For the UK, the line shows a steady decline from 28% in 1980 down to 11% in 2016. For the USA, the line shows a decline from 22% in 1980 to 10% in 2016.

Describe one effect that the decline in the secondary sector has had on a named area of a High-Income Country (HIC).

Named HIC area: ............................................................

[3]

Economic activity and energy Questions

  1. IGCSE
  2. /Geography
  3. /Economic activity and energy
