Question 3
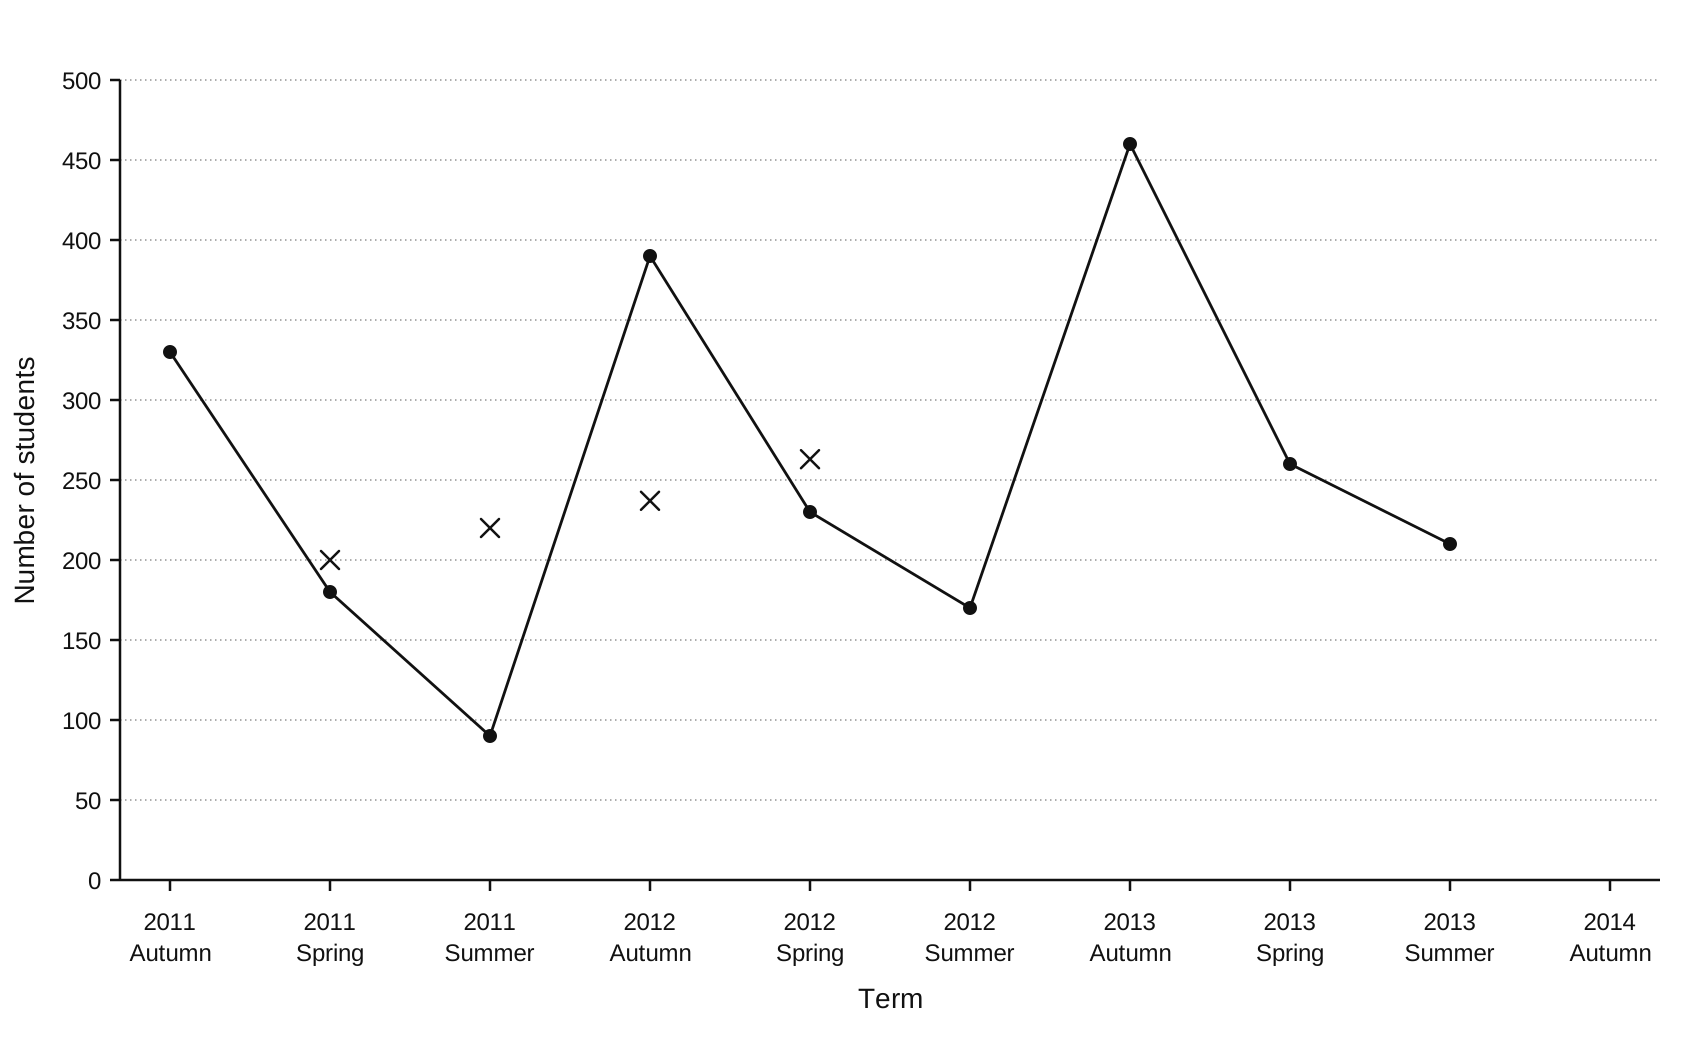
The table gives information about the number of students who enrol for a course in each term in 2011, in 2012 and in 2013. The 3-point moving averages are given correct to 3 significant figures.
| Year | Term | Number of students | 3-point moving average |
|---|---|---|---|
| 2011 | Autumn | 330 | |
| Spring | 180 | 200 | |
| Summer | 90 | 220 | |
| 2012 | Autumn | 390 | 237 |
| Spring | 230 | 263 | |
| Summer | 170 | 287 | |
| 2013 | Autumn | 460 | 297 |
| Spring | 260 | xxx | |
| Summer | 210 |
a.[2]
Calculate the value of x x\,x in the table. Give your answer correct to 3 significant figures.
b.[2]
Plot the 3-point moving averages on the time-series graph. The first four have been done for you.
c.[1]
On the time-series graph, draw a trend line for the 3-point moving averages.
d.[4]
(i) Use your trend line to find an estimate for the mean seasonal variation in numbers enrolling for the Autumn Term.
(ii) Predict the number of students who will enrol in the Autumn Term of 2014.
Moving Averages Questions
5 exam-style questions on Edexcel GCSE Statistics Moving Averages. Each one has a worked solution and a mark scheme showing where the marks go.