Frequency tables
Frequency table
A table that records how many times each value or category appears in a set of data, often built up using tally marks.
- A frequency table records how often each value or category shows up in the data.
- Frequency is the count of how many times that value happened.
- One column lists the values or categories and the next gives the frequency of each.
- A tally chart is a frequency table filled in as the data arrives, one mark per item.
- The frequencies add up to the total number of items collected, which is the check that nothing was missed.
- A frequency table turns a long list of raw scores into a summary that can be read at a glance.
- Which chart to draw is decided by the data, so the first question is always whether the horizontal axis holds separate categories or one continuous scale.
- A chart is only readable with a title and both axes labelled, since a bar of height 12 says nothing until the reader knows that 12 pupils named spiders.
- A frequency table is the step between the raw list and the chart, because the chart is drawn from the frequencies rather than from the original scores.
Worked example: tallying quiz scores
- Twenty pupils sit a five-word memory quiz.
- Their scores, in the order collected, are 4, 3, 5, 4, 2, 4, 3, 5, 4, 3, 4, 5, 2, 4, 3, 5, 4, 4, 3, 5.
- Work through the list one score at a time, putting a tally mark in the row for that score.
- Group the marks in fives, then count each row to get its frequency.
Score | Tally | Frequency
2 | || | 2
3 | ||||| | 5
4 | ||||| ||| | 8
5 | ||||| | 5
Total | | 20
- The wide gaps are the column boundaries, so the row for 4 reads as a block of five marks then three more, giving 8.
- To read a value back, find its row and take the frequency straight off.
- Add frequencies together to compare groups, so scores of 4 and 5 account for 8 + 5 = 13 of the 20 pupils.
- A score of 4 has the highest frequency, 8, so it is the most common result.
- The frequencies add to 2 + 5 + 8 + 5 = 20, which matches the 20 pupils, so no score has been missed.
- Only 2 pupils scored 2, which is why that row holds the shortest tally in the table.
Bar charts
Bar chart
A chart that shows data for separate categories as bars, where the height of each bar gives the value and gaps separate the bars.
- A bar chart shows data for separate categories, one bar per category.
- The height of each bar gives the value for that category, so taller bars mean bigger values.
- The bars sit apart with gaps between them because the categories are separate things.
- Use it for data that falls into distinct groups, not for continuous data such as time or height.
- A bar chart drawn straight from a frequency table is also called a frequency diagram, and the height of each bar is that value's frequency.
- The order of the bars is not fixed, so the categories can be arranged in whatever order makes the comparison easiest to read.
- A bar can show a mean for each group as well as a count, because its height only has to be a number that belongs to that category.
Sketching a chart
- Give the chart a title that says what it shows, such as Most common fears in a class of 30.
- Label the horizontal axis with the categories or the measurement, such as fear or reaction time.
- Label the vertical axis with what has been counted or measured, adding units where the data has them.
- Pick an even scale that starts at zero and reaches your largest value.
- Plot the data last, keeping every bar the same width and evenly spaced.
- A value axis that starts above zero stretches the differences between the bars, so the heights mislead whoever reads them.
- The gaps between the bars of a bar chart are what show the categories are separate, so joined bars lose that signal.
Worked example: a bar chart of fears
- You ask 30 pupils to name the fear they think is most common.
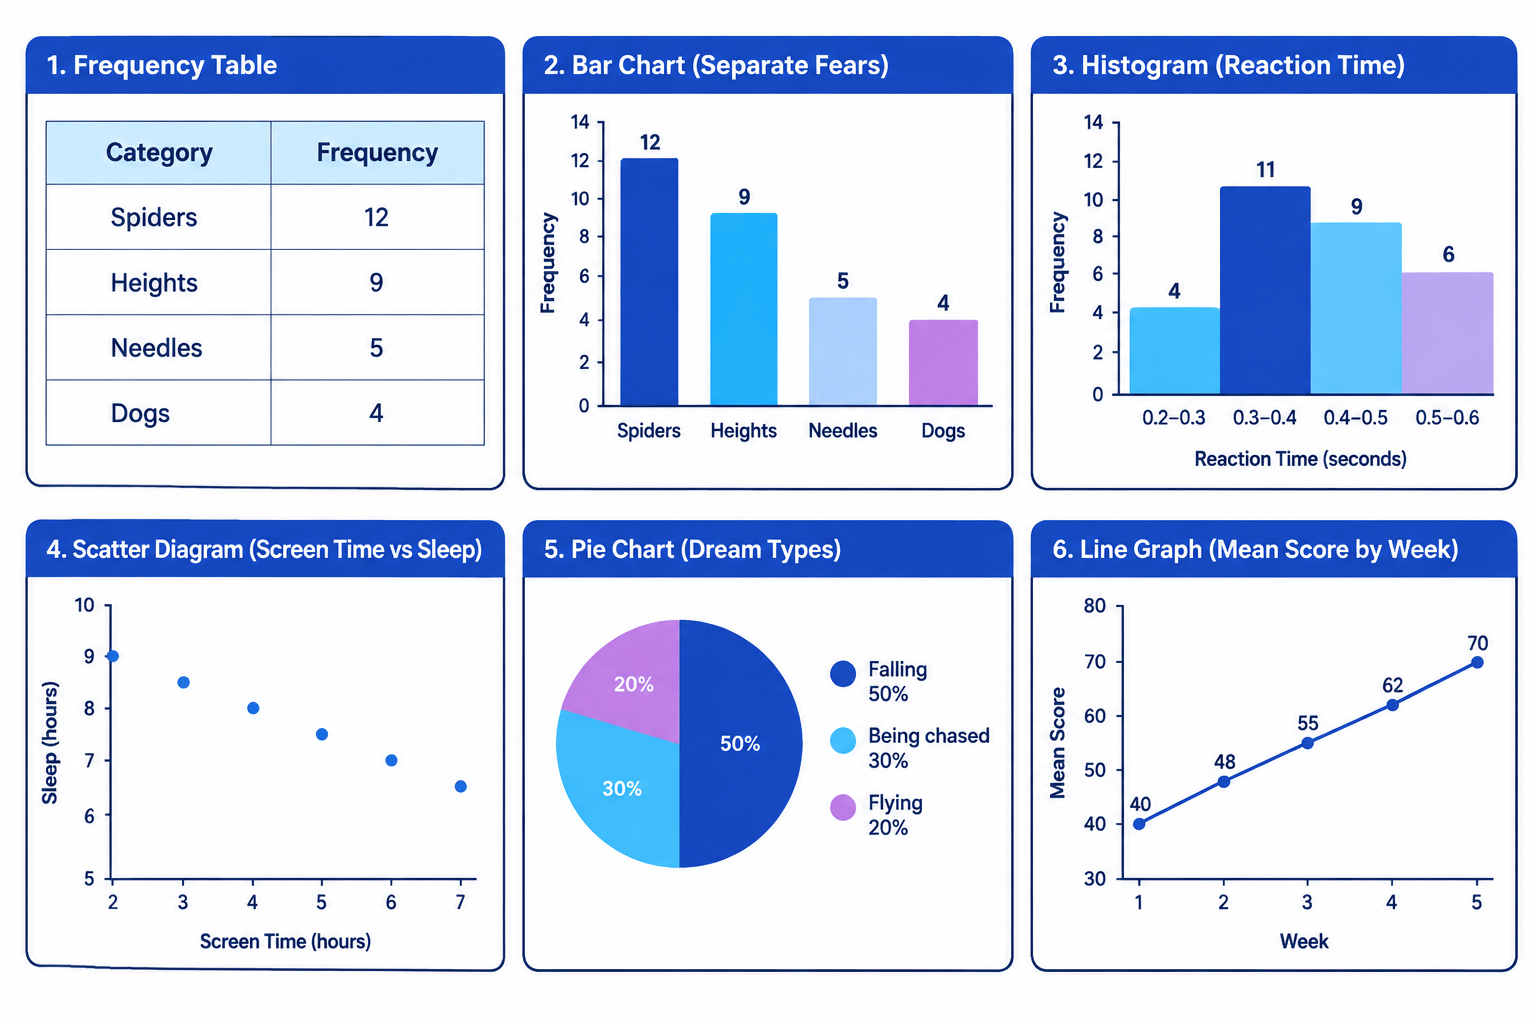
- The counts are spiders 12, heights 9, needles 5 and dogs 4.
Fear | Number of pupils
Spiders | 12
Heights | 9
Needles | 5
Dogs | 4
- Put fear on the horizontal axis and number of pupils on the vertical axis, running from 0 to at least 12.
- Draw four equal, evenly spaced bars at heights 12, 9, 5 and 4, leaving a gap between each pair.
- The spiders bar is tallest, at 12 pupils, so spiders is the most-named fear.
- Follow the top of the dogs bar across to the axis and it reaches 4, the shortest bar.
- The four bars total 12 + 9 + 5 + 4 = 30, so every pupil asked is on the chart.
Histograms
Histogram
A chart that shows continuous data grouped into intervals, drawn with bars that touch because the intervals join up.
- A histogram displays continuous data grouped into intervals.
- Continuous data can take any value in a range, such as time, height or reaction speed.
- The height of each bar shows how many values fall inside that interval.
- The horizontal axis is one continuous number scale rather than a row of separate categories.
- The bars touch because the intervals run straight into each other.
- Touching bars are what distinguish a histogram from a bar chart.
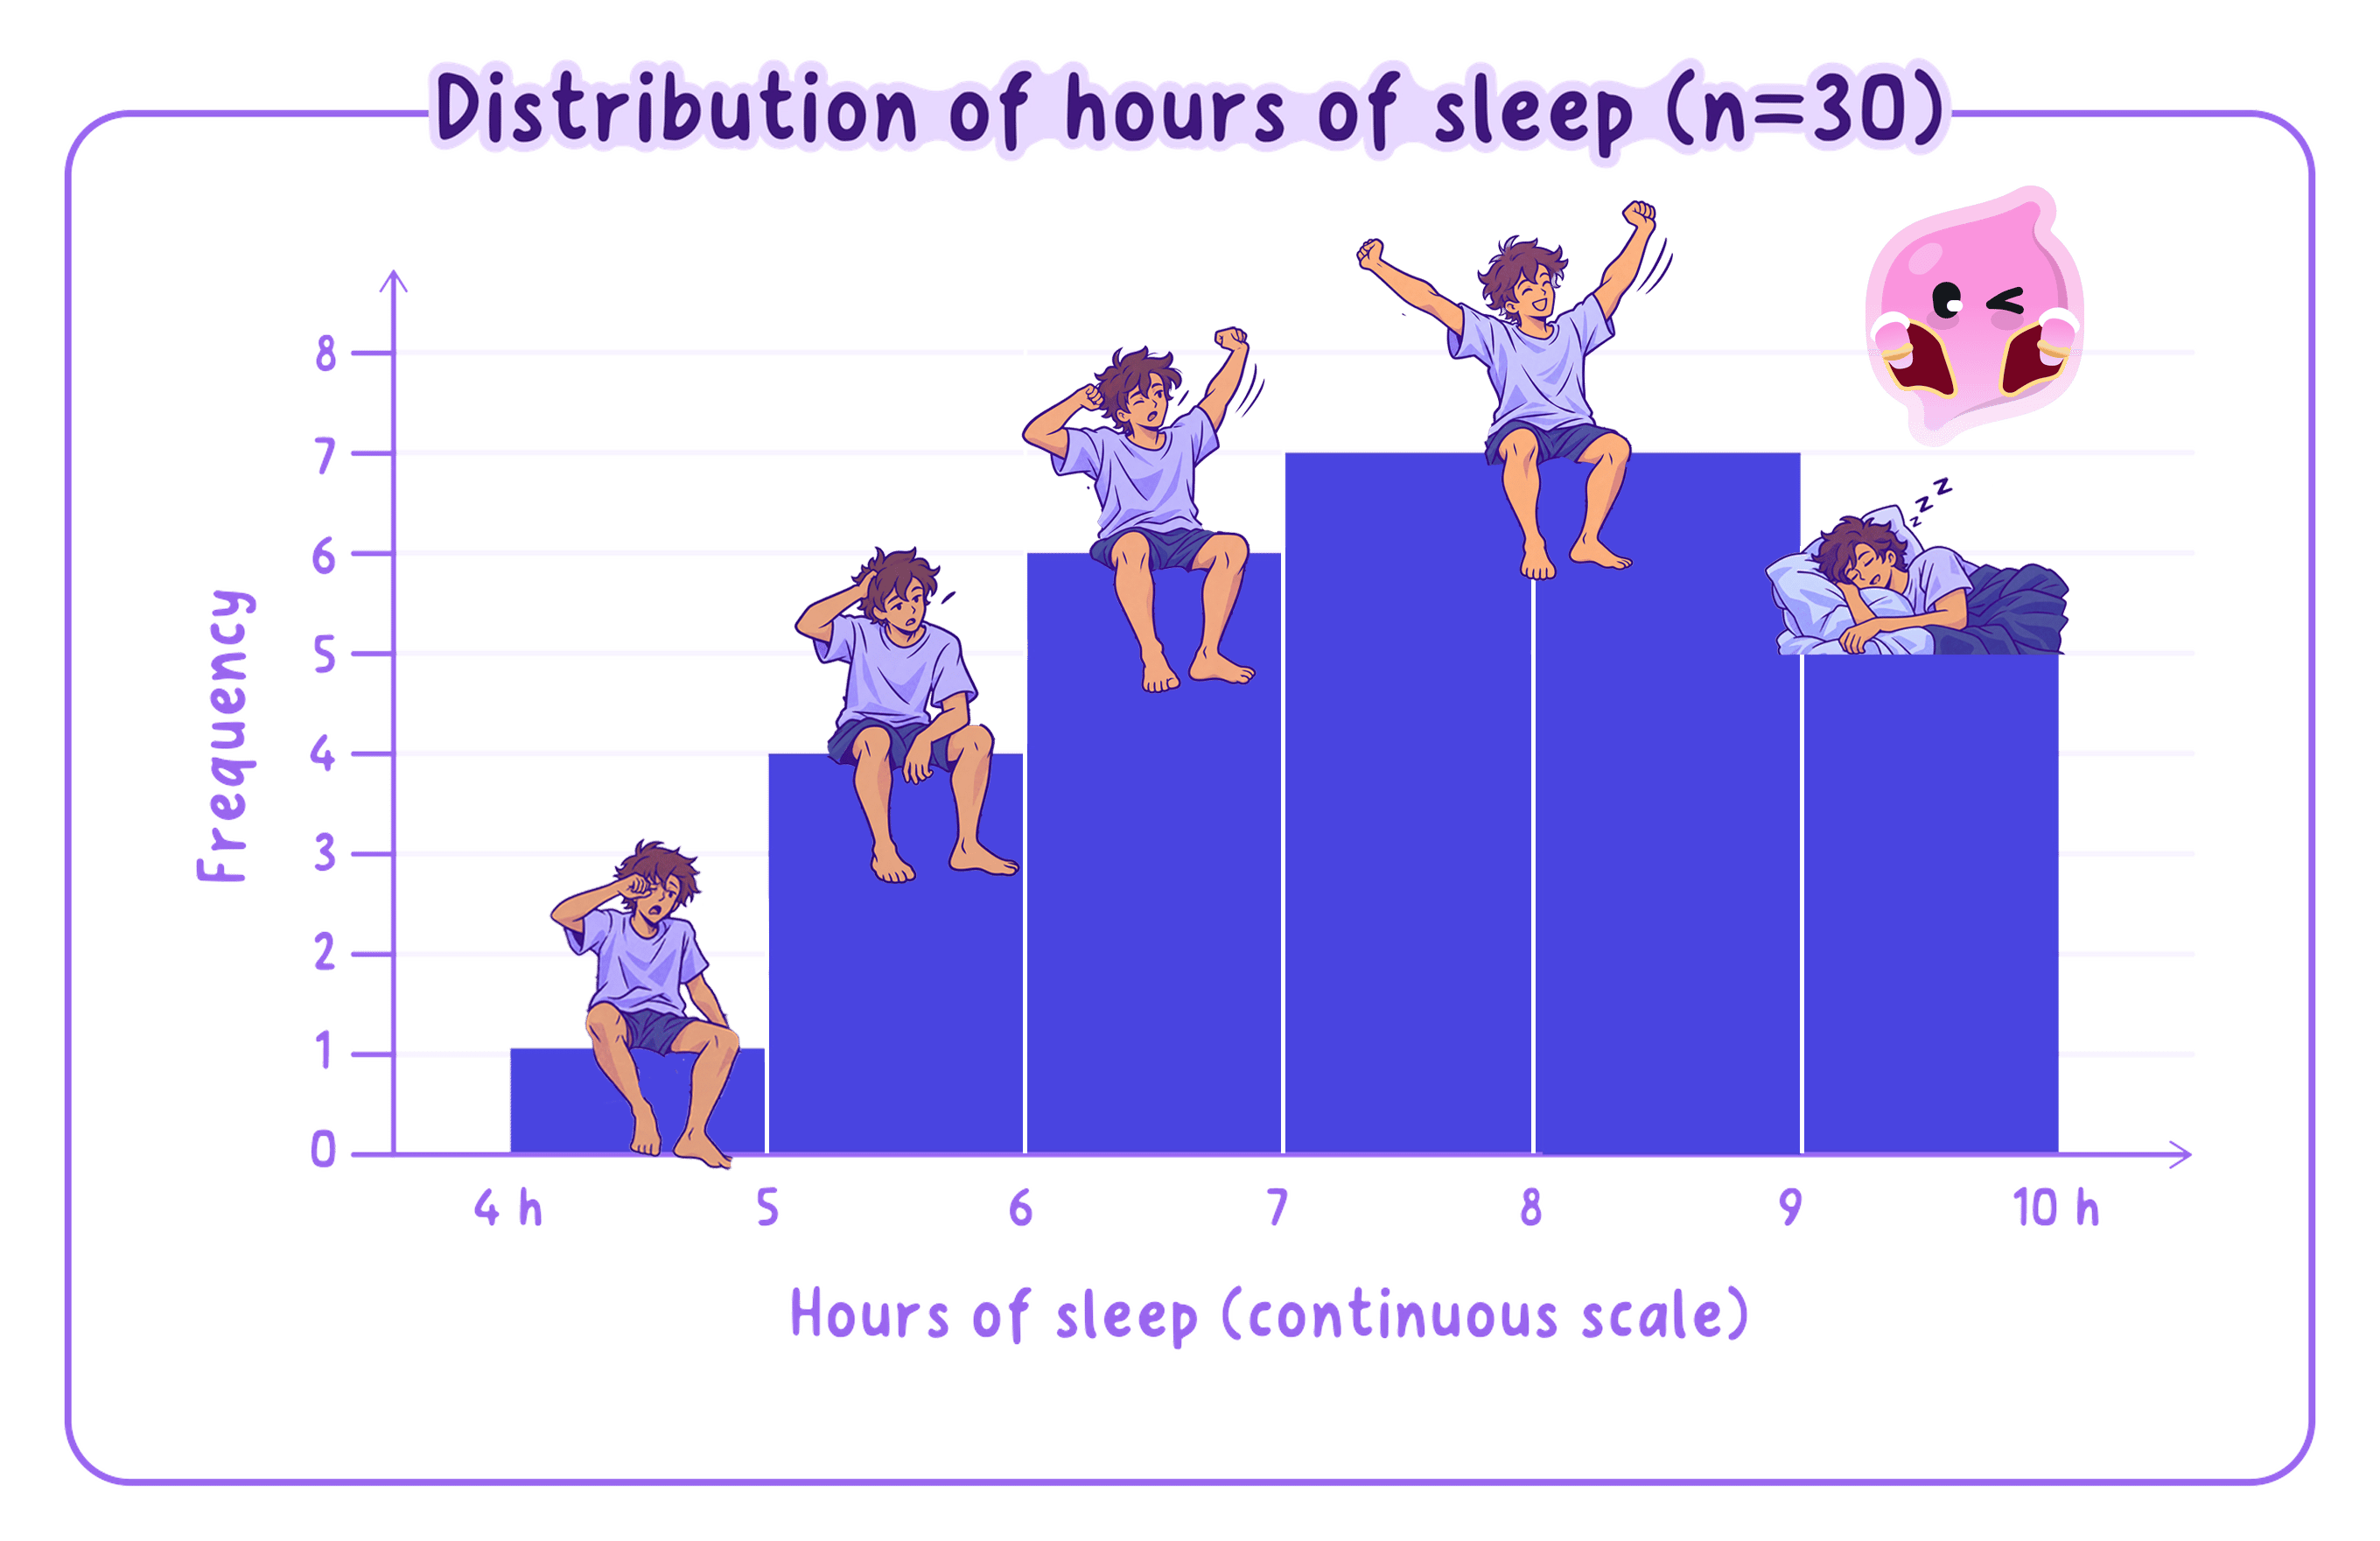
- Touching bars are what make a chart a histogram, so gaps between them turn it into a different chart.
- Data held in categories such as favourite colour belongs in a bar chart rather than a histogram.
- Equal intervals are what make the bar heights comparable, so intervals of different widths distort the picture.
Worked example: a histogram of reaction times
- Thirty pupils take a reaction-time test.
- Their times in seconds are grouped into equal intervals of 0.1 seconds.
Reaction time (s) | Frequency
0.2 to 0.3 | 4
0.3 to 0.4 | 11
0.4 to 0.5 | 9
0.5 to 0.6 | 6
- Put the continuous time scale on the horizontal axis and frequency on the vertical axis.
- Draw four bars of equal width at heights 4, 11, 9 and 6, each one touching the next.
- The 0.3 to 0.4 interval has the tallest bar, at 11, so more pupils reacted in that band than in any other.
- The four frequencies add to 4 + 11 + 9 + 6 = 30, matching the 30 pupils tested.
- Only 6 pupils took longer than 0.5 seconds, which you read straight off the last bar.
Scatter diagrams
Scatter diagram
A graph that plots two variables against each other, with one point for each participant, used to show the correlation between them.
- A scatter diagram plots two variables against each other, one on each axis.
- Each participant becomes a single point, fixed by both of their scores.
- The points are never joined up, because the pattern comes from where they sit.
- A scatter diagram is the standard way to display correlational data.
- The pattern the points make gives the type of correlation.
Worked example: screen time against sleep
- Six pupils record their daily screen time and how long they slept that night.
Screen time (h) | Sleep (h)
2 | 9.0
3 | 8.5
4 | 8.0
5 | 7.5
6 | 7.0
7 | 6.5
- Put screen time on the horizontal axis and sleep on the vertical axis, labelling both with their units.
- Plot one point per pupil, so the pupil with 5 hours of screen time and 7.5 hours of sleep sits at (5, 7.5).
- As screen time rises from 2 to 7 hours, sleep falls steadily from 9 to 6.5 hours.
- The points slope downwards to the right, so this is a negative correlation.
- Sleep drops by 0.5 hours for every extra hour of screen time in this sample.
Reading the correlation
Correlation
A relationship between two variables, where a change in one tends to go with a change in the other. It does not on its own show that one variable causes the other.
- Points rising to the right show a positive correlation, so as one variable goes up the other goes up too.
- Points falling to the right show a negative correlation, so as one goes up the other goes down.
- Points scattered with no clear slope show a zero correlation, meaning there is no relationship between the two variables.
- A scatter diagram keeps its points separate, since joining them into a line would make it a line graph.
- A neat pattern in a scatter still shows only that the two measures move together, rather than that one caused the other.
- More screen time might cut sleep, but a third factor such as a late bedtime could be driving both.
Pie charts
Pie chart
A circle divided into slices, where each slice shows one category's share of the whole.
- A pie chart is a circle split into slices, and a bigger slice means a bigger share of the whole.
- Work out each share as a fraction of the total, then turn that fraction into a percentage.
- In a dream study, 20 recorded dreams sort into three types.
Dream type | Number | Share
Falling | 10 | 50%
Being chased | 6 | 30%
Flying | 4 | 20%
- Falling dreams are 10 out of 20, which is 50%, so their slice fills half the circle.
- The three slices add to 20 dreams and to 100%, and that total is your check that no dream is missing.
- The pie chart makes the split obvious, with falling dreams filling half the circle and the other two types sharing the rest.
- Being chased is 6 out of 20, which is 30%, so that slice takes just under a third of the circle.
- Flying is 4 out of 20, which is 20%, the smallest slice of the three.
Line graphs
Line graph
A graph with points joined by a line, used to show how a measurement changes across a continuous scale such as time.
- A line graph joins points with a line, so a rising line means an increase and a falling line a decrease.
- Use it when the horizontal axis is a continuous scale such as time.
- A class's mean test score is tracked across five weeks of a revision programme.
Week | Mean score
1 | 40
2 | 48
3 | 55
4 | 62
5 | 70
- Plot week on the horizontal axis and mean score on the vertical axis, then join the points in order.
- The line climbs from 40 in week 1 to 70 in week 5, a rise of 30 marks.
- The mean rises every week, so the trend is a steady improvement rather than one sudden jump.
- The largest single step is 8 marks, from 40 to 48 between weeks 1 and 2 and again from 62 to 70 between weeks 4 and 5.
Choosing the right chart
- Frequency table: counts how often each value or category comes up.
- Bar chart: compares separate categories side by side.
- Histogram: shows continuous data grouped into intervals.
- Pie chart: breaks a total down into its parts.
- Line graph: tracks a change or trend over time.
- Scatter diagram: shows the correlation between two variables.
- Every chart carries a title and a label on each axis, so a reader can tell what was measured.
- The same data can often be shown in more than one way, so 20 dreams sorted into three types would work as a bar chart or as a pie chart.
- A pie chart shows shares of a whole and cannot show how big that whole was, so 50% of 20 dreams and 50% of 200 dreams look identical.
Turning this into marks
- A sketched chart earns credit for its title as well as for both axis labels, so all three go in before the data is plotted.
- When a chart and a reason are both asked for, keep them as two separate points, one naming the chart and one naming the type of data it suits.
- Name the type of correlation and then say what it means for the two variables, because "there is a correlation" does not secure the knowledge mark.
- The mark most often lost is joining scatter points into a line, when the pattern comes from where the points sit.
- What must the frequencies in a completed frequency table add up to?
- Why do the bars of a bar chart have gaps while the bars of a histogram touch?
- Besides plotting the data, what else does a sketched chart need?
- What pattern of points shows a negative correlation?
- Would you use a pie chart or a line graph to show mean scores changing over five weeks?