This article covers 3.1.4 Research methods of the AQA GCSE Psychology specification.
Turning Numbers into Pictures
- Once you have collected quantitative data, you display it so a pattern is easy to see at a glance.
- The main displays are frequency tables, bar charts, histograms and scatter diagrams.
- The type of data decides which display fits, so choosing the right one is part of the skill.
Key Idea
- A good display makes the result clear without changing what the numbers say.
- Match the display to the data: separate categories, continuous groups, or two variables per person.
Frequency Tables
- A frequency table records how many times each value or category appears, often built up with tally marks as data comes in.
- It is a tidy first step, because it organises raw data before you draw a chart or work out an average.
Bar Charts
- A bar chart shows data for separate categories, where the height of each bar gives the value.
- The bars are drawn with gaps between them, because the categories are distinct and not a continuous scale.
Example
- To compare mean recall in silence versus with music, you draw one bar for each condition and read the values off the vertical axis.
- The taller bar shows the condition with the higher score, so the difference is clear at a glance.
Histograms
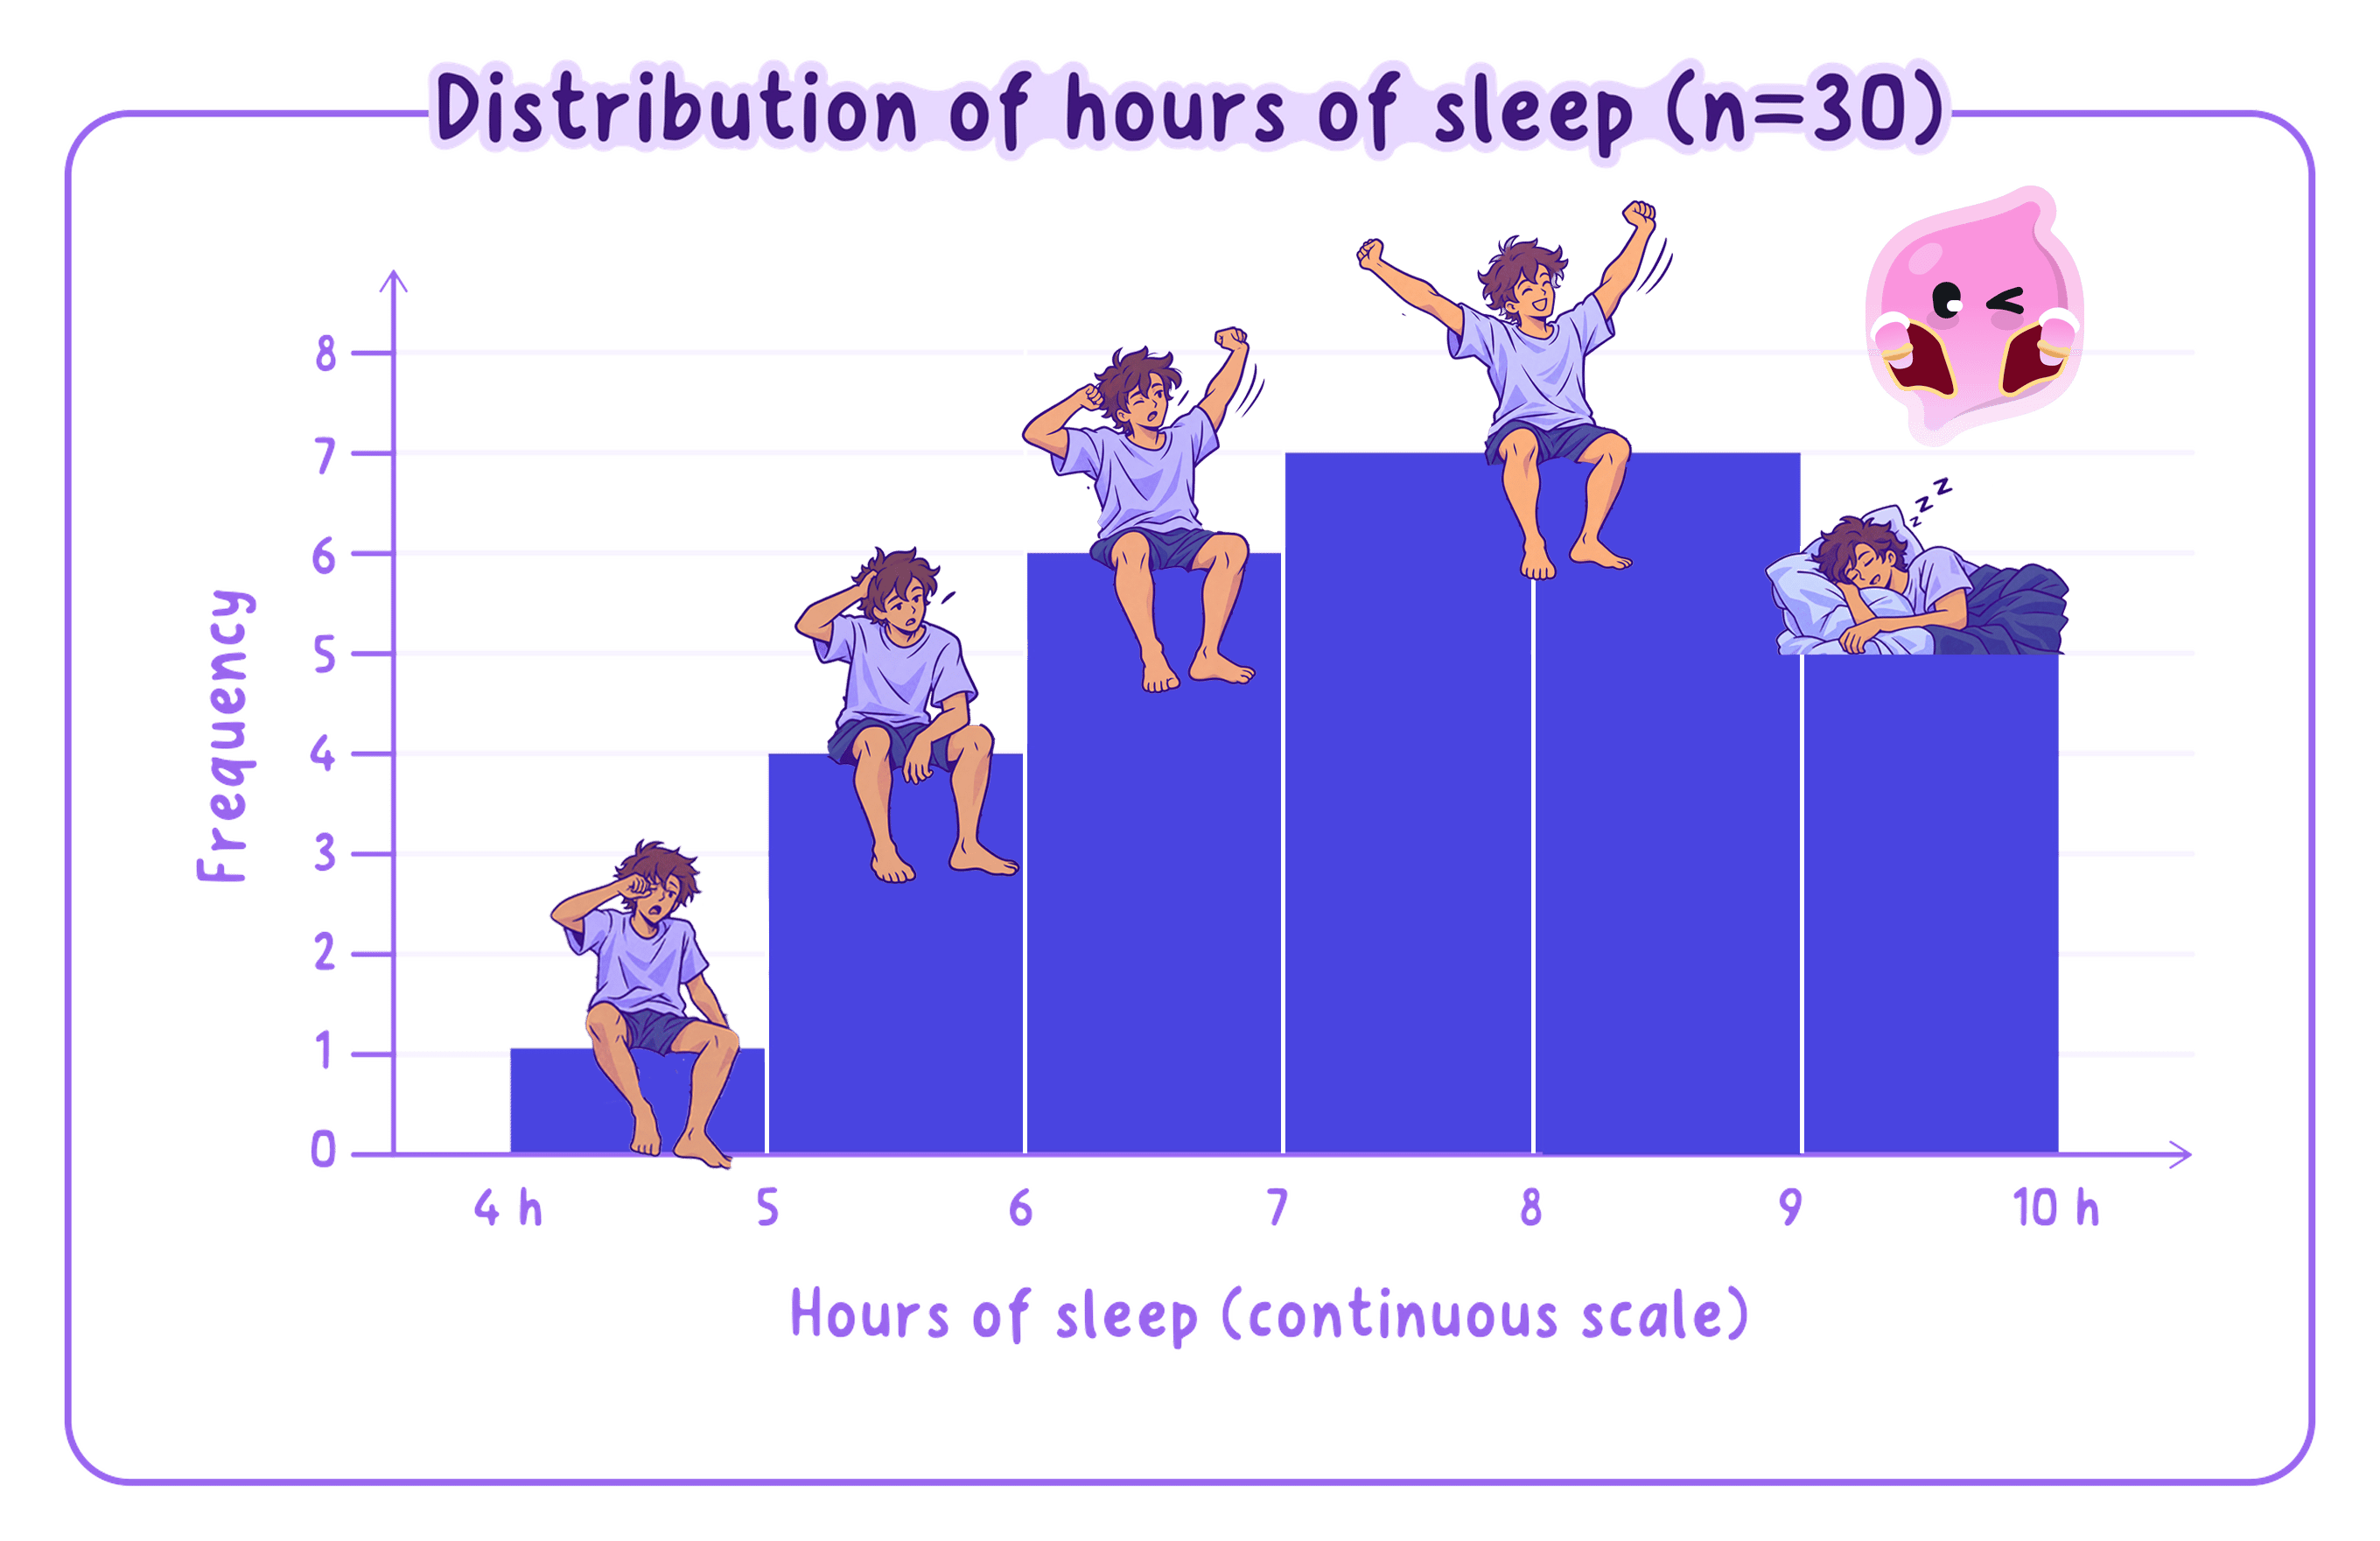
- A histogram shows continuous data grouped into intervals, such as reaction times sorted into bands.
- Its bars touch, because the intervals join up along a continuous scale.
Common Mistake
- Do not confuse a bar chart with a histogram: bar charts have gaps for separate categories, histograms have touching bars for continuous data.
- Check the data type first, then decide which of the two is correct.
Scatter Diagrams and Correlation
- A scatter diagram plots two variables against each other, with one point for each participant, to show the correlation between them.
- A positive correlation shows points rising together, a negative correlation shows one rising as the other falls, and scattered points with no pattern show no correlation.
- A correlation on its own does not prove that one variable causes the other.
Example
- Plotting hours of sleep against test scores, points that rise from bottom-left to top-right show a positive correlation.
- Even a clear line does not prove sleep causes the higher scores, because a third factor could explain both.
Reading and Interpreting a Display
- Start with the axes or headings, so you know exactly what has been measured and in what units.
- Describe the overall pattern, such as which category is highest or which way a correlation runs.
- Quote specific values from the display to support what you say, rather than describing it vaguely.
Common Mistake
- Read the scale carefully, because gridlines do not always go up in ones.
- Describe a correlation by its direction and strength, not as proof that one thing causes another.
In the Exam
- Choose the display that fits the data: bar chart for separate categories, histogram for continuous data, scatter diagram for two variables.
- When you draw one, label both axes and use a sensible, even scale.
- When you interpret one, name the pattern and back it with a value read from the display.
Self review
- When would you use a bar chart rather than a histogram?
- What does a scatter diagram show, and what is plotted for each participant?
- Describe the difference between a positive and a negative correlation.
- Why does a correlation not prove cause and effect?