Question 2
FThe Figure shows the arrangement of particles in one substance in three different states, A, B and C.
Figure
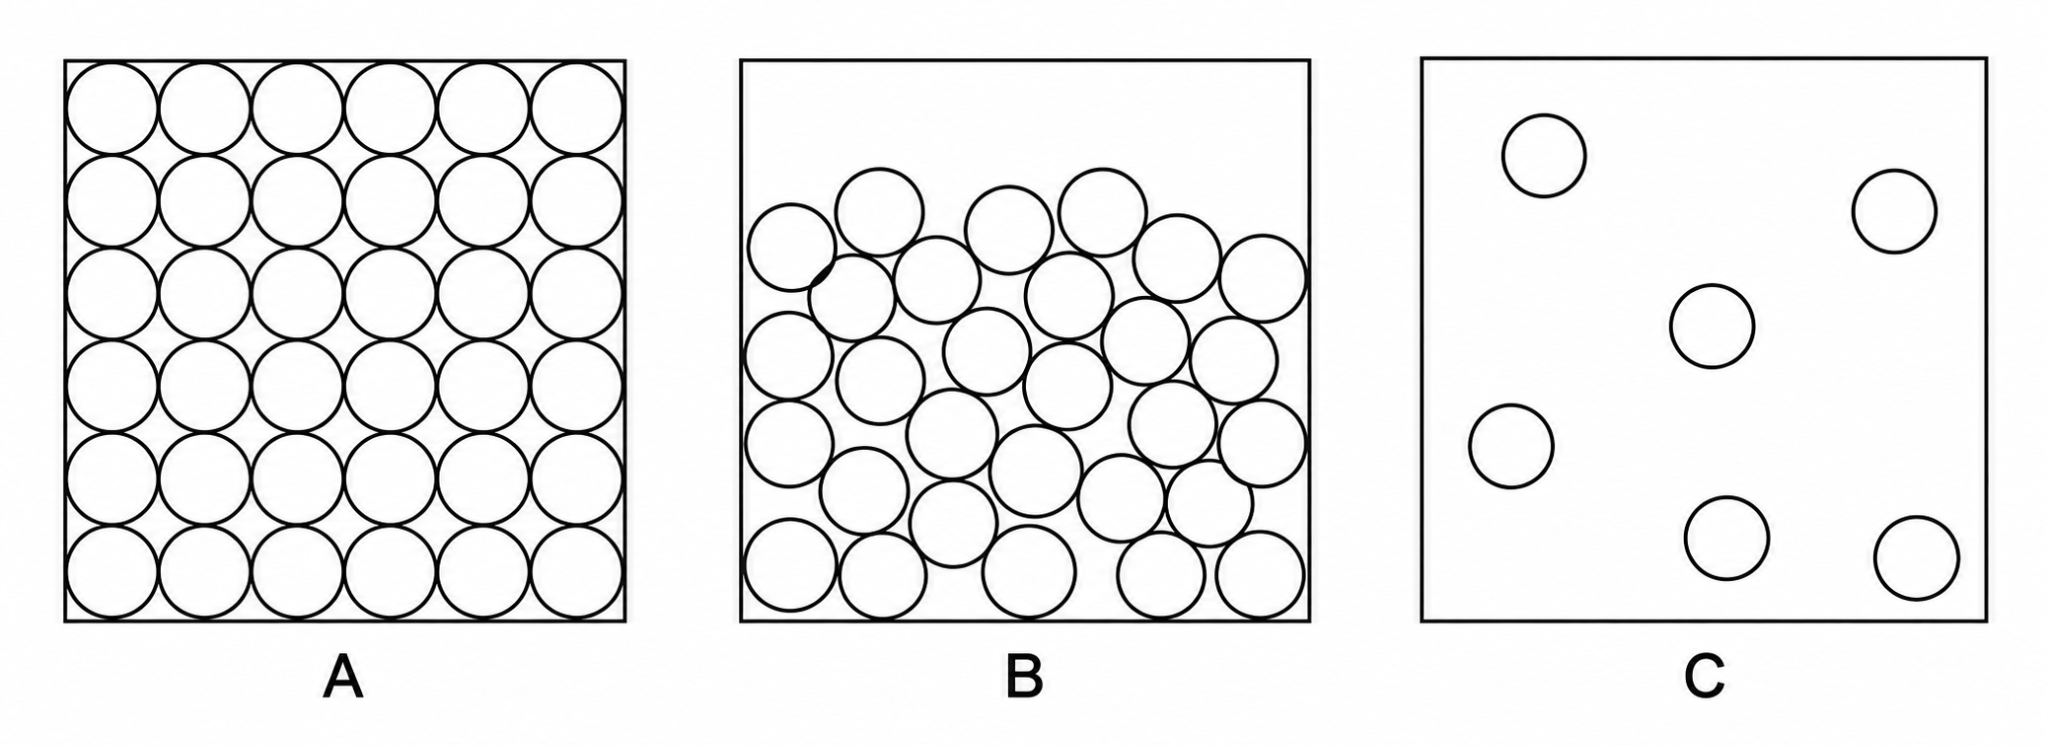
The Table shows the density of the substance in each state.
Table
| State | Density in kg/m3\text{kg/m}^3kg/m3 |
|---|---|
| solid | 1600 |
| liquid | 1400 |
| gas | 2.5 |
a.[1]
Which box, A, B or C, shows the substance as a gas?
b.[2]
Explain why the density of the gas is much lower than the density of the liquid.
Use ideas about particles in your answer.
c.[2]
The density of the solid is only a little greater than the density of the liquid.
Explain why.
1.1 The particle model Questions
44 exam-style questions on OCR GCSE Physics 1.1 The particle model, covering 1.1.1 Development of the atomic model, 1.1.2 Structure of the atom, 1.1.3 The size of atoms and small molecules, 1.1.4 Density, 1.1.5 Density and the states of matter, and 1.1.6 Density, mass and volume. Each one has a worked solution and a mark scheme showing where the marks go.