Question 6
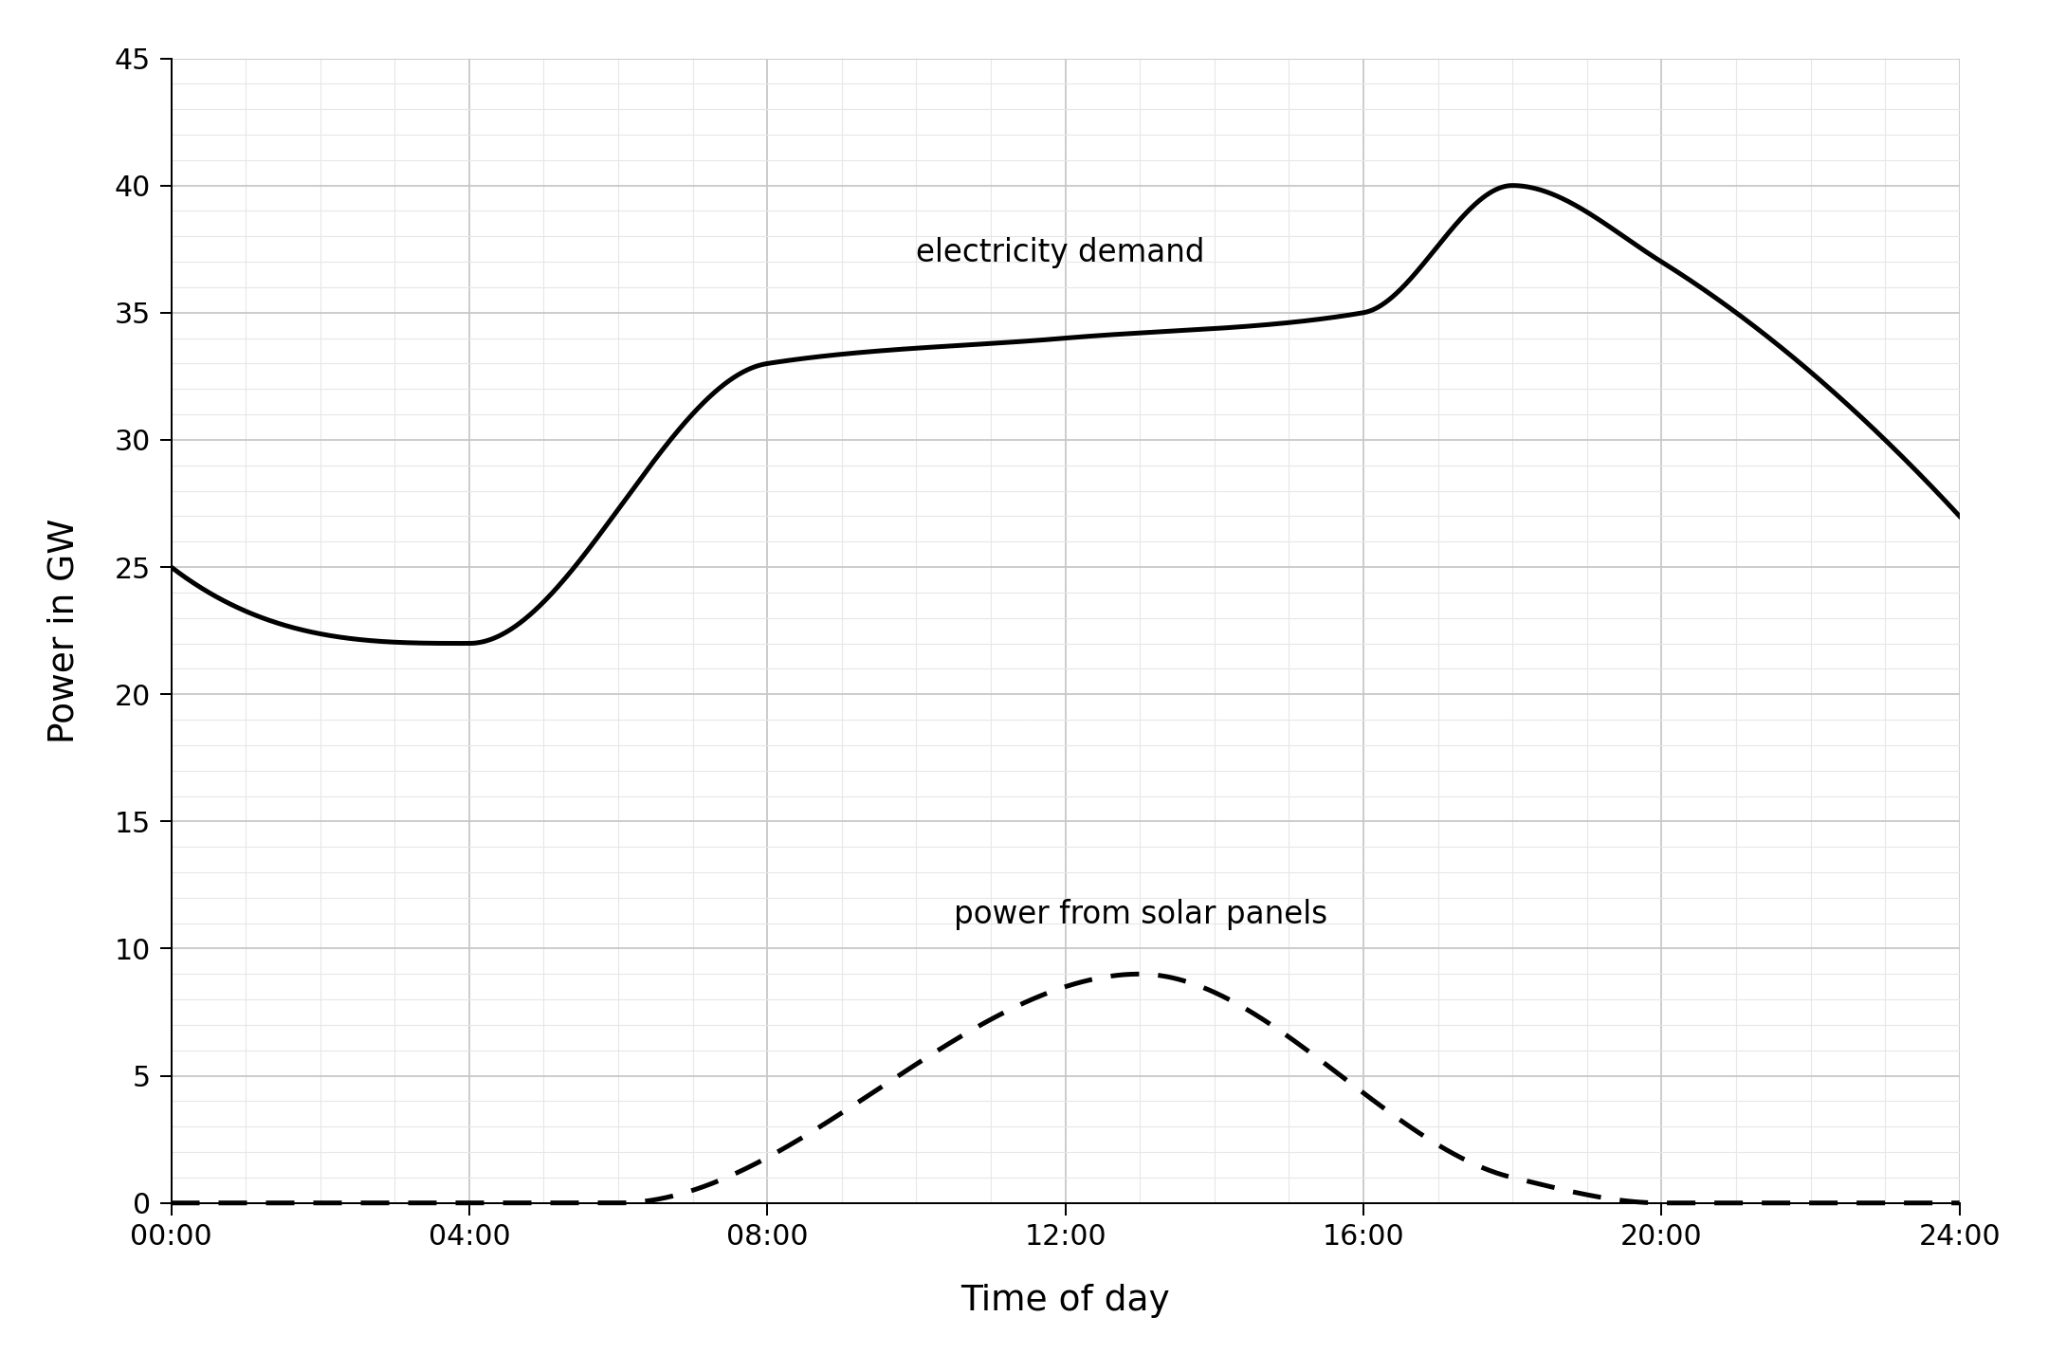
FThe Figure shows the electricity demand in a country during one day. It also shows the power produced by all of the country's solar panels on the same day.
Figure
a.[1]
Use the Figure to give the time of day when the electricity demand is greatest.
b.[1]
Use the Figure to determine the difference between the greatest and the smallest electricity demand during the day.
c.[2]
Explain why solar panels cannot be used to meet the demand for electricity at 18:0018{:}0018:00.
d.[2]
Gas-fired power stations and hydroelectric power stations are used to meet the increase in demand between 16:0016{:}0016:00 and 18:0018{:}0018:00. Nuclear power stations are not used for this.
Suggest why.
8.2 Powering Earth Questions
16 exam-style questions on OCR GCSE Physics 8.2 Powering Earth, covering 8.2.1 Renewable and non-renewable energy resources, 8.2.2 Patterns and trends in energy use, 8.2.3 The national grid, 8.2.4 Step-up and step-down transformers, 8.2.5 Efficiency of the national grid, 8.2.6 Transformers and power transmission at high voltage, 8.2.7 The UK domestic supply, 8.2.8 Direct and alternating potential difference, 8.2.9 Live, neutral and earth wires, and 8.2.10 Dangers of mains electricity. Each one has a worked solution and a mark scheme showing where the marks go.