Beyond Earth

EasyMediumHard
12345678
Question 6
Hard

This graph shows how a planet's orbital period changes with its orbital distance from its host star in the TRAPPIST-1 exoplanetary system.
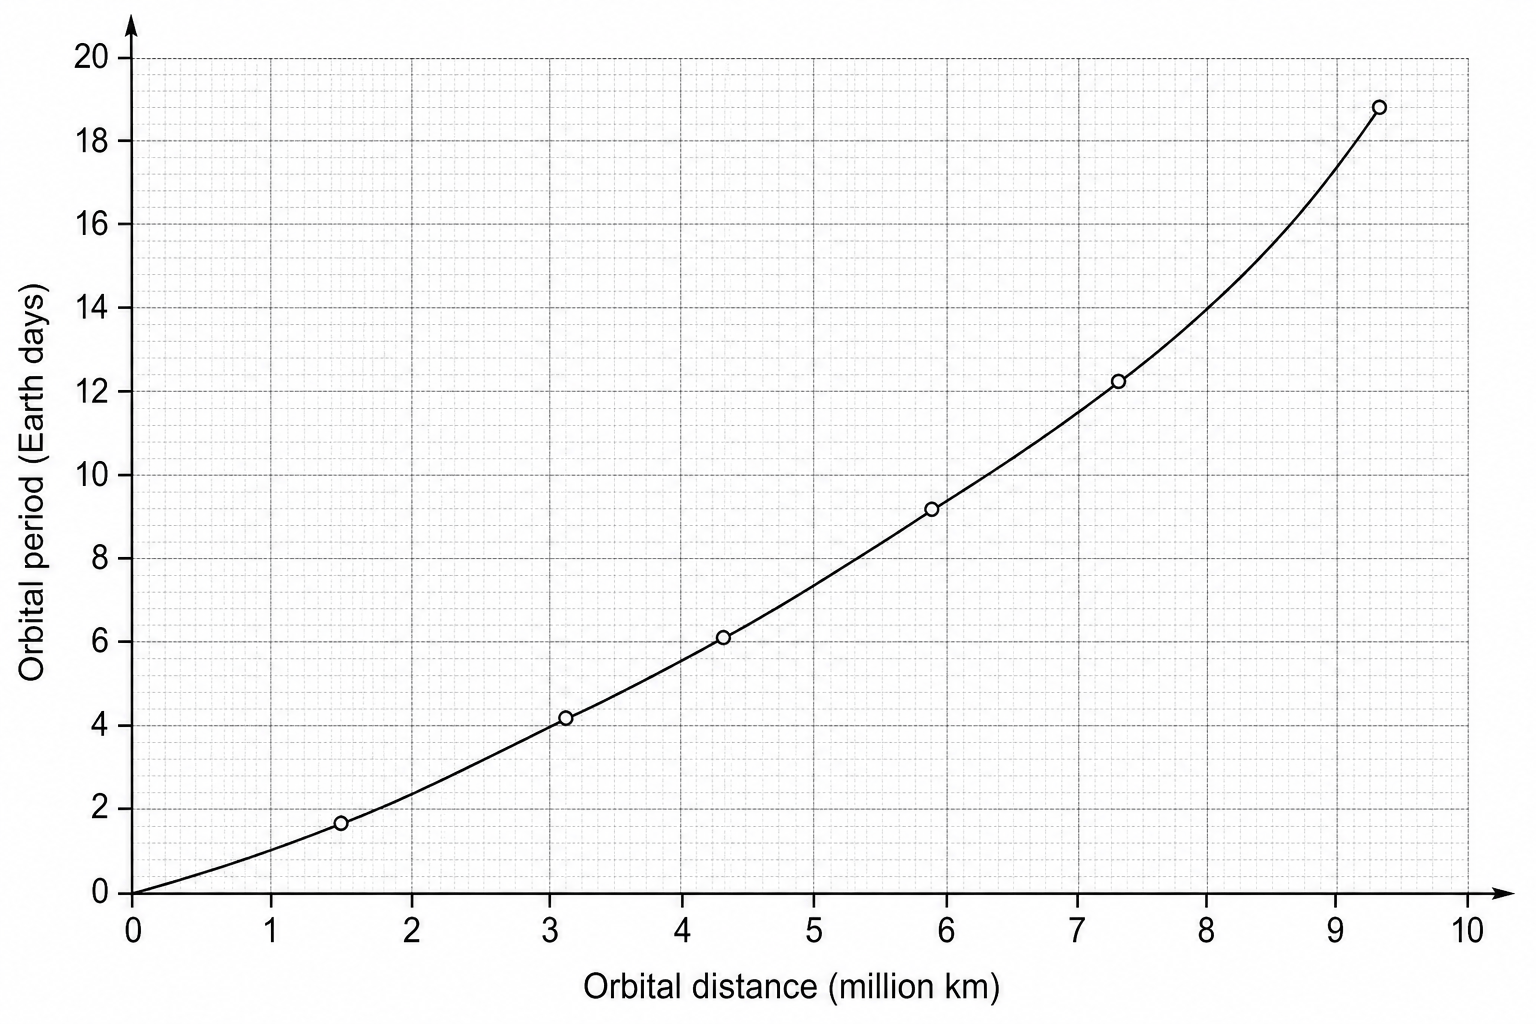
A graph plotting the orbital period in Earth days on the y-axis against the orbital distance in million kilometers on the x-axis for planets orbiting the TRAPPIST-1 star. The x-axis is labeled from 0 to 10 with increments of 1, and minor subdivisions of 0.1. The y-axis is labeled from 0 to 20 in increments of 2, and minor subdivisions of 0.2. The curve starts at (0,0) and rises with an increasing gradient, passing through the points (1.7, 1.5), (3.4, 4.1), (4.4, 6.1), (5.8, 9.2), (7.0, 12.3), and (9.3, 18.8).

Describe and explain the relationship shown by the graph.

Use data from the graph and ideas about gravity and planetary orbits in your answer.

[6]

Beyond Earth Questions

  1. GCSE
  2. /Physics
  3. /Beyond Earth