An oscilloscope is used to display the waveform of the standard domestic mains electricity supply in the UK, as shown in the diagram.
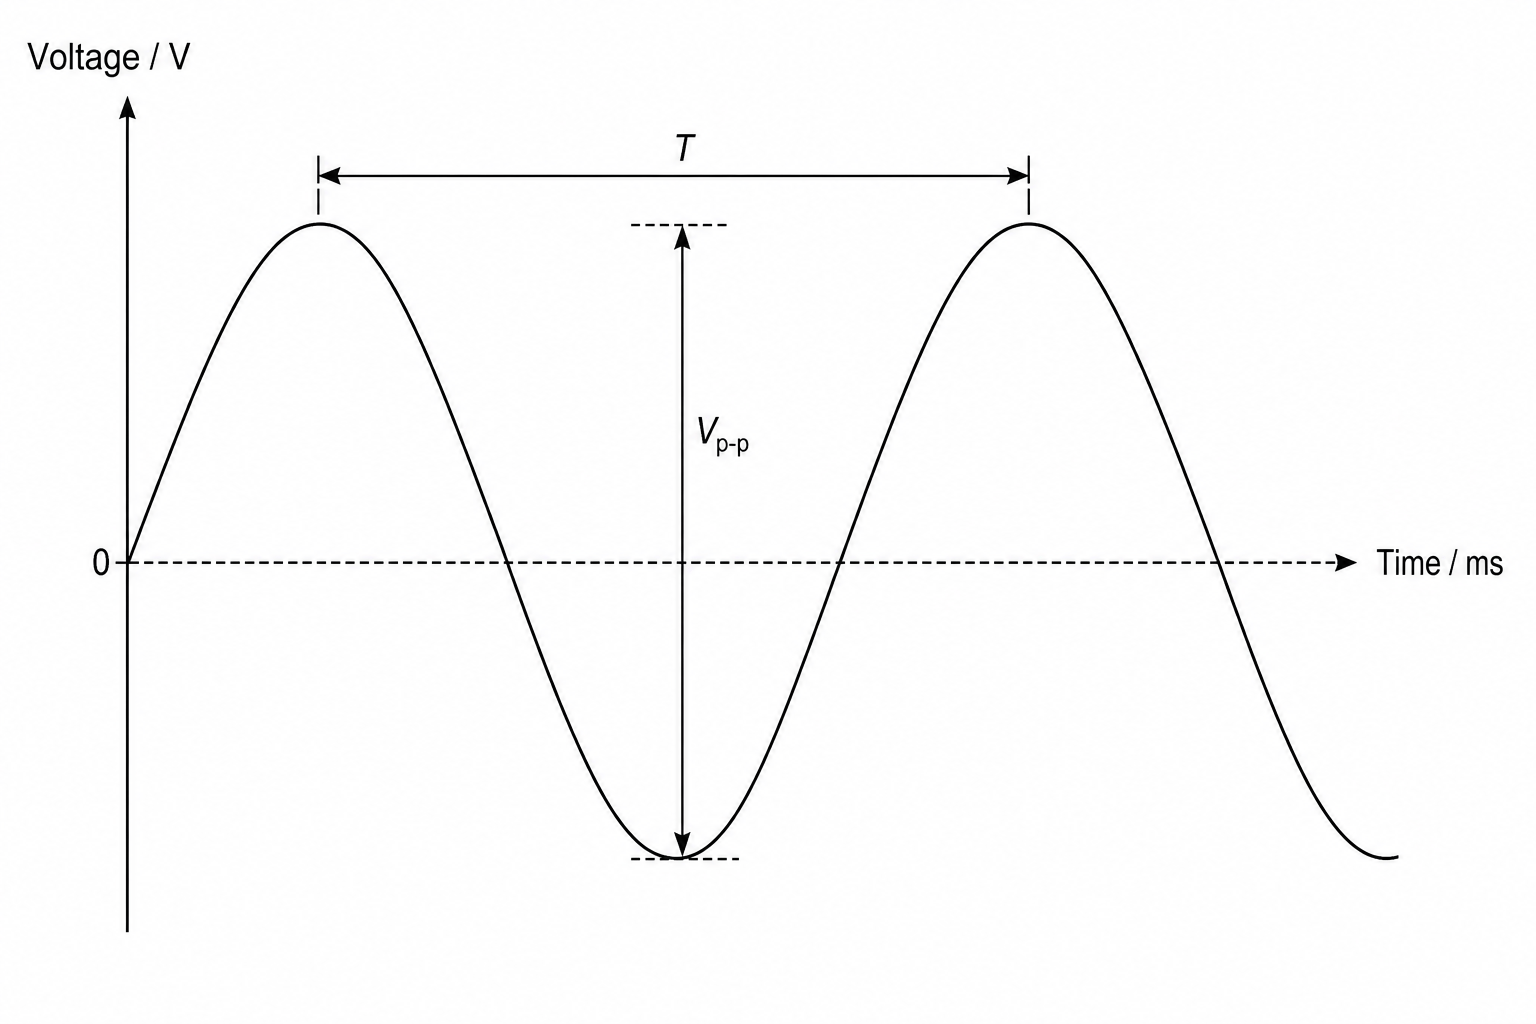
What are the values of the peak-to-peak voltage Vp-pV_{\text{p-p}}Vp-p and the time period T T\,T of this supply?
Vp-p=325 VV_{\text{p-p}} = 325\text{ V}Vp-p=325 V, T=20 msT = 20\text{ ms}T=20 ms
Vp-p=650 VV_{\text{p-p}} = 650\text{ V}Vp-p=650 V, T=20 msT = 20\text{ ms}T=20 ms
Vp-p=650 VV_{\text{p-p}} = 650\text{ V}Vp-p=650 V, T=50 msT = 50\text{ ms}T=50 ms
Vp-p=460 VV_{\text{p-p}} = 460\text{ V}Vp-p=460 V, T=20 msT = 20\text{ ms}T=20 ms