Mains electricity and safety

EasyMediumHard
1234567891011121314151617
Question 10
Easy

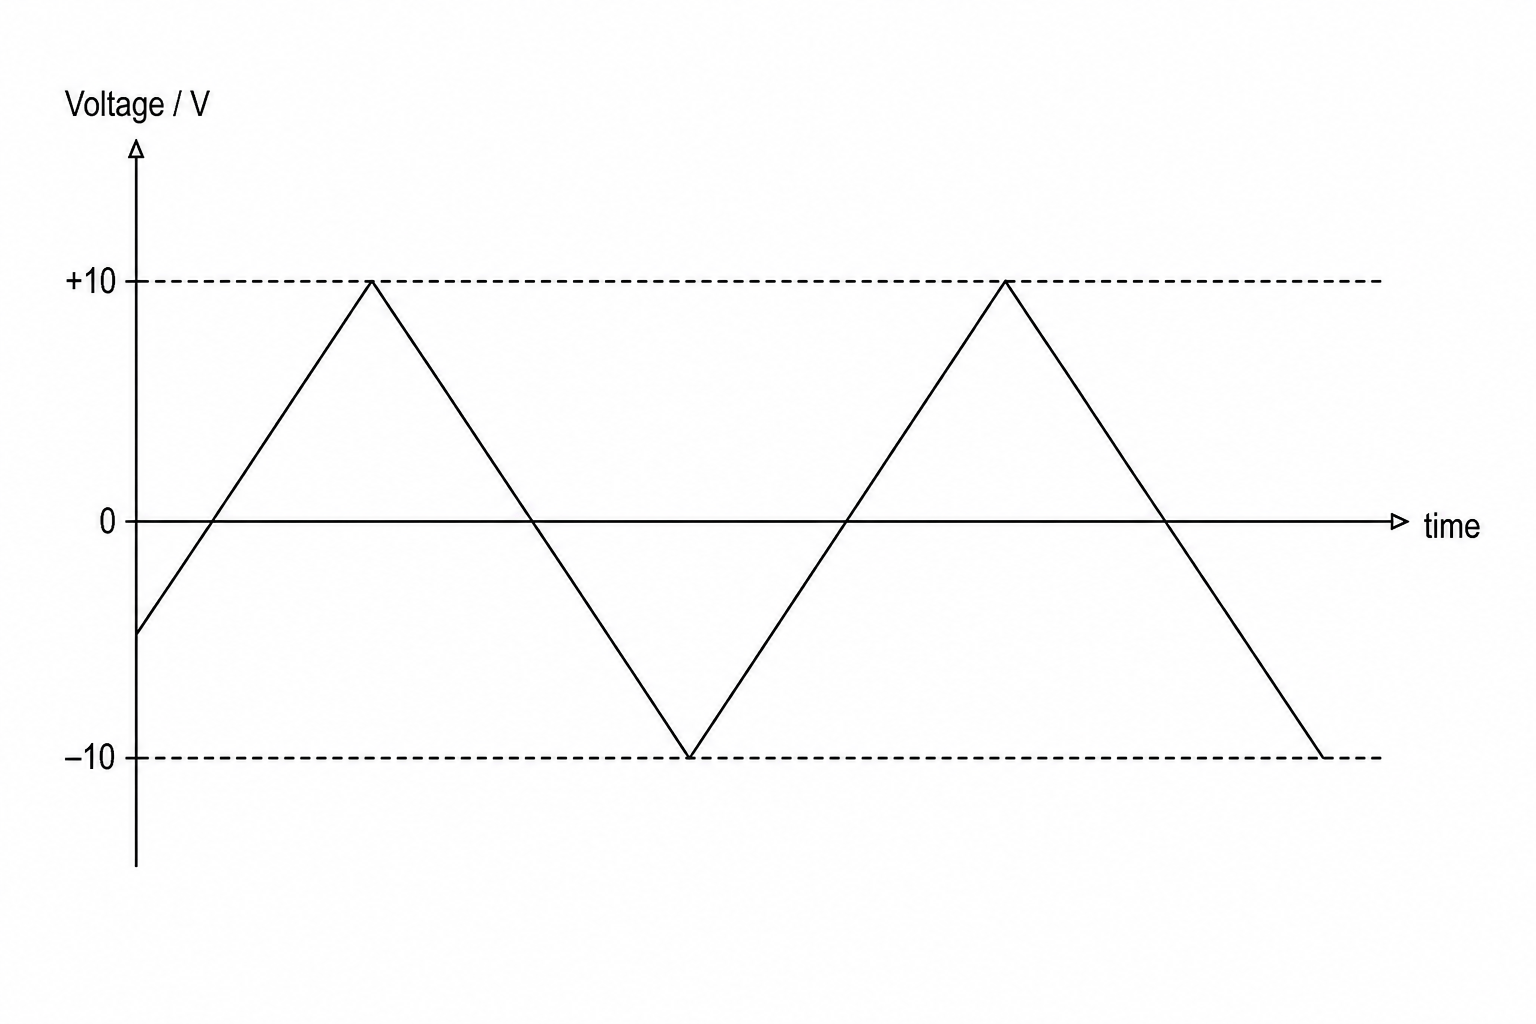
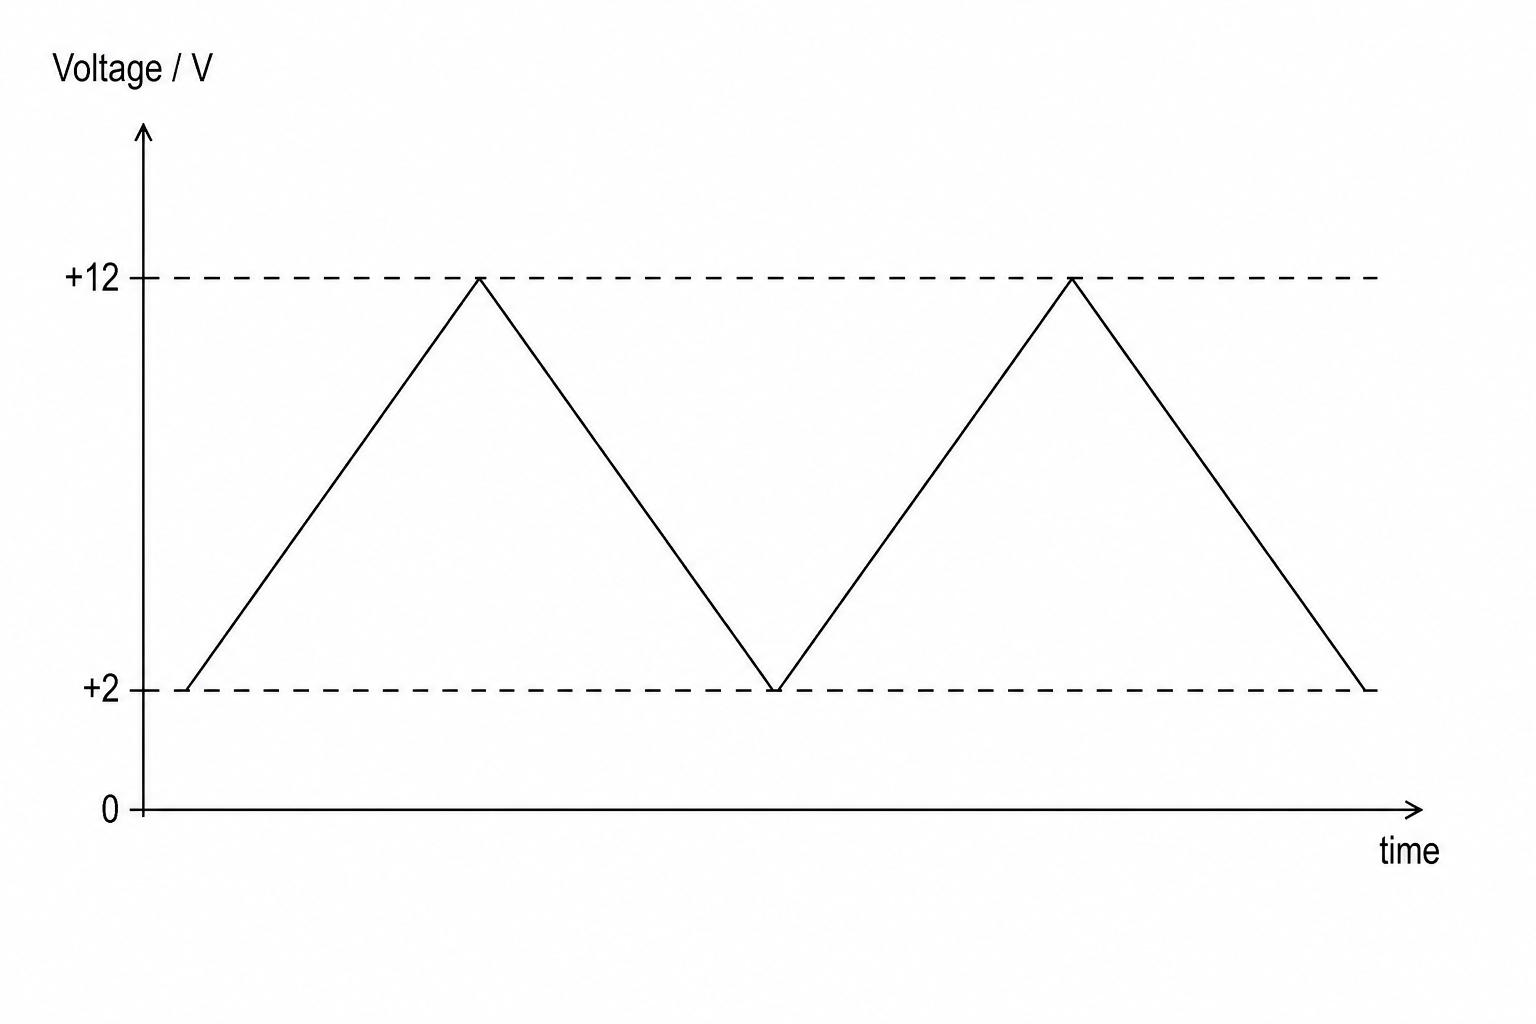
Figure 1 and Figure 2 show how two different voltages applied across a resistor vary with time.

Figure 1: A graph showing voltage on the y-axis and time on the x-axis. The line forms a symmetric triangular wave that alternates regularly between a peak value of +10 V and a trough value of -10 V, repeatedly passing through 0 V.

Figure 2: A graph showing voltage on the y-axis and time on the x-axis. The line forms a triangular wave that fluctuates repeatedly between a minimum of +2 V and a maximum of +12 V, remaining entirely in the positive region of the axis.

Explain which of the voltages in Figure 1 and Figure 2 will cause an alternating current (a.c.) in the resistor.
[2]

Mains electricity and safety Questions

  1. GCSE
  2. /Physics
  3. /Mains electricity and safety