Skip to content

Course home

Efficiency and energy resources

Efficiency and energy resources

3.2.1 Dissipation of energy

Dissipation: energy spreads into less useful stores

Definition

Dissipation

Dissipation is the spreading of transferred energy into the thermal energy stores of the surroundings, which makes the energy less useful for further transfers.

  1. Energy is conserved: the total amount of energy in a closed system does not decrease.
  2. During every real transfer, some energy enters the intended useful store and some is transferred to other stores.
  3. Energy that is dissipated is still present, but it is spread among many particles in the surroundings and is difficult to transfer usefully again.

Mechanical processes warm objects and surroundings

  1. When surfaces move against each other, friction acts opposite to the motion.
  2. Work is done against friction, transferring energy from kinetic or other mechanical stores to the thermal energy stores of the surfaces and their surroundings.
  3. The temperature rises because the average kinetic energy of particles in the warmed materials increases.
  4. Air resistance produces the same overall effect because moving objects do work against drag and transfer energy to the thermal energy stores of the air and the object.
Key Idea

A mechanical process becomes wasteful when heating caused by friction or drag transfers energy away from the intended useful store.

Energy becomes less useful, not destroyed

  1. A moving bicycle eventually stops because energy from its kinetic store is transferred by friction in the brakes, tyres and bearings, and by air resistance, to thermal stores.
  2. A filament lamp transfers electrical energy usefully by radiation as visible light, while much more is transferred by infrared radiation and heating to the surroundings.
  3. In an electric motor, electrical energy is transferred usefully to a kinetic store, while resistance in the wires and friction in moving parts increase thermal stores.
  4. In each example, the surroundings cool only by spreading that thermal energy through an even larger region, so the energy becomes still less concentrated.
Example
  • A motor receives 500 J500\ \text{J}500 J of electrical energy and transfers 350 J350\ \text{J}350 J to the kinetic energy store of a load.
  • The dissipated energy is the remainder:
  • Edissipated=500 J−350 J=150 JE_{\text{dissipated}}=500\ \text{J}-350\ \text{J}=150\ \text{J}Edissipated​=500 J−350 J=150 J
  • The 150 J150\ \text{J}150 J is mainly transferred to thermal stores by electrical resistance, friction and sound.

Descriptions must name the transfer and destination

  1. A complete explanation identifies the initial energy store or input, the intended useful transfer, the unwanted transfer mechanism and the thermal store that gains energy.
  2. Write that energy is transferred or dissipated, not that it is used up, lost or destroyed.
Exam technique
  • For a braking question, link the chain directly: friction does work, the brakes and surroundings warm, and energy from the kinetic store is dissipated into thermal stores.
  • When asked why dissipated energy is less useful, state that it is spread through the surroundings and is difficult to transfer back into a useful store.

Common errors change the physics

  1. Do not say friction creates energy; friction transfers energy between stores.
  2. Do not call all thermal energy wasted because heating can be the intended useful transfer in a kettle or heater.
Common Mistake
  • Do not write that energy disappears when an object stops; its kinetic store decreases while thermal stores increase.
  • Do not confuse energy dissipation with a failure of conservation of energy.

Check your explanation against conservation

  1. The sum of all useful and unwanted energy transfers equals the total energy supplied.
  2. Any energy-accounting diagram must therefore have equal total input and total output energies, even when much of the output is dissipated.
Self review
  • What is energy dissipation?
  • Why does friction raise the temperature of surfaces?
  • Why is energy in the thermal stores of the surroundings less useful?
  • Describe the energy transfers when a moving bicycle brakes.

3.2.2 Reducing unwanted energy transfers

Reducing unwanted transfers keeps energy useful

Definition

Lubrication

Lubrication is the use of a substance, such as oil or grease, between moving surfaces to reduce friction and the unwanted transfer of energy by heating.

Definition

Thermal insulation

Thermal insulation is the use of materials or structures that reduce the rate of energy transfer by heating.

  1. Reducing unwanted transfers increases the fraction of the input transferred usefully without creating energy.
  2. The correct method depends on whether the unwanted pathway is friction, conduction, convection or infrared radiation.

Lubrication reduces heating by friction

  1. Oil or grease separates moving surfaces so their microscopic irregularities make less direct contact.
  2. The frictional force falls, so less work is done against friction and less energy enters thermal stores.
  3. Bearings, gears and engine parts therefore run cooler and more input energy remains available for useful motion.
Key Idea

Lubrication reduces dissipation by reducing friction between moving surfaces.

Building insulation slows cooling

  1. Loft insulation traps air and reduces conduction through the roof.
  2. Cavity-wall insulation traps air in small pockets, reducing conduction and preventing large convection currents.
  3. Double glazing uses a trapped gas layer to reduce conduction and convection through windows.
  4. Draught proofing reduces convection by stopping warm air escaping through gaps.
  5. Reflective foil reduces net infrared transfer into an outside wall because its shiny surface has low emissivity.

Thickness and conductivity control the rate

Definition

Thermal conductivity

Thermal conductivity is a measure of how readily a material transfers energy by conduction.

  1. Lower thermal conductivity means less energy is transferred each second for the same area, thickness and temperature difference.
  2. Greater wall thickness increases the conduction distance, so the rate of energy transfer and rate of cooling decrease.
  3. A thick layer of low-conductivity material therefore slows cooling more than a thin layer of a good conductor.
Example
  • Two identical houses have the same wall area and temperature difference.
  • The house with a thicker layer of low-conductivity foam cools more slowly because the conduction path is longer and the foam transfers energy less readily.

Insulation choices have costs and limits

  1. Payback time compares installation cost with the annual saving:
  2. payback time=installation costsaving per year\text{payback time}=\frac{\text{installation cost}}{\text{saving per year}}payback time=saving per yearinstallation cost​
  3. Thicker insulation usually gives progressively smaller extra savings, so cost and available space affect the choice.
Exam technique
  • For a wall question, link greater thickness to a longer conduction path and lower thermal conductivity to less energy transferred each second.
  • Use rate of energy transfer or rate of cooling, not only that insulation keeps heat in.

Keep the mechanisms distinct

Common Mistake
  • Insulation reduces energy transfer; it does not stop it completely.
  • Trapped air insulates only when it cannot circulate freely and form convection currents.
  • Thermal conductivity is a material property, not a temperature.
  1. Lubrication applies to moving surfaces, while insulation applies where there is a temperature difference.
  2. A valid improvement must act on the named unwanted transfer pathway.
Self review
  • How does lubrication reduce unwanted transfers?
  • What does thermal conductivity measure?
  • How does increasing wall thickness affect cooling rate?
  • Give two insulation methods and the transfer each reduces.

3.2.3 Efficiency

Efficiency compares useful output with total input

Definition

Efficiency

Efficiency is the ratio of useful energy transferred by a device to the total energy supplied to it.

  1. Efficiency has no unit because it is a ratio of energies measured in the same unit.
  2. It lies between 000 and 111, or between 0%0\%0% and 100%100\%100%.

Calculate efficiency from energy

  1. Use:
  2. η=EusefulEtotal\eta=\frac{E_{\text{useful}}}{E_{\text{total}}}η=Etotal​Euseful​​
  3. EusefulE_{\text{useful}}Euseful​ and EtotalE_{\text{total}}Etotal​ are both measured in joules (J)(\text{J})(J).
  4. For a percentage, multiply the ratio by 100%100\%100%.
Example
  • A motor receives 800 J800\ \text{J}800 J and transfers 600 J600\ \text{J}600 J usefully.
  • η=600800=0.75=75%\eta=\frac{600}{800}=0.75=75\%η=800600​=0.75=75%
  • The remaining 200 J200\ \text{J}200 J is dissipated.

Rearrange for missing energies

  1. Euseful=ηEtotalE_{\text{useful}}=\eta E_{\text{total}}Euseful​=ηEtotal​
  2. Etotal=EusefulηE_{\text{total}}=\frac{E_{\text{useful}}}{\eta}Etotal​=ηEuseful​​
Example
  • A lamp is 0.180.180.18 efficient and receives 250 J250\ \text{J}250 J.
  • Euseful=0.18×250 J=45 JE_{\text{useful}}=0.18\times250\ \text{J}=45\ \text{J}Euseful​=0.18×250 J=45 J

Power gives the same ratio

  1. When input and output are measured over the same time:
  2. η=PusefulPtotal\eta=\frac{P_{\text{useful}}}{P_{\text{total}}}η=Ptotal​Puseful​​
  3. Use two energies or two powers; never divide energy by power.
Example
  • A heater takes 2.0 kW2.0\ \text{kW}2.0 kW and transfers 1.7 kW1.7\ \text{kW}1.7 kW usefully.
  • η=1.72.0=0.85=85%\eta=\frac{1.7}{2.0}=0.85=85\%η=2.01.7​=0.85=85%

Useful output depends on purpose

  1. Light is useful for a lamp, kinetic energy is useful for a motor and heating water is useful for a kettle.
  2. Other outputs are unwanted for that purpose, even if the same transfer is useful in another device.
Exam technique
  • Identify the useful output first, then divide useful by total in that order.
  • Convert 72%72\%72% to 0.720.720.72 before using it in a rearranged equation.
  • Show the ratio and final decimal or percentage.

Check units and limits

Common Mistake
  • Do not divide total by useful, because that gives a value above 111 for a real device.
  • Do not attach joules or watts to efficiency.
  • Do not add a percentage sign to a decimal unless you multiply by 100100100.
  1. Check that useful energy is no greater than total energy.
  2. Use Edissipated=Etotal−EusefulE_{\text{dissipated}}=E_{\text{total}}-E_{\text{useful}}Edissipated​=Etotal​−Euseful​ when the unwanted transfer is required.
Self review
  • Define efficiency.
  • State the efficiency equation.
  • How is a decimal efficiency converted to a percentage?
  • Calculate the efficiency when 350 J350\ \text{J}350 J of 500 J500\ \text{J}500 J is useful.

3.2.4 Increasing efficiency

Increasing efficiency reduces unwanted transfers

Definition

Efficiency

Efficiency is the ratio of useful energy transferred by a device to the total energy supplied to it.

  1. Efficiency rises when a larger fraction of the same input reaches the intended useful store.
  2. For a fixed input, Etotal=Euseful+EdissipatedE_{\text{total}}=E_{\text{useful}}+E_{\text{dissipated}}Etotal​=Euseful​+Edissipated​, so reducing dissipation increases useful output.

Reduce friction and resistance

  1. Lubricating bearings and gears reduces friction, so less energy enters thermal stores and more reaches the kinetic output.
  2. Ball bearings, smooth surfaces and aligned parts can reduce rubbing and deformation.
  3. Lower-resistance conductors and secure electrical connections reduce unwanted heating by current.

Reduce drag and unwanted vibration

  1. Streamlining reduces air resistance, so less energy is transferred to the thermal stores of the air and vehicle.
  2. Reducing unnecessary vibration limits transfers as sound and heating.
  3. A method improves efficiency only when it reduces an output that is unwanted for the device's intended purpose.
Example
  • A motor receives 1000 J1000\ \text{J}1000 J and initially transfers 650 J650\ \text{J}650 J usefully.
  • ηbefore=6501000=65%\eta_{\text{before}}=\frac{650}{1000}=65\%ηbefore​=1000650​=65%
  • After lubrication, only 200 J200\ \text{J}200 J is dissipated, so 800 J800\ \text{J}800 J is useful.
  • ηafter=8001000=80%\eta_{\text{after}}=\frac{800}{1000}=80\%ηafter​=1000800​=80%

Insulation improves heating systems

  1. Insulation around a hot-water tank reduces transfer to the surroundings, leaving more energy in the water's thermal store.
  2. A lid reduces convection and evaporation, so less energy is required to heat the contents.
  3. Loft insulation, cavity-wall insulation, double glazing and draught proofing reduce transfers from buildings.
  4. Insulation is not always helpful because refrigerators and computers need controlled heat removal.
Key Idea

Match the improvement to the unwanted pathway: friction, resistance, drag, sound or thermal transfer.

Improvements have limits

  1. No real process reaches 100%100\%100% efficiency because some unwanted transfers are unavoidable.
  2. An improvement may add mass, cost, maintenance or manufacturing impacts.
  3. Extra insulation gives progressively smaller savings once transfer through that part is already low.
Exam technique
  • Name the change, identify the unwanted transfer it reduces, then state that a greater fraction of the input is useful.
  • Do not write only that less energy is wasted; identify the destination or mechanism.

Judge changes from evidence

  1. Compare devices under the same operating conditions and for the same useful task.
  2. A measured efficiency increase should match a reduction in unwanted output or an increase in useful output.
Common Mistake
  • Do not claim total energy use falls unless the useful task and operating conditions are fixed.
  • Useful energy depends on purpose.
  • Do not remove friction where grip or braking is useful.
Self review
  • How does lubrication increase motor efficiency?
  • Why can streamlining increase efficiency?
  • How does insulation improve a hot-water system?
  • Why can no real device exceed 100%100\%100% efficiency?

3.3.1 Energy resources: renewable and non-renewable

Energy resources differ in renewal, reliability and impact

Definition

Renewable energy resource

A renewable energy resource is replenished naturally at least as quickly as it is used, so it will not run out through use on a human timescale.

Definition

Non-renewable energy resource

A non-renewable energy resource is finite and is used faster than natural processes can replace it.

  1. Resources provide heating, transport and electricity but differ in reliability, response time, output, impact, location and cost.
  2. Renewable resources often depend on weather conditions and have lower efficiency rates non-renewable energy resources.

Fossil fuels and nuclear fuel are non-renewable

  1. Fossil fuels are coal, oil and natural gas.
  2. They can be stored and burned when required, giving controllable output.
  3. Combustion releases carbon dioxide and can release sulfur dioxide and particulates; extraction and transport can also damage habitats.
  4. Nuclear fuel produces large continuous outputs with no carbon dioxide from fuel combustion during operation.
  5. Nuclear stations are expensive to build and decommission, create long-lived radioactive waste and require strict safety systems.

Biofuel depends on sustainable replacement

  1. Biofuel is made from recent living material such as crops, wood or organic waste.
  2. Plants absorb carbon dioxide while growing, but cultivation, processing and transport can create net emissions.
  3. Fuel crops can compete with food production and use land, water and fertiliser.
  4. Biofuel is renewable only when new biomass grows at least as quickly as it is harvested.

Wind, water and sunlight are renewable flows

  1. Wind has no fuel emissions during operation but is intermittent and needs exposed sites.
  2. Hydroelectricity can start quickly and give large output, but dams flood land and alter rivers.
  3. Tidal power is predictable, but suitable coastal sites are limited and barrages disrupt estuaries.
  4. Solar energy produces electricity or heats water, but output varies with daylight, season and cloud.
  5. Manufacture and construction still have environmental impacts even when operation uses no fuel.

Choose resources for the required use

  1. Transport favours energy-dense fuels or stored electricity because vehicles carry their supply.
  2. Heating can use gas, electricity, biomass, solar thermal energy or heat pumps.
  3. Electricity networks combine resources because demand changes and no single source is ideal everywhere.
Example
  • A windy coastal community could use wind power to reduce operational emissions.
  • Intermittency means it also needs storage, backup generation or connection to a wider grid.
  • Tidal output is more predictable but requires a suitable site and may damage estuary habitats.
Exam technique
  • Compare both resources against the same criterion, such as reliability or emissions.
  • Separate operational emissions from construction, extraction and decommissioning impacts.
  • Link local conditions to output and then to demand.
Common Mistake
  • Nuclear fuel is non-renewable.
  • Biofuel is not automatically carbon neutral.
  • Renewable resources can still cause environmental damage.

An energy mix balances constraints

  1. Renewables reduce dependence on finite fuels, but variable output can require storage and backup.
  2. Non-renewable stations can provide controllable output, but create fuel, emission or waste problems.
  3. The best mix depends on geography, demand, technology, acceptable impacts and timescale.
Self review
  • Define a renewable resource.
  • Give two advantages and two disadvantages of fossil fuels.
  • Why is biofuel not automatically carbon neutral?
  • Compare wind and tidal power for predictability.
  • Why are several resources used together?

3.3.2 Patterns and trends in energy use

Energy-use trends reflect demand and technology

Definition

Trend in energy use

A trend in energy use is a long-term change in the amount of energy used or in the proportion supplied by different resources.

  1. Data may show total consumption, consumption per person, use by sector or the share from each resource.
  2. A pattern describes the evidence, while an explanation identifies a cause.
  3. Check the period, units and whether the axis shows an amount, rate or percentage.

Demand changes across time and place

  1. Daily electricity demand rises when homes and businesses use many appliances at once and falls during low-activity periods.
  2. Seasonal demand changes with temperature and daylight, affecting heating, cooling and lighting.
  3. Industrialisation, population growth and higher incomes can raise total use through manufacturing, transport and buildings.
  4. Efficiency, insulation, changes in industry and conservation policies can reduce demand or slow its growth.
  5. Total use can rise even while use per person falls if population grows sufficiently.

The resource mix also changes

  1. Fossil-fuel use can fall when emissions limits tighten, fuel prices rise or lower-carbon technologies become cheaper.
  2. Renewable generation can rise as equipment, grids, storage and backup systems improve.
  3. Nuclear generation changes slowly because stations take years to build, operate for decades and are costly to decommission.
  4. Short-term changes may reflect weather, maintenance or fuel supply rather than a lasting trend.
Key Idea

Describe the numerical change first, then explain it with a cause that fits the same period and place.

Quantify changes before explaining them

  1. ΔE=Efinal−Einitial\Delta E=E_{\text{final}}-E_{\text{initial}}ΔE=Efinal​−Einitial​
  2. percentage change=Efinal−EinitialEinitial×100%\text{percentage change}=\frac{E_{\text{final}}-E_{\text{initial}}}{E_{\text{initial}}}\times100\%percentage change=Einitial​Efinal​−Einitial​​×100%
  3. Power is the rate of energy transfer:
  4. P=EtP=\frac{E}{t}P=tE​
  5. Use 1 kW=1000 W1\ \text{kW}=1000\ \text{W}1 kW=1000 W, 1 MW=106 W1\ \text{MW}=10^6\ \text{W}1 MW=106 W and 1 kWh=3.6×10⁶ J1\ \text{kWh}=3.6\times10^6\ \text{J}1 kWh=3.6×10⁶ J.
Example
  • Renewable generation rises from 80 TWh80\ \text{TWh}80 TWh to 116 TWh116\ \text{TWh}116 TWh.
  • ΔE=116−80=36 TWh\Delta E=116-80=36\ \text{TWh}ΔE=116−80=36 TWh
  • percentage increase=3680×100%=45%\text{percentage increase}=\frac{36}{80}\times100\%=45\%percentage increase=8036​×100%=45%
Practical

Conservation of energy using a trolley on a ramp

  • Aim: compare the decrease in gravitational potential energy with the increase in kinetic energy as a trolley descends a ramp.
  • Apparatus: dynamics trolley, rigid ramp, blocks and clamp, light gate and data logger, interrupt card, metre rule, balance, vertical height scale, stop block and masking tape.
  • Variables: release height is independent, speed and calculated kinetic energy are dependent, and trolley mass, ramp angle, release method, gate position and card length are controlled.
  • Method:
    • Measure the total mass mmm of the trolley and interrupt card in kilograms.
    • Secure the ramp and stop block, then place the light gate near the bottom so the card passes centrally through it.
    • Measure the interrupt-card length and set the logger to calculate speed from card length divided by blocking time.
    • Mark at least five release positions and measure each vertical height hhh above the light-gate level, not the distance along the ramp.
    • Release the trolley from the first mark without pushing and record its speed vvv at the gate.
    • Repeat at least three times, calculate the mean speed and investigate anomalous readings.
    • Repeat for every height while keeping the ramp angle and light-gate position fixed.
  • Processing: calculate ΔEg=mgh\Delta E_{\mathrm{g}}=mghΔEg​=mgh and Ek=12mv2E_{\mathrm{k}}=\dfrac{1}{2}mv^2Ek​=21​mv2, then plot EkE_{\mathrm{k}}Ek​ against ΔEg\Delta E_{\mathrm{g}}ΔEg​.
  • Expected pattern: greater height gives larger values of both energies, but kinetic energy is usually smaller because friction, air resistance, wheel rotation and sound receive energy.
  • Uncertainty and improvements: measure vertical height at eye level, use electronic timing, repeat readings, align the trolley and use a low-friction runway.
  • Safety: clamp the ramp, use a stop block, keep clear of the trolley and use a modest height.

Interpret trends without overclaiming

  1. Correlation alone does not prove causation; an explanation must be physically plausible and fit the evidence.
  2. Interpolation within the measured range is more reliable than extrapolation beyond it because the trend may change.
  3. Year-to-year fluctuations should not be called a long-term trend unless the overall pattern supports that conclusion.
Exam technique
  • Quote values with units, calculate the change, then give a cause linked to the same resource, place and period.
  • Distinguish total energy use from the percentage supplied by one resource.
  • For conservation data, account for missing measured energy as transfers to thermal and other stores.

Avoid common data errors

  1. A strong conclusion states direction, magnitude and timescale before giving a supported cause.
  2. Where evidence is limited, state that the data are consistent with an explanation rather than claiming certainty.
Common Mistake
  • Use the initial value as the denominator for percentage change.
  • Check that graph lines use the same axes and units before comparing them.
  • Do not treat a one-year weather fluctuation as a permanent trend.
Self review
  • What distinguishes a pattern from an explanation?
  • State the percentage-change equation.
  • Why can total use rise while use per person falls?
  • Why may measured kinetic energy be below the decrease in gravitational potential energy?
  • Why is extrapolation less reliable than interpolation?

9.3.1 Reducing unwanted energy transfer through lubrication

Friction and the energy it wastes

Definition

Friction

Friction is a force that opposes the relative motion between two surfaces in contact.

Definition

Dissipation

Dissipation is the spreading of transferred energy into the thermal energy stores of the surroundings, which makes the energy less useful for further transfers.

  1. No surface is perfectly smooth, because even polished metal carries microscopic bumps and hollows.
  2. When two surfaces slide over each other these bumps catch, and the surfaces have to be forced past one another, which is where friction comes from.
  3. The moving object therefore has to do work against friction, and doing work is a transfer of energy.
  4. That energy is not destroyed, because it is dissipated into the thermal energy stores of the two surfaces and then spreads out into the surroundings.
  5. The transfer counts as unwanted because the energy is spread so thinly that it cannot be recovered to do a useful job, so less of the input energy reaches the intended output.
  6. Friction also wears the surfaces away and raises their temperature, which shortens the working life of bearings, gears, chains and pistons.
  7. In a bicycle chain, a car engine or a stiff door hinge, every joule dissipated by friction is a joule the machine never delivers.

How lubrication reduces the transfer

Definition

Lubrication

Lubrication is the use of a substance, such as oil or grease, between moving surfaces to reduce friction and the unwanted transfer of energy by heating.

  1. A lubricant is a fluid, usually an oil or a grease, placed between two surfaces that move over each other.
  2. The lubricant is drawn into the gap and forms a thin layer that holds the two solid surfaces apart.
  3. With the bumps no longer catching directly on each other, the frictional force between the surfaces becomes much smaller.
  4. Because the frictional force is smaller, less work is done against friction for the same amount of movement.
  5. Less work done against friction means less energy is dissipated into the thermal energy stores of the parts and the surroundings.
  6. A larger share of the input energy is then transferred usefully, so the machine becomes more efficient, runs cooler and wears more slowly.
  7. The chain of reasoning to write out in an answer runs as follows.
    1. The lubricant separates the moving surfaces.
    2. The frictional force between them is reduced.
    3. Less work is done against friction.
    4. Less energy is dissipated by heating.
  8. Lubrication never removes friction completely, because layers of the fluid still resist sliding over each other, although that resistance is far smaller than dry contact between two solids.
  9. A lubricant also carries heat away from the contact and flushes out particles worn from the surfaces, which is why engine oil is pumped around a circuit and then changed.

Comparing rates of energy transfer

  1. The energy wasted by a machine is often quoted as a rate, which is the energy transferred divided by the time taken.
  2. The equation is rate of energy transfer=energy transferredtime taken\text{rate of energy transfer} = \dfrac{\text{energy transferred}}{\text{time taken}}rate of energy transfer=time takenenergy transferred​.
  3. A rate measured in joules per second, J/s\text{J/s}J/s, is the same quantity as a power measured in watts, W\text{W}W.
  4. Rates given per minute or per hour have to be converted before they can be compared, by dividing by 606060 to change minutes into seconds and by 360036003600 to change hours into seconds.
  5. Comparing the wasted rate before and after lubrication as a ratio shows how much the change has achieved, and the ratio is simplified by dividing both numbers by their highest common factor.
  6. A ratio of 4:14:14:1 means the wasted rate has fallen to a quarter of its original value, so lubrication has cut the waste by a factor of 444.
  7. Proportional reasoning works forwards as well, so halving the frictional force over the same distance halves the work done against friction and therefore halves the rate at which energy is dissipated.
Practical

Investigating levers and gears

  • Aim: to investigate how the distance of an applied force from a pivot changes the force needed to lift a fixed load, and how a pair of meshing gears transmits rotation.
  • Apparatus: metre rule or wooden lever bar, triangular knife-edge pivot, clamp stand and boss, G-clamp, newtonmeters reading to 10 N10\ \text{N}10 N and to 50 N50\ \text{N}50 N, slotted masses and hanger, string loops, a mounting board carrying gear wheels with different numbers of teeth, marker pen, ruler and a soft mat.
  • Variables: the distance of the applied force from the pivot is the independent variable, the force needed to just lift the load is the dependent variable, and the size of the load, the position of the load, the position of the pivot, the lever itself and the direction of the pull are all controlled.
  • Method, setting up the lever:
    • Clamp the pivot to the bench and balance the metre rule on it so that it rests level with nothing hanging from it.
    • Hang the load from a fixed point on one side, for example a 5.0 N5.0\ \text{N}5.0 N weight at 0.10 m0.10\ \text{m}0.10 m from the pivot, and record that distance in metres.
    • Loop the string of the newtonmeter over the rule on the other side, at a measured distance from the pivot.
  • Method, taking the lever readings:
    • Pull the newtonmeter steadily downwards, keeping it at right angles to the rule so that the distance measured is the normal distance.
    • Read the force at the instant the load just lifts clear of the bench, and record it in newtons.
    • Repeat the reading three times at that distance and calculate a mean, investigating any anomalous reading rather than deleting it.
    • Move the newtonmeter 0.10 m0.10\ \text{m}0.10 m further from the pivot and repeat, covering at least six distances out to the end of the rule.
  • Method, the gears:
    • Mount two gears of different sizes so that their teeth mesh without binding, and count the teeth on each one.
    • Mark one tooth on each gear with the pen so that complete turns can be counted.
    • Turn the smaller gear slowly through a whole number of turns and count the turns made by the larger gear, noting the direction each one turns.
    • Repeat each count three times, then place a third gear between the pair and record how the direction of the final gear changes.
  • Results: the force needed to lift the same load falls as the applied force is moved further from the pivot, and the product of force and distance stays roughly constant because the moment needed to lift the load is fixed.
  • Results for the gears: two directly meshing gears turn in opposite directions, and the number of turns each gear makes is in inverse proportion to its number of teeth.
  • Maths:
    • calculate the moment of the applied force at each distance using M=F dM = F\,dM=Fd and compare it with the moment of the load.
    • plot applied force against distance from the pivot to give a falling curve, then plot applied force against 1d\dfrac{1}{d}d1​, which should give a straight line through the origin.
    • Maths for the gears: check that turns of driving gearturns of driven gear\dfrac{\text{turns of driving gear}}{\text{turns of driven gear}}turns of driven gearturns of driving gear​ equals teeth on driven gearteeth on driving gear\dfrac{\text{teeth on driven gear}}{\text{teeth on driving gear}}teeth on driving gearteeth on driven gear​.
  • Watch out:
    • friction at the pivot and the weight of the rule itself make the measured force slightly larger than the calculated value.
    • a newtonmeter that is not perpendicular to the rule means the measured distance is not the normal distance, so the moment is overestimated.
    • judging the exact instant the load lifts is a real source of uncertainty, which is why repeats and a mean matter here.
    • worn or badly meshed gear teeth can slip, so count whole turns rather than fractions of a turn.
  • Safety: clamp the stand and the pivot firmly so that the loaded rule cannot topple off the bench.
  • Safety: keep feet clear of the hanging masses and place a soft mat beneath them.
  • Safety: turn the gears by the rim rather than by the teeth, so that fingers stay clear of the meshing point.
Example

Comparing the rate of wasted energy

  • A gearbox transfers 4800 J4800\ \text{J}4800 J to its surroundings in 2.0 min2.0\ \text{min}2.0 min before it is lubricated, and 1200 J1200\ \text{J}1200 J in the same time afterwards.
  • Convert the time first, so 2.0 min=2.0×60=120 s2.0\ \text{min} = 2.0 \times 60 = 120\ \text{s}2.0 min=2.0×60=120 s.
  • The rate before lubrication is 4800120=40 J/s\dfrac{4800}{120} = 40\ \text{J/s}1204800​=40 J/s.
  • The rate after lubrication is 1200120=10 J/s\dfrac{1200}{120} = 10\ \text{J/s}1201200​=10 J/s.
  • The two rates are in the ratio 40:1040:1040:10, which simplifies to 4:14:14:1.
  • Lubrication has cut the rate of unwanted energy transfer to a quarter of its original value.
Example

Converting a wasted energy rate into watts

  • A stiff hinge dissipates 54 kJ54\ \text{kJ}54 kJ to the surroundings over 303030 minutes of use.
  • Convert the energy, so 54 kJ=54 000 J54\ \text{kJ} = 54\,000\ \text{J}54 kJ=54000 J.
  • Convert the time, so 30 min=30×60=1800 s30\ \text{min} = 30 \times 60 = 1800\ \text{s}30 min=30×60=1800 s.
  • The rate is 54 0001800=30 J/s\dfrac{54\,000}{1800} = 30\ \text{J/s}180054000​=30 J/s.
  • A rate of 30 J/s30\ \text{J/s}30 J/s is the same as a power of 30 W30\ \text{W}30 W dissipated by the hinge.
Common Mistake
  • Do not write that friction uses up or destroys energy, because energy is conserved and friction transfers it into thermal energy stores.
  • Do not say that oil makes the surfaces smoother, because a lubricant works by holding the surfaces apart rather than by polishing them.
  • Do not claim that lubrication removes friction, since the layers of lubricant still resist sliding over one another.
  • Do not compare two rates before converting them to the same unit of time, because a rate per minute and a rate per second are not comparable numbers.
Exam technique

Writing the lubrication explanation

  • Give the full chain from lubricant to energy, because each link in it tends to carry its own mark.
  • Use the word friction explicitly, since answers that mention only resistance or smoothness are usually not credited.
  • Finish on the energy statement, saying that less energy is dissipated into the thermal energy stores of the surroundings.
  • In a rate comparison, show the time conversion on its own line before dividing, so the method mark is safe even if the arithmetic slips.
  • Simplify a ratio to its lowest terms and then say in words what it means, such as a quarter of the original rate.
Self review
  • Explain why two dry sliding surfaces become hotter as they move over each other.
  • State the four steps that link adding a lubricant to a fall in wasted energy.
  • Explain why lubrication reduces friction without removing it completely.
  • Convert an energy transfer of 3600 J3600\ \text{J}3600 J in 3.03.03.0 minutes into a rate in J/s\text{J/s}J/s.
  • Describe how the force needed to lift a load on a lever changes as the force is applied further from the pivot.

Recap questions

1 of 5

A hair dryer is supplied with electrical energy and its useful output is moving warm air. Some energy is also transferred as sound, so which part is wasted?

PreviousNext

How was this guide?

Teach Genie

Review 3.2 Efficiency and energy resources by teaching Genie

Teach it back in your own words, spot gaps, and remember it better.

Start teaching
Genie and Baby Genie

Lesson

Recap your knowledge with an interactive lesson

8 minute activity

Start lesson

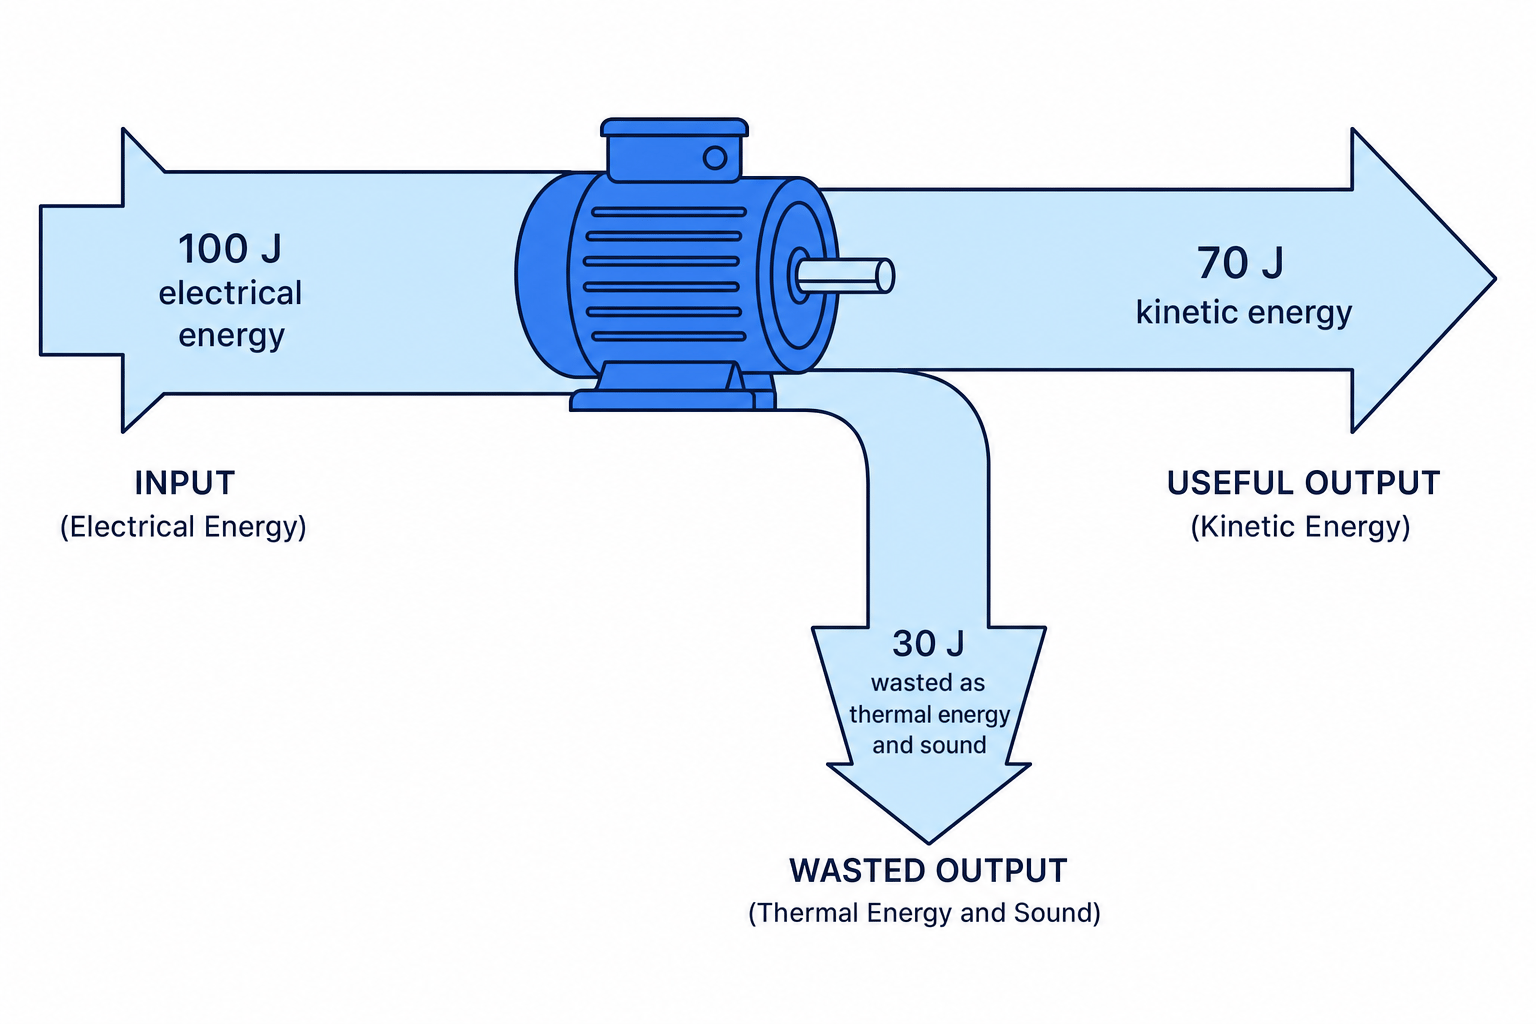
Sankey diagram of an electric motor with 100 J electrical input, 70 J useful kinetic output and 30 J wasted as thermal energy and sound In any device, energy is transferred from one store to another. The useful transfer is the part that does the job we want, while wasted energy is usually dissipated to the surroundings as heating or sound.

A Sankey diagram shows these transfers with arrows whose widths represent the amount of energy. The main forward arrow is usually the useful output, and side branches show wasted outputs.

Energy is conserved, so total input energy equals total useful output plus total wasted output. In the diagram, 100 J100\text{ J}100 J in becomes 70 J70\text{ J}70 J useful plus 30 J30\text{ J}30 J wasted.

Questions

Put it into practice with exam-style questions

38 exam-style questions

Practice questions

Question 1

2 marks

An electric winch motor is used to pull a boat up a slipway. Explain why the efficiency of this motor is less than 100%.

Flashcards

Remember key concepts with flashcards

25 flashcards

Practice flashcards

What usually happens to energy that is not usefully transferred by a device?

3.2 Efficiency and energy resources Revision Guide

  1. GCSE
  2. /Physics
  3. /3.2 Efficiency and energy resources

Revision notes for Edexcel GCSE Physics 3.2 Efficiency and energy resources. Open the guide for explanations and worked examples. Written against the Edexcel GCSE Physics (1PH0) specification, so the content matches what's examinable rather than general Physics background.