Question 3
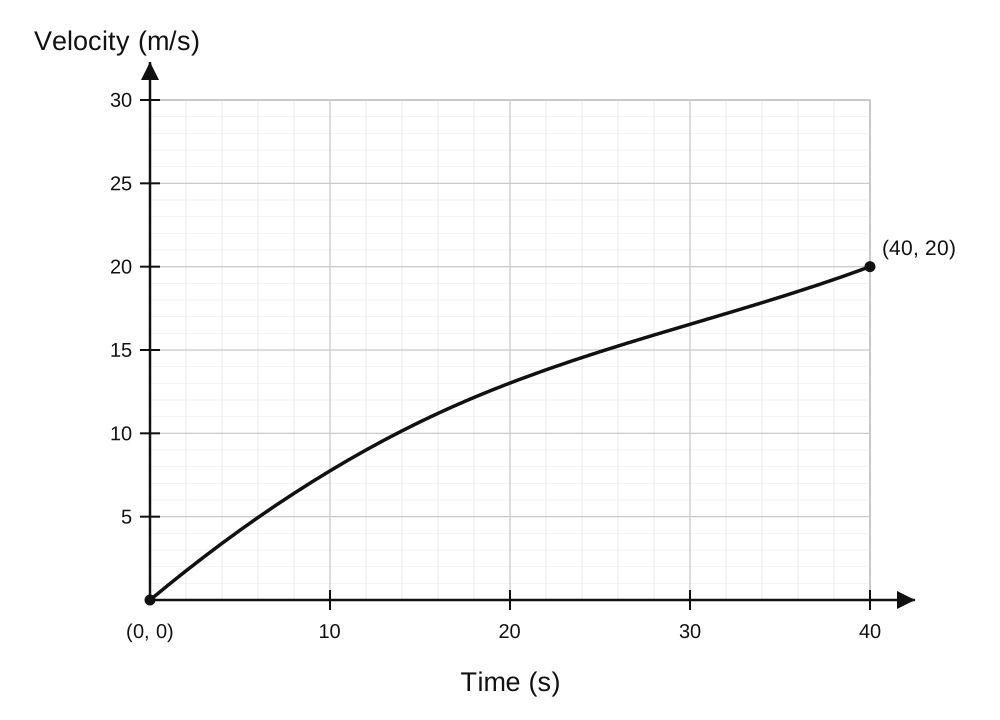
The velocity-time graph shows the motion of a motorcyclist accelerating from rest over a period of 40 seconds.
a.[2]
Work out the average acceleration during the 40 seconds.
Give the units of your answer.
b.[2]
Estimate the time during the 40 seconds when the instantaneous acceleration is equal to the average acceleration.
You must show your working on the graph.
Velocity Time Graphs Questions
23 exam-style questions on WJEC GCSE Maths Velocity Time Graphs. Each one has a worked solution and a mark scheme showing where the marks go.